Gray and White Matter Degenerations in Subjective Memory Impairment: Comparisons with Normal Controls and Mild Cognitive Impairment
Subjective memory impairment (SMI) is now increasingly recognized as a risk factor of progression to dementia. This study investigated gray and white matter changes in the brains of SMI patients compared with normal controls and mild cognitive impairment (MCI) patients. We recruited 28 normal controls, 28 subjects with SMI, and 29 patients with MCI aged 60 or older. We analyzed gray and white matter changes using a voxel-based morphometry (VBM), hippocampal volumetry and regions of interest in diffusion tensor imaging (DTI). DTI parameters of corpus callosum and cingulum in SMI showed more white matter changes compared with those in normal controls, they were similar to those in MCI except in the hippocampus, which showed more degenerations in MCI. In VBM, SMI showed atrophy in the frontal, temporal, and parietal lobes compared with normal controls although it was not as extensive as that in MCI. Patients with SMI showed gray and white matter degenerations, the changes were distinct in white matter structures. SMI might be the first presenting symptom within the Alzheimer’s disease continuum when combined with additional risk factors and neurodegenerative changes.
Keywords: Subjective Memory Impairment; Diffusion Tensor Imaging; Voxel-based Morphometry; Mild Cognitive Impairment
Yun Jeong Hong,1 Bora Yoon,2 Yong S. Shim,3 Kook Jin Ahn,4 Dong Won Yang,3 and Jae-Hong Lee1
1Department of Neurology, University of Ulsan College of Medicine, Asan Medical Center, Seoul;
2Department of Neurology, Konyang University College of Medicine, Daejeon; 3Department of Neurology, Catholic University of Korea, Seoul;
4Department of Radiology, Catholic University of Korea, Seoul, Korea
Received: 31 March 2015 Accepted: 11 August 2015 Address for Correspondence:
Dong Won Yang, MD
Department of Neurology, College of Medicine, The Catholic University of Korea, 222 Banpo-daero, Seocho-gu, Seoul 06591, Korea
Tel: +82.2-2258-6077, Fax: +82.2-599-9686 E-mail: [email protected]
Funding: This work was supported by a grant of the Korea Health 21 R&D Project (A102065) and the Korea Healthcare Technology R&D Project, Ministry of Health and Welfare, Republic of Korea (HI10C2020).
http://dx.doi.org/10.3346/jkms.2015.30.11.1652 • J Korean Med Sci 2015; 30: 1652-1658
INTRODUCTION
Subjects with subjective memory impairment (SMI) complain of memory impairment although they perform within the nor- mal range on neuropsychological tests. However, considerable evidence has shown that subjects with SMI are not typical in their cognitive functioning (1,2). Recently, a few studies using brain imaging have reported degenerations compatible with Alzheimer’s disease (AD) in subjects with SMI (2-4). SMI in el- derly is now increasingly recognized as a risk factor for progres- sion to mild cognitive impairment (MCI) and AD.
Voxel-based morphometry (VBM) detects gray matter atro- phy using three-dimensional magnetic resonance imaging (3D- MRI). VBM has been widely used to detect structural changes related to AD. On the other hand, diffusion tensor imaging (DTI) can be used to quantify microscopic white matter integrity not detectable on conventional MRI (5). Recently, white matter struc- tures such as cingulum or hippocampus have been shown to be damaged early in AD (6,7). However, the few studies that have examined microstructural or macrostructural degeneration in
subjects with SMI have reported conflicting results (4,8,9). A few reported that SMI showed gray matter atrophy comparable with AD (9), whereas others showed intermediate microstruc- tural degenerations between normal controls and MCI (8) or conflicting results between cortical thickness and white matter changes (4). These might be due to the lack of a general inclu- sion criteria and existence of several terms that complicates the comparability of results (9). Hence, we planned a cross-section- al study which adopted various approaches to clarify the degree of neurodegeneration. We investigated whether brain MRI shows any gray and white matter changes in elderly SMI subjects com- pared with normal controls and amnestic MCI.
MATERIAL S AND METHODS Subjects and evaluations
All participants except normal controls were referrals to the memory clinic of St. Mary’s Hospital for a diagnostic work-up due to memory complaints. All participants underwent neuro- logical examinations, detailed neuropsychological tests and Neuroscience
blood tests. Geriatric depression scale (GDS) was done using the Korean version of GDS including 30-item questions based on the original version by Yesavage et al. (10). Furthermore, all participants underwent brain MRI scans, including DTI and 3D T1-weighted imaging (spoiled gradient recalled echo, SPGR).
The MRIs were carefully examined and we excluded subjects with severe white matter hyperintensities (Fazekas scale 3), mul- tiple (more than five) lacunes, hemorrhages, or tumors because these may cause cognitive disorders unrelated to AD pathology.
Subjects were excluded if they were younger than 60 yr of age or had a disease that may cause a cognitive disorder or a major psychiatric disease except major depression. Patients with ab- normal lab findings (e.g., abnormal thyroid function, low vita- min B12/folate, positive syphilis serology) were excluded.
The detailed neuropsychological battery, named Seoul Neu- ropsychological Screening Battery (SNSB) (11), contains tests for attention, confrontational naming, visuospatial function, verbal and visual memory function. Scores below the 16th per- centile compared with age-, gender-, and education-specific norms, which are comparable to -1 standard deviation (SD), were defined as abnormal. Subjects with SMI and the normal controls showed no cognitive impairment on all domains of SNSB and scores on the Korean version of the Mini-Mental State Examination (K-MMSE) (12) were at least -1.0 SD compared with age- and education-matched norms. Normal controls (n = 28) without memory complaints were recruited from the gen- eral population by advertisement. Their clinical dementia rat- ing scale (CDR) score was zero and they were also assessed us- ing a questionnaire of the 28 illnesses proposed by Christensen (13) that may be associated with cognitive impairment. Inclu- sion criteria for SMI included the followings: elderly subjects who complained of memory declines but performed within the normal ranges on all domains of SNSB (n = 28). Finally, we en- rolled 29 patients with amnestic MCI who fulfilled the clinical diagnostic criteria of Petersen et al. (14).
DTI imaging acquisition and processing
DTIs were acquired using a 1.5-Tesla MRI (Signa Excite 11.0, GE Medical Systems, Milwaukee, WI, USA) with a single-shot, spin- echo, echo-planar, diffusion-weighted sequence. A series of ax-
ial diffusion-weighted images with a diffusion-sensitizing gra- dient (b value = 1,000 s/mm2) along 25 directions was obtained, as well as axial images without diffusion weighting (b value = 0). Other diffusion parameters were as follows: TR = 10,000 ms, TE = 83.3 ms, matrix = 128 × 128 mm, field of view = 260 mm
× 260 mm, number of excitations = 1, 33 axial slices, and slice thickness = 4 mm, with no inter-slice gap.
The raw DTI data (DICOM files) were processed using the programs Volume-One and dTVII (www.volume-one.org, www.
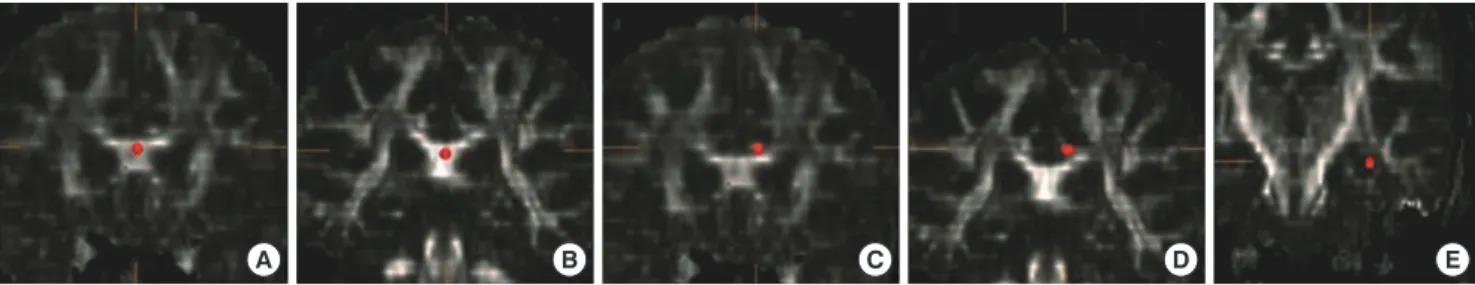
utradiology.umin.jp/people/masutani/dTV.htm). The fraction- al anisotropy (FA) and mean diffusivity (MD) values were mea- sured using the region-of-interest (ROI) method in the bilateral hippocampal body, anterior and posterior cingulum, and ante- rior and posterior corpus callosum. Each ROI was a 3D based voxels of interest (VOI), with a size of 19 μL; All ROIs were man- ually drawn on a coronal-section image by the same rater blind- ed to the diagnosis (Fig. 1). The FA and MD values were obtain- ed three times, and the mean value was measured. The intra- class correlation coefficients for each measurement varied from 0.763 to 0.927 for this rater.
Anatomical landmarks according to Bernasconi (15) were used for hippocampal ROIs. ROIs for the cingulum and corpus callosum were placed according to the landmarks of Atmaca and colleagues (16). We coregistered the various DTI images of the subjects using the “Add computational channels” tool in the dTV.II program and found landmarks by comparing the various images in various planes to avoid the effect of any CSF contam- ination or any evaluator bias by misplacement of ROIs.
Voxel based morphometry
SPGRs were performed using a 1.5-Tesla MRI (Signa Excite 11.0, GE Medical Systems) with 1.2-mm slice thickness, field of view (FOV) = 260 × 260 mm, number of excitation (NEX) = 1, no in- terslice gap, TR = 22 ms, TE = 6 ms, and flip angle = 30°. The images were saved in DICOM format and changed to an appro- priate format for VBM using MRIcro. VBMs were performed us- ing the SPM5 software (http://www.fil.ion.ucl.ac.uk/spm/soft- ware/spm5/). The procedures were as follows: Spatial normal- ization, modulation to compensate for voxel differences, tissue segmentation into gray matter, white matter and CSF, and final-
A B C D E
Fig. 1. Region-of-interest in each area. (A) Anterior corpus callosum. (B) Posterior corpus callosum. (C) Left anterior cingulum. (D) Left posterior cingulum. (E) Left hippocampal body.
ly smoothing with a 12-μL full-width at half-maximum Gauss- ian kernel for preprocessing. After image processing, voxel-based comparisons among the groups were made using two-sample t-tests between groups. Because mean age, gender, and educa- tional levels were similar among the groups, only total intracra- nial volume (TIV), obtained automatically using SPM5, was used as a covariate. Only areas with voxel levels of P = 0.005, uncor- rected, were regarded as significant.
Volumetry of the hippocampus
We measured the volume of the bilateral hippocampus in all participants. The software package Analyze (ver. 10.0; Mayo Clinic Foundation, Rochester, MN, USA) was used for manual measurements for the volumes of the hippocampus on each side. The DICOM files of the MRI were converted to Analyze files, which were reformatted to cubic volume (3D) with re- sliced 0.97-mm image thickness. To calculate the volume of each part, we multiplied areas by the section thickness, and these values were summed. Hippocampal volumes were divid- ed into TIV to compensate for individual differences in brain size among subjects. We used the anatomical boundaries of the hippocampus proposed by Pruessner (17). The test and retest intraclass correlation coefficients of the hippocampal volumes for the rater were 0. 931 (right hippocampus) and 0.945 (left hippocampus).
Statistical analysis
We compared the mean FA and MD values among the three groups using ANOVA and post hoc analyses using the SPSS soft- ware (ver. 12.0). The Bonferroni method was used if equal vari- ance was assumed, and Dunnett’s T3 method was used if equal variance was not assumed in post hoc analyses. Comparisons
of age, education, mean neuropsychological tests results, FA values, MD values, and hippocampal volume ratios were made among groups. For comparisons of gender distribution, chi- square tests were used. All statistical tests were performed at the 5% level of significance.
Ethics statement
This study was approved by the institutional review board of St.
Mary’s Hospital of the Catholic University (IRB No. KC11RA- SI0132). Written informed consent was obtained after provid- ing a complete description of the study to the subjects and their caregivers.
RESULTS
The basic demographic data and neuropsychological test re- sults are shown in Table 1. We found no difference in demogra- phics among the groups. All domains in SNSB except the verbal delayed recall test were similar between normal controls and SMI. The mean scores of verbal delayed recall test were differ- ent in each group although scores in both normal controls and SMI group were very high (88.0 ± 7.49 percentile in normal con- trol and 61.2 ± 23.44 percentile in SMI).
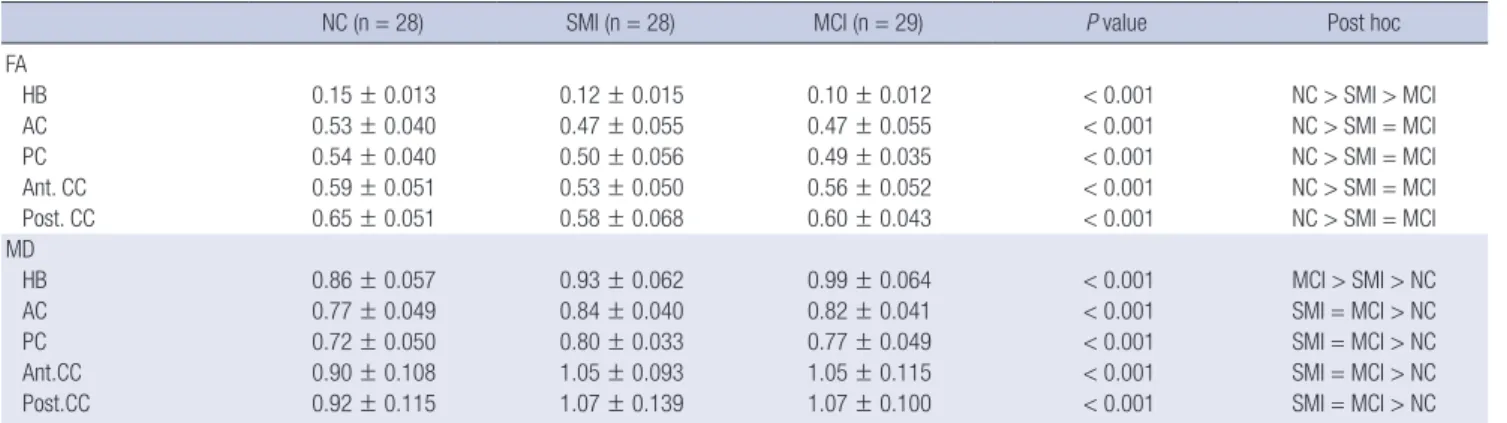
FA values in patients with SMI were lower, and their MD val- ues were higher than those of normal controls in all measured ROIs. Mean FA and MD values in subjects with SMI were simi- lar to those in patients with MCI, with the exception of the hip- pocampal body. FA values in the hippocampal body were high- est in normal controls, followed by SMI and MCI, in that order.
MD values in the hippocampal body were lowest in normal con- trols, and they were higher in SMI and MCI, in that order (Table 2).
In the VBM, patients with MCI showed gray matter atrophy
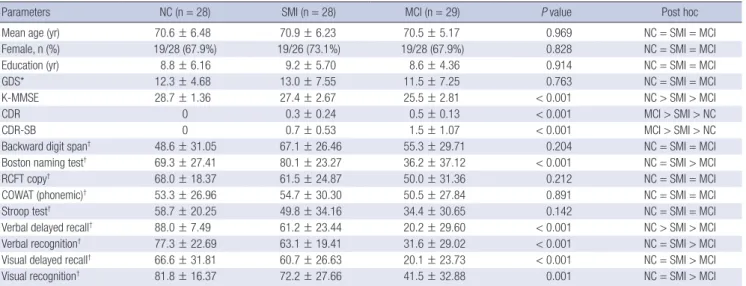
Table 1. Basic demographic and neuropsychological test results
Parameters NC (n = 28) SMI (n = 28) MCI (n = 29) P value Post hoc
Mean age (yr) 70.6 ± 6.48 70.9 ± 6.23 70.5 ± 5.17 0.969 NC = SMI = MCI
Female, n (%) 19/28 (67.9%) 19/26 (73.1%) 19/28 (67.9%) 0.828 NC = SMI = MCI
Education (yr) 8.8 ± 6.16 9.2 ± 5.70 8.6 ± 4.36 0.914 NC = SMI = MCI
GDS* 12.3 ± 4.68 13.0 ± 7.55 11.5 ± 7.25 0.763 NC = SMI = MCI
K-MMSE 28.7 ± 1.36 27.4 ± 2.67 25.5 ± 2.81 < 0.001 NC > SMI > MCI
CDR 0 0.3 ± 0.24 0.5 ± 0.13 < 0.001 MCI > SMI > NC
CDR-SB 0 0.7 ± 0.53 1.5 ± 1.07 < 0.001 MCI > SMI > NC
Backward digit span† 48.6 ± 31.05 67.1 ± 26.46 55.3 ± 29.71 0.204 NC = SMI = MCI
Boston naming test† 69.3 ± 27.41 80.1 ± 23.27 36.2 ± 37.12 < 0.001 NC = SMI > MCI
RCFT copy† 68.0 ± 18.37 61.5 ± 24.87 50.0 ± 31.36 0.212 NC = SMI = MCI
COWAT (phonemic)† 53.3 ± 26.96 54.7 ± 30.30 50.5 ± 27.84 0.891 NC = SMI = MCI
Stroop test† 58.7 ± 20.25 49.8 ± 34.16 34.4 ± 30.65 0.142 NC = SMI = MCI
Verbal delayed recall† 88.0 ± 7.49 61.2 ± 23.44 20.2 ± 29.60 < 0.001 NC > SMI > MCI
Verbal recognition† 77.3 ± 22.69 63.1 ± 19.41 31.6 ± 29.02 < 0.001 NC = SMI > MCI
Visual delayed recall† 66.6 ± 31.81 60.7 ± 26.63 20.1 ± 23.73 < 0.001 NC = SMI > MCI
Visual recognition† 81.8 ± 16.37 72.2 ± 27.66 41.5 ± 32.88 0.001 NC = SMI > MCI
Values are means ± SD. *GDS involves 30-item questions; †Scores of neuropsychological tests are shown in percentile scores. NC, normal controls; SMI, subjective memory impairment; MCI, mild cognitive impairment; GDS, geriatric depression scale; K-MMSE, Korean version of the Mini-Mental State Examination; CDR, clinical dementia rating;
CDR-SB, CDR-sum of boxes; RCFT, Rey complex figure test; COWAT, controlled oral word association test.
in the left hippocampus, posterior central gyrus, inferior frontal gyrus, mid cingulate gyrus, right medial frontal gyrus, and bilat- eral precuneus compared with normal controls. On the other hand, subjects with SMI showed gray matter atrophy in the left orbito-frontal gyrus, inferior frontal gyrus, right calcarine gyrus, precuneus, lingual gyrus, inferior temporal gyrus, and both mid cingulate areas, compared with normal controls (P < 0.001, un- corrected, Fig. 2, Table 3). Compared with that of SMI, patients with MCI showed significant atrophy in multiple fronto–parie- to–temporal regions, particularly in the left posterior area (P <
0.001, uncorrected, Fig. 2, Table 3). We also compared hippo- campal volume and found no difference between normal con- trols and subjects with SMI, whereas the mean hippocampal volume in patients with MCI was smaller than that of subjects with SMI and normal controls, particularly in the left hippocam- pus (Table 4).
DISCUSSION
We found significant microstructural changes and macrostruc- tural gray matter loss in the brains of subjects with SMI com- pared with normal controls; thus, confirming that subjects with SMI are neuroanatomically different from normal controls al-
though hippocampal volumetric changes are not yet apparent.
DTI revealed similar neurodegenerative changes in white mat- ter regions vulnerable to AD in subjects with SMI and MCI. The hippocampus is critical for memory and learning and is involv- ed early in AD (18). The corpus callosum connects neocortical areas and is important for cognitive functioning. The cingulum is part of the Papez circuit and plays an important role in mem- ory (19). However, the results of the VBM between subjects with SMI and MCI were somewhat different from those identified using DTI. VBM analysis revealed slightly different pattern and more extensive gray matter atrophy in patients with MCI than in those with SMI. Subjects with SMI showed cortical atrophy in several fronto–temporo–parietal areas compared with nor- mal controls, however, the findings disappeared after compar- ing SMI with MCI. Cortical atrophy develops in SMI as shown in this study, but this might be somewhat different with those in MCI, a more clinically symptomatic state. These seemingly inconsistent findings between the DTI and VBM may be the re- sult of dissociative pathological changes in the white matter and gray matter. Recently, it has been shown that alteration of DTI measures in early stage of AD is independent of gray mat- ter degeneration such as hippocampal volume or cortical thick- ness (4,8,20). Wallerian degeneration is not sufficient to explain Table 2. Fractional anisotropy (FA) and mean diffusivity (MD) results
NC (n = 28) SMI (n = 28) MCI (n = 29) P value Post hoc
FA
HB 0.15 ± 0.013 0.12 ± 0.015 0.10 ± 0.012 < 0.001 NC > SMI > MCI
AC 0.53 ± 0.040 0.47 ± 0.055 0.47 ± 0.055 < 0.001 NC > SMI = MCI
PC 0.54 ± 0.040 0.50 ± 0.056 0.49 ± 0.035 < 0.001 NC > SMI = MCI
Ant. CC 0.59 ± 0.051 0.53 ± 0.050 0.56 ± 0.052 < 0.001 NC > SMI = MCI
Post. CC 0.65 ± 0.051 0.58 ± 0.068 0.60 ± 0.043 < 0.001 NC > SMI = MCI
MD
HB 0.86 ± 0.057 0.93 ± 0.062 0.99 ± 0.064 < 0.001 MCI > SMI > NC
AC 0.77 ± 0.049 0.84 ± 0.040 0.82 ± 0.041 < 0.001 SMI = MCI > NC
PC 0.72 ± 0.050 0.80 ± 0.033 0.77 ± 0.049 < 0.001 SMI = MCI > NC
Ant.CC 0.90 ± 0.108 1.05 ± 0.093 1.05 ± 0.115 < 0.001 SMI = MCI > NC
Post.CC 0.92 ± 0.115 1.07 ± 0.139 1.07 ± 0.100 < 0.001 SMI = MCI > NC
Values are means ± SD. NC, normal controls; SMI, subjective memory impairment; MCI, mild cognitive impairment; FA, fractional anisotropy; MD, mean diffusivity; HB, hippo- campal body; AC, anterior cingulum; PC, posterior cingulum; Ant. CC, anterior corpus callosum; Post. CC, posterior corpus callosum.
Fig. 2. Voxel wise comparisons of gray matter atrophy among groups. (A) Gray matter atrophy in mild cognitive impairment (MCI) compared with normal controls. (B) Gray mat- ter atrophy in subjective memory impairment (SMI) compared with normal controls. (C) Gray matter atrophy in MCI compared with SMI. Results were considered statistically significant at P < 0.005, cluster level, uncorrected. The regions represent reduced gray matter density.
A B C
al degenerations measured by DTI probably because it is one of the most vulnerable and stage-sensitive structures of AD pro- cess (23).
An unexpected atrophic changes around brainstem and bas- al ganglia shown in Fig. 2 can be explained as incomplete regis- tration to conventional template, individual difference of brain- stem and basal ganglia, small vessel disease such as lacune that cause regional atrophy and heterogeneity of aMCI and SMI that include both AD and non-AD related pathology. Larger sample size and subject-specific template might improve the accuracy in the future study.
Our study has some limitations. First, pathological confirma- tion was lacking. Thus, subjects with pure depression or anxiety or other pathology unrelated with AD may have been included in the SMI group. The heterogeneity of SMI might be another explanation about the different results between patients with SMI and patients with MCI in the gray matter VBM. Hence, the results of our study should be interpreted with caution and fur- ther biomarker evaluations are needed. Second, we manually drew ROIs for the DTI analysis only in selected white matter structures specific to the AD process. Manual ROIs are useful for quantitative comparisons and are sensitive to changes in small structures, such as the hippocampus; however, this meth- od is a labor-intensive process, which makes it difficult to mea- sure multiple structures. However, whole-brain methods using standardized templates such as tract-based spatial statistics (TBSS) may not be suitable for quantitative analyses of small structures such as the hippocampus. An automated whole-brain ROI analysis might be a good option in future studies. Lack of information about other risk factors such as APOE4 carrier sta- tus and family history of dementia might be another limitation.
Future DTI studies should continue to address the association between genetic information and white matter changes in SMI.
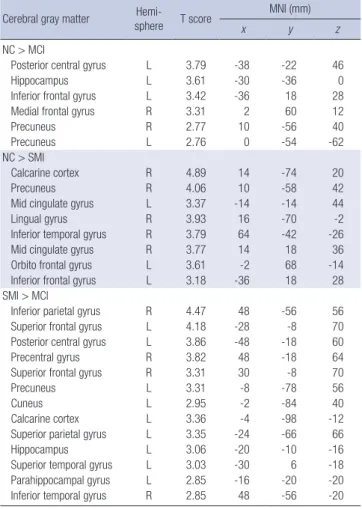
Despite these limitations, our study has strengths in that we carefully diagnosed candidates using detailed neuropsycholog- ical tests battery, enrolled relatively homogeneous subjects who were age-, gender- and education-matched, and adopted vari- ous neuroimaging techniques to compare different degrees of neurodegenerations among groups. Subjects with SMI in our study revealed significant white matter and gray matter chang- es compared with those in normal controls, although the gray matter atrophy was not comparable to those in MCI. We also report an interesting result that microstructural degeneration might be distinct than gray matter atrophy also in elderly with SMI. Additionally, detecting microstructural degeneration, par- Table 3. Voxel based morphometric analysis results
Cerebral gray matter Hemi-
sphere T score MNI (mm)
x y z
NC > MCI
Posterior central gyrus L 3.79 -38 -22 46
Hippocampus L 3.61 -30 -36 0
Inferior frontal gyrus L 3.42 -36 18 28
Medial frontal gyrus R 3.31 2 60 12
Precuneus R 2.77 10 -56 40
Precuneus L 2.76 0 -54 -62
NC > SMI
Calcarine cortex R 4.89 14 -74 20
Precuneus R 4.06 10 -58 42
Mid cingulate gyrus L 3.37 -14 -14 44
Lingual gyrus R 3.93 16 -70 -2
Inferior temporal gyrus R 3.79 64 -42 -26
Mid cingulate gyrus R 3.77 14 18 36
Orbito frontal gyrus L 3.61 -2 68 -14
Inferior frontal gyrus L 3.18 -36 18 28
SMI > MCI
Inferior parietal gyrus R 4.47 48 -56 56
Superior frontal gyrus L 4.18 -28 -8 70
Posterior central gyrus L 3.86 -48 -18 60
Precentral gyrus R 3.82 48 -18 64
Superior frontal gyrus R 3.31 30 -8 70
Precuneus L 3.31 -8 -78 56
Cuneus L 2.95 -2 -84 40
Calcarine cortex L 3.36 -4 -98 -12
Superior parietal gyrus L 3.35 -24 -66 66
Hippocampus L 3.06 -20 -10 -16
Superior temporal gyrus L 3.03 -30 6 -18
Parahippocampal gyrus L 2.85 -16 -20 -20
Inferior temporal gyrus R 2.85 48 -56 -20
Regions of more atrophic gray matter (P < 0.005, cluster level, uncorrected) were presented. NC, normal controls; SMI, subjective memory impairment; MCI, mild cog- nitive impairment.
Table 4. Comparisons of hippocampal volume among the groups
Regions NC (n = 28) SMI (n = 28) MCI (n = 29) P value Post hoc
Rt.hippocampus/TIV 1.563 ± 0.2031 1.556 ± 0.1669 1.400 ± 0.2537 0.013 NC = SMI > MCI
Lt.hippocampus/TIV 1.528 ± 0.1801 1.498 ± 0.1853 1.314 ± 0.2637 0.001 NC = SMI > MCI
Values are means ± SD. NC, normal controls; SMI, subjective memory impairment; MCI, mild cognitive impairment; TIV, total intracranial volume.
the preceding changes in DTI parameters. The etiology of these early independent changes is not established, it may be due to vascular pathology, direct effect of β-amyloid peptide or tau pa- thology on white matter microstructure (21,22).
Additionally, we analyzed the volume of the hippocampus using manual volumetry. Subjects with SMI showed no differ- ence compared with normal controls. Only patients with MCI showed significant hippocampal atrophy, particularly on the left, suggesting that the volume loss had not yet occurred in pa- tients with SMI. Interestingly, DTI analysis in hippocampus also showed more neurodegeneration in MCI compared with that in SMI although other regions showed similar degree of degeneration between the two groups. According to our results, smaller hippocampus in MCI also showed more microstructur-
ticularly in the hippocampus, may be complimentary to other MRI techniques because it can quantify the degree of white mat- ter neurodegeneration sensitively. In conclusion, subjects with SMI showed gray and white matter degenerations, the changes were distinct in white matter structures. Considering that AD pathology develops for decades before the diagnosis of demen- tia, SMI might be the first presenting symptom within AD con- tinuum when combined with additional risk factors and neuro- degenerative changes suggesting preclinical AD (24). Due to the heterogeneity of SMI, differentiating SMI of preclinical AD from SMI without pathologic changes or other pathologies un- related with AD might need further studies.
DISCLOSURE
No conflicts of interest, financial or otherwise, are declared by the authors.
AUTHOR CONTRIBUTION
Study design and manuscript preparation: Hong YJ, Yang DW.
Data acquisition and statistical analysis: Yoon B, Shim YS, Ahn KJ. Discussion and manuscript revision: Yang DW, Lee JH.
ORCID
Yun Jeong Hong http://orcid.org/0000-0002-4996-4981 Dong Won Yang http://orcid.org/0000-0002-4733-7298
REFERENCES
1. van Oijen M, de Jong FJ, Hofman A, Koudstaal PJ, Breteler MM. Subjec- tive memory complaints, education, and risk of Alzheimer’s disease. Al- zheimers Dement 2007; 3: 92-7.
2. Scheef L, Spottke A, Daerr M, Joe A, Striepens N, Kölsch H, Popp J, Daa- men M, Gorris D, Heneka MT, et al. Glucose metabolism, gray matter structure, and memory decline in subjective memory impairment. Neu- rology 2012; 79: 1332-9.
3. Mosconi L, De Santi S, Brys M, Tsui WH, Pirraglia E, Glodzik-Sobanska L, Rich KE, Switalski R, Mehta PD, Pratico D, et al. Hypometabolism and altered cerebrospinal fluid markers in normal apolipoprotein E E4 carriers with subjective memory complaints. Biol Psychiatry 2008; 63:
609-18.
4. Selnes P, Fjell AM, Gjerstad L, Bjørnerud A, Wallin A, Due-Tønnessen P, Grambaite R, Stenset V, Fladby T. White matter imaging changes in sub- jective and mild cognitive impairment. Alzheimers Dement 2012; 8: S112- 21.
5. Le Bihan D, Mangin JF, Poupon C, Clark CA, Pappata S, Molko N, Chab- riat H. Diffusion tensor imaging: concepts and applications. J Magn Re- son Imaging 2001; 13: 534-46.
6. Hong YJ, Yoon B, Lim SC, Shim YS, Kim JY, Ahn KJ, Han IW, Yang DW.
Microstructural changes in the hippocampus and posterior cingulate in
mild cognitive impairment and Alzheimer’s disease: a diffusion tensor imaging study. Neurol Sci 2013; 34: 1215-21.
7. Cho H, Yang DW, Shon YM, Kim BS, Kim YI, Choi YB, Lee KS, Shim YS, Yoon B, Kim W, et al. Abnormal integrity of corticocortical tracts in mild cognitive impairment: a diffusion tensor imaging study. J Korean Med Sci 2008; 23: 477-83.
8. Wang Y, West JD, Flashman LA, Wishart HA, Santulli RB, Rabin LA, Pare N, Arfanakis K, Saykin AJ. Selective changes in white matter integrity in MCI and older adults with cognitive complaints. Biochim Biophys Acta 2012; 1822: 423-30.
9. Peter J, Scheef L, Abdulkadir A, Boecker H, Heneka M, Wagner M, Kop- para A, Klöppel S, Jessen F; Alzheimer’s Disease Neuroimaging Initia- tive. Gray matter atrophy pattern in elderly with subjective memory im- pairment. Alzheimers Dement 2014; 10: 99-108.
10. Yesavage JA, Brink TL, Rose TL, Lum O, Huang V, Adey M, Leirer VO.
Development and validation of a geriatric depression screening scale: a preliminary report. J Psychiatr Res 1982; 17: 37-49.
11. Kang Y, Na DL. Seoul neuropsychological screening battery. Incheon:
Human Brain Research & Consulting Co, 2003.
12. Han C, Jo SA, Jo I, Kim E, Park MH, Kang Y. An adaptation of the Kore- an mini-mental state examination (K-MMSE) in elderly Koreans: demo- graphic influence and population-based norms (the AGE study). Arch Gerontol Geriatr 2008; 47: 302-10.
13. Christensen KJ, Moye J, Armson RR, Kern TM. Health screening and random recruitment for cognitive aging research. Psychol Aging 1992; 7:
204-8.
14. Petersen RC, Smith GE, Waring SC, Ivnik RJ, Kokmen E, Tangelos EG.
Aging, memory, and mild cognitive impairment. Int Psychogeriatr 1997;
9 65-9.
15. Bernasconi N, Bernasconi A, Caramanos Z, Antel SB, Andermann F, Arnold DL. Mesial temporal damage in temporal lobe epilepsy: a volu- metric MRI study of the hippocampus, amygdala and parahippocam- pal region. Brain 2003; 126: 462-9.
16. Atmaca M, Ozdemir H, Cetinkaya S, Parmaksiz S, Belli H, Poyraz AK, Tezcan E, Ogur E. Cingulate gyrus volumetry in drug free bipolar patients and patients treated with valproate or valproate and quetiapine. J Psy- chiatr Res 2007; 41: 821-7.
17. Pruessner JC, Li LM, Serles W, Pruessner M, Collins DL, Kabani N, Lu- pien S, Evans AC. Volumetry of hippocampus and amygdala with high- resolution MRI and three-dimensional analysis software: minimizing the discrepancies between laboratories. Cereb Cortex 2000; 10: 433-42.
18. Braak E, Griffing K, Arai K, Bohl J, Bratzke H, Braak H. Neuropathology of Alzheimer’s disease: what is new since A. Alzheimer? Eur Arch Psychi- atry Clin Neurosci 1999; 249 14-22.
19. Papez JW. A proposed mechanism of emotion. 1937. J Neuropsychiatry Clin Neurosci 1995; 7: 103-12.
20. Yoon B, Shim YS, Hong YJ, Koo BB, Kim YD, Lee KO, Yang DW. Com- parison of diffusion tensor imaging and voxel-based morphometry to detect white matter damage in Alzheimer’s disease. J Neurol Sci 2011;
302: 89-95.
21. Zhuang L, Sachdev PS, Trollor JN, Kochan NA, Reppermund S, Brodaty H, Wen W. Microstructural white matter changes in cognitively normal individuals at risk of amnestic MCI. Neurology 2012; 79: 748-54.
22. Stenset V, Bjørnerud A, Fjell AM, Walhovd KB, Hofoss D, Due-Tønnes- sen P, Gjerstad L, Fladby T. Cingulum fiber diffusivity and CSF T-tau in
patients with subjective and mild cognitive impairment. Neurobiol Ag- ing 2011; 32: 581-9.
23. Frisoni GB, Fox NC, Jack CR Jr, Scheltens P, Thompson PM. The clinical use of structural MRI in Alzheimer disease. Nat Rev Neurol 2010; 6: 67-77.
24. Jessen F, Amariglio RE, van Boxtel M, Breteler M, Ceccaldi M, Chételat G,
Dubois B, Dufouil C, Ellis KA, van der Flier WM, et al.; Subjective Cog- nitive Decline Initiative (SCD-I) Working Group. A conceptual frame- work for research on subjective cognitive decline in preclinical Alzheim- er’s disease. Alzheimers Dement 2014; 10: 844-52.