14
©The Korean Society of Food Science and Technology
지방과 단백질 함량에 따른 식품의 과불화화합물 분석을 위한 전처리 방법 확립
방선아·박나연
1·황영림
2·강길진
3·김혜정
3·강영운
3·고영림
1·김정환*
을지대학교 식품산업외식학과, 1을지대학교 보건환경안전학과, 2이화여자대학교 식품공학과,
3식품의약품안전처 식품의약품안전평가원 오염물질과
Development of a pretreatment method for determination of levels of
perfluorinated compounds in foods according to fat and protein contents
Sunah Bang, Na-youn Park1, Youngrim Hwang2, Gil Jin Kang3, Hye-Jeong Kim3, Young-Woon Kang3, Younglim Kho1, and Jung Hoan Kim*
Department of Food Technology & Service, Eulji University
1Department of Health, Environment & Safety, Eulji University 2Department of Food Science and Engineering, Ehwa Womans University
3Food Contaminants Division, National Institute of Food and Drug Safety Evalution, Ministry of Food and Drug Safety
Abstract Perfluorinated compounds (PFCs) have recently been recognized as global environmental pollutants. This study was performed to develop an analytical method for determination of levels of PFCs in food by LC-MS/MS. One hundred and nine food products were divided into two groups based on their fat and protein contents (high and low), following which samples containing high fat and protein contents were pooled and subjected to pretreatment consisting of enzymatic degradation and hexane extraction. The limit of detection of 17 PFCs in the samples were in the range of 0.013-0.145 ng/g. The degrees of precision of detection for group 1 (samples with low fat and protein contents) and group 2 (samples with high fat and protein contents) were 0.8-21.1 and 1.7-28.2%, respectively, with an accuracy of 78.8-109.8% for group 1 and 80-114.5% for group 2. This study indicated that pretreatment of high fat and protein foods with enzymatic degradation and hexane extraction would improve the detection of PFCs in food.
Keywords: perfluorinated compounds, LC-MS/MS, fat content, enzyme treatment
서
론
과불화화합물(perfluorinated compounds, PFCs)은 강한 탄소(C)-불소(F) 결합으로 화학적으로 매우 안정하여 생물학적 분해가 어 렵기 때문에 현재 스톡홀름 협약에서는 잔류성 유기 오염 물질 (persistant organic pollutants, POPs)로 분류하고 있다(1-3). PFCs는 작용기에 따라 PFCAs류(perfluorocarboxylic acids)와 PFASs류(per-fluoroalkyl sulfonates)로 나뉜다(4).
몇몇 연구에서 PFCs가 인간과 동물에 잠재적인 독성이 있다고 보고된 바 있다(5-7). 다른 독성 연구에서는 perfluorooctane sul-fonate (PFOS)와 perfluorooctanoic acid (PFOA)물질의 노출이 발 암성, 발생독성 및 유전자 독성 등 여러 가지 부작용을 일으키는 것과 관련 있으며, 콜레스테롤의 수치 상승으로 심장병이나 심장 마비를 유발하고 간과 콩팥에 축적되는 것으로 알려졌다(8-10). PFCs의 잔류성과 독성, 인체노출이 알려지면서 이에 대한 관심 이 높아졌고 현재 PFOS 및 관련 화합물의 규제가 EU, 캐나다 및 일본에서 실시되고 있다(2). 한국도 환경부에서 PFCs 생산량 및 사용량을 규제하고 있으며, 식품의약품안전처에서는 2014년 PFCs에 대한 인체 노출 안전 기준인 일일섭취한계량(tolerable daily intake, TDI, µg/kg bw/day)을 PFOA는 1.0, PFOS는 0.15로 각각 설정하였다. 또한 사람의 혈액 내 PFOS의 농도가 어류와 같은 해양생물의 소비와 관련이 있고(10) 물을 마시는 것 또한 영향을 미친다고 알려진바 있으며(11), PFCs의 주된 노출경로는 식품인 것으로 보 고되고 있다(12-14). 따라서 PFCs의 인체노출이 식품과 밀접한 관 련이 있는 만큼, 식품 중 PFCs의 농도를 확인하는 것이 매우 중 요하다.
시료 중 PFCs분석을 위해 고체상 추출법(solid phase extraction, SPE)(15-18), 이온쌍 추출법(ion–pairing extraction)(19,20), 액체-액 체 추출법(liquid liquid extraction, LLE)(21) 등 다양한 전처리 방 법을 이용하였으며, 효소를 이용한 전처리 방법도 보고되었다(22,23). 외국의 경우 식품 중 PFCs의 잔류수준에 대한 연구가 활발히 진행되었지만(17,24-27), 국내 식품의 PFCs에 대한 연구는 환경 및 인체노출 연구에 비해 부족한 실정이다. 또한 한국에서 주로 섭취되고 있는 식품의 종류가 외국과 다르며, 주요 소비식품이 외국에 비해 지방함량이 적다는 점에서 차이가 있기 때문에 국 내 유통되고 있는 식품 내 PFCs의 분석을 위한 적합한 전처리 방법을 확립할 필요가 있다. 이에 본 연구에서는 국내 유통 식품 *Corresponding author: Jung Hoan Kim, Department of Food
Tech-nology & Service, Eulji University, Seongnam, Gyeonggi 13135, Korea
Tel: +82-31-740-7218 Fax: +82-31-740-7349 E-mail: [email protected]
Received August 21, 2017; revised November 3, 2017; accepted November 13, 2017
에서 지방과 단백질 함량의 차이로 식품을 구분하여 전처리 방 법을 확립하고 고성능 액체크로마토그래피-질량분석기(LC-MS/ MS)를 이용하여 식품 내 17종의 PFCs를 분석하기 위한 분석법 의 유효성 검증을 실시하였다.
재료 및 방법
대상시료 본 연구에서는 “식품 등의 표시기준”에서 지방 함량에 따른 강 조표시의 내용을 반영하여 균질화한 분석용 시료의 단백질과 지 방함량의 합이 3% 미만인 경우 Group 1, 3% 이상인 경우 Group 2로 분류하였다. 구매한 시료는 증류수와 일정비율(1:1-1:3) 섞어 믹서기로 균질화하였으며 균질화된 시료는 10 g씩 그룹별로 모 아 혼합시료를 만들어 사용하였다. 모든 시료는 분석 전까지 −20 oC 냉동고에 보관하였다. 시약 및 기구 본 실험에 사용된 PFCs 17종의 표준물질 perfluoro-n-pentanoic acid (PFPeA), hexanoic acid (PFHxA), perfluoro-n-heptanoic acid (PFHpA), perfluoro-n-octanoic acid (PFOA), per-fluoro-n-nonanoic acid (PFNA), perfluoro-n-decanoic acid (PFDA), perfluoro-n-undecanoic acid (PFUnDA), perfluoro-n-dodecanoic acid (PFDoDA), n-tridecanoic acid (PFTrDA), perfluoro-n-tetradecanoic acid (PFTeDA), perfluoro-1-butanesulfonate (L-PFBS), perfluoro-1-hexanesulfonate (L-PFHxS), perfluoro-1-octane-sulfonate (L-PFOS), perfluoro-1-decaneperfluoro-1-octane-sulfonate (PFDS), perfluo-rooctanesulphonic acid (PFOSA), N-methylperfluoro-1-sulfonamidoacetic acid (N-EtFOSAA), N-ethylperfluoro-1 octane-sulfonamidoacetic acid (N-MeFOSAA)와 10종의 내부표준물질 per-fluoro-n-[1,2-13C2]hexanoic acid (MPFHxA),perfluoro-n-[1,2,3,4-13C
4]octanoic acid (MPFOA), perfluoro-n-[1,2,3,4,5-13C5]nonanoic
acid (MPFNA), perfluoro-n-[1,2-13C2]decanoic acid (MPFDA), perfluoro-n-[1,2-13C2]undecanoic acid (MPFUnDA), perfluoro-n-[1,2-13C2]dodecanoic acid (MPFDoDA), perfluoro-1-hexane[18O2] sulfonate (MPFHxS), perfluoro-1-[1,2,3,4-13C4]octanesulfonate (MPFOS), N-methyl-d3-perfluoro-1-octanesulfonamidoacetic acid (d3-N-EtFOSAA), N-ethyl-d5-perfluoro-1 octane sulfonamide acetic acid (d5-N-MeFOSAA)는 Wellington Laboratories (Guelph, ON, Can-ada)에서 구입하였다. 또한, 전처리에 사용되는 프로테이스(protease), 라이페이스(lipase), 황산수소테트라뷰틸암모늄(tetra butyl ammonium hydrogen sulfate, TBAHS), 탄산수소소듐(sodium bicarbonate, NaHCO3), 무수탄산소듐(sodium carbonate anhydrous, Na2CO3)은 함량 99%의 Sigma-Aldrich Chemical Co. (St. Louis, MO, USA)에서 구입하여 사용하였으며, 분석용매인 메탄올, 증류수, 아 세토니트릴(acetonitrile), 메틸삼차뷰틸에테르(methyl-t-butyl ether, MTBE), 헥세인(hexane)은 HPLC등급으로 Burdick and Jackson (Muskegon, MI, USA)에서 구입하여 사용하였다.
시료 균질화에는 믹서(BL-1401 KR, Tefal, France)를 사용하였 으며, 효소활성을 위해 진탕배양기(SH-803R, Ilsin, Korea)를 이용 하였다. 물질 추출을 위해 초음파추출기(5510R-DTH, Bransonic, Danbury, CT, USA)와 회전교반기(AG, FINEPCR, Korea)를 사용 하였고 층분리를 위한 원심분리기는 PLC-05 (Gemmy Industrial Corp., Taiwan), 농축을 위해 사용된 농축기는 Eyela (Tokyo,
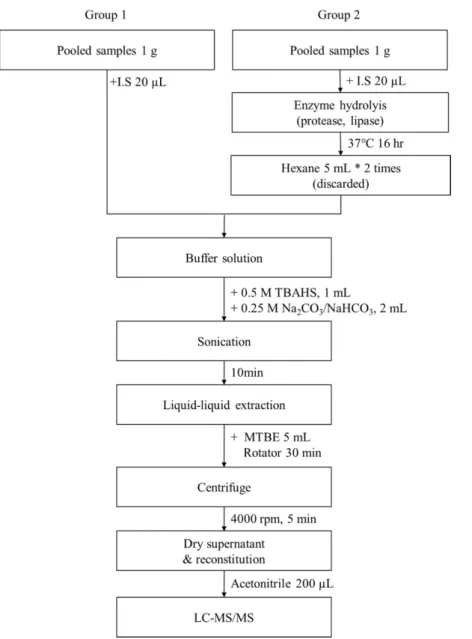
Japan)의 원심농축기(CVE3100)를 사용하였다. 시료의 전처리 방법 Group 1: 채소 및 야채류와 곡류가공품 등 43건을 혼합하여 균 질화한 시료 1 g을 15 mL 튜브에 담고 내부표준물질혼합액 20 µL를 첨가한 후 0.5 M TBAHS 1 mL, 0.25 M Na2CO3/NaHCO3 2 mL을 넣어 10분 동안 초음파 추출하였다. 그리고, 액체상 추출 을 위해 MTBE 5 mL을 넣고 회전교반기에 30분간 반응시켰다. 원심분리기를 이용하여 4,000 rpm에서 5분간 유기용매층을 분리 하고 상층액만 새로운 튜브로 옮겨 담았다. 상층액만 담은 튜브 를 원심농축기에 넣어 농축시키고, 아세토니트릴 200 µL을 넣어 재조성하고 LC-MS/MS에 주입하여 정량 분석하였다. Group 2: 육류 및 생선류와 가공품 등 66건을 혼합하여 균질 화한 시료 1 g을 15 mL 튜브에 담고 내부표준물질혼합액 20 µL 를 첨가한다. 지방 및 단백질에 결합된 PFCs를 가수분해하기 위 해 프로테이스와 라이페이스를 각각 350 µL씩 넣어 잘 섞어준 후, 37oC 진탕배양기에서 16시간 동안 반응시켰다. 이후 지방제 거를 위해 헥세인 5 mL를 넣고 회전교반기에서 10분 동안 지방 을 추출하고 원심분리기에서 4,000 rpm으로 5분간 돌려 층분리 하여 상층액만 버린다. 지방이 제거된 시료에 0.5 M TBAHS 1 mL, 0.25 M Na2CO3/NaHCO3 2 mL을 넣어 10분 동안 초음파 추 출하였다. 그리고, MTBE 5 mL를 넣어 액체상 추출하고 원심분 리를 통해 상층액을 새로운 튜브에 옮겨 담는다. 상층액을 담은 튜브를 진공농축기에 넣어 농축시키고 아세토니트릴 200 µL을 넣어 재조성하여 LC-MS/MS에 주입하여 정량 분석하였다(Fig. 1). LC-MS/MS 분석조건 식품 중 PFCs를 분석하기 위하여 고성능 액체 크로마토그래피 (Agilent 1100 LC series, Agilent Technologies, Palo Alto, CA, USA), 질량분석기(API 4000, Applied Biosystems, Foster City, CA, USA)를 이용하였으며, 컬럼은 YMC-ODS 컬럼(2.0×150 mm, 3.0µm, Waters Co., Milford, MA, USA)을 사용하였다. 이동상 용 매는 5 mM 아세트산 암모늄(0.02% formic acid) 수용액(A)과 100% 메탄올(B)을 경사용매조성법으로 이용하여 200 µL/min의 유속으로 사용하였다. 정량분석은 다중 반응 모니터링(multiple reaction monitoring, MRM)방식으로 음이온모드에서 분석하였다. LC-MS/MS의 분석조건은 Table 1, 연구 대상물질 17종과 10종의 내부표준물질에 대한 전구이온과 생성이온 정보는 Table 2에 나 타내었다. 분석법 검증 전처리 방법 검증을 위해 본 연구에서는 분류된 그룹별로 식 품시료를 일정량 담아 균질화하여 혼합시료를 만들어 사용했으 며, 시료 중 PFCs의 최종농도가 0.2 ng/mL (저농도), 1 ng/mL (중 농도) 및 5 ng/mL (고농도)가 되도록 표준용액을 첨가하고 각 농 도에 대하여 7개씩 시료와 동일한 방법으로 전처리하고 분석하 였다. 정확도(accuracy) 평가는 표준물질에 대한 회수율(recovery) 로 실시하였고 정밀도(precision) 평가는 7개씩 반복 분석한 값의 상대표준편차(RSD) 값으로 실시하였다. 본 연구의 검출한계(LOD) 는 표준용액 7가지 농도(0.01, 0.05, 0.1, 0.5, 1, 2 및 5 ng/mL)의 검량선에서 y 절편의 표준편차를 검량선의 기울기로 나누고 이 결과 값에 3.3을 곱하여 구하였다.
결과 및 고찰
식품 시료 중 PFCs 분석법 검증 본 연구는 식품 중 17종의 PFCs 분석을 위한 전처리법을 확 립하기 위해 실시되었으며, 식품의 단백질과 지방함량에 따라 Group 1과 Group 2로 분류하였고 그룹별로 혼합 시료를 만들어 사용하였다. 혼합 시료는 여러 가지 시료를 하나로 합성하여 분 석함으로써 오류를 최소화 시킬 수 있고 필요한 분석 횟수가 줄 어들기 때문에 분석에 드는 비용을 절감할 수 있다(28). Kärrman 등(23)의 연구에서는 PFCs와 단백질의 효율적인 분해를 위하여 효소를 이용하였기에 본 연구에서도 지방과 단백질의 함량이 높 은 시료인 Group 2의 경우 효소 처리를 실시하였다. Group 1과 Group 2 각각의 방법으로 전처리 후 분석한 17종 의 PFCs의 정확도, 정밀도 및 검출한계는 Table 3과 같다. 분석 Fig. 1. Pretreatment procedure for LC-MS/MS analysis of PFCs.Table 1. LC/ESI-MS/MS conditions for analysis of PFCs
Parameter Condition
HPLC
Column YMC-ODS (2.0×150 mm, 3.0 µm, Waters)
Mobile phase A: 5 mM ammonium acetate with 0.02% formic acid in water, B : Methanol Gradient Time (min) 00 005 013 013.1 025
B (%) 030 100 100 030 0030
Flow rate 200 µL/min Injection volume 3 µL
MS/MS
Ionization mode ESI negative Curtain gas 25 psi Ion source gas 1 40 psi Ion spray voltage (V) -4500 Ion source gas 2 60 psi Collision gas (CAD) 6 eV
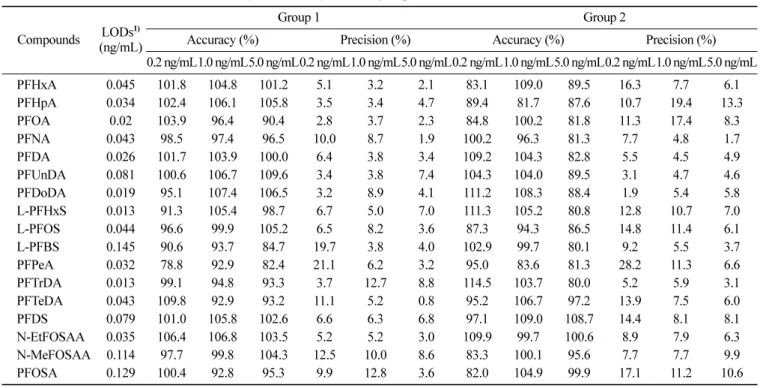
법의 정확도 평가 결과 Group 1은 78.8-109.8%, Group 2는 80.0-114.5% 범위를 보였고 정밀도의 경우 각각 0.8-21.1, 1.7-28.2%의 범위였으며, 검정곡선의 직선성 결정계수(r2)는 모든 물질이 0.999 이상으로 나타나 정량 분석에 충분한 직선성을 보여주었다. 본 연구의 검출한계는 0.013-0.145 ng/mL의 수준이었다. Ropers 등(29)이 PFCs의 친수성과 친유성을 확인하고자 PFOS 와 PFOA의 분포비율을 조사한 결과, PFOS는 수상과 유상에 동 일하게 분포해 있었고, PFOA는 주로 수상에 분포하는 특성을 보 인다고 보고하였다. 이 연구 결과로 비추어볼 때, Group 2의 전 처리 방법 중 헥세인의 처리가 PFOS의 회수율에 영향을 미칠 것 으로 예상되었으나, 본 연구에서 Group 1과 Group 2의 PFOS 회 수율에 대해 독립표본 t-검정을 실시한 결과 두 그룹간 PFOS의 회수율에 차이가 없었다(p>0.05). 따라서 헥세인의 처리가 PFOS 의 회수율에 영향을 미치지 않는 것으로 보인다. 본 연구의 Group 1에 포함된 식품에서 PFCs를 분석한 기존 연 구를 보면, Herzke 등(30)이 벨기에, 체코, 이탈리아 및 노르웨이 4개의 유럽국가에서 대표적인 8가지 채소를 수집하여 MTBE를 이용한 액체상 추출 후 고체상 추출로 정제한 분석법의 방법정 량한계(MQL)는 2-50 ng/kg의 범위였으며, 정확도 72-133%, 정밀 도 2-27%로 본 연구에 비해 검출한계농도가 높았고 정밀도, 정 확도는 낮았다. 본 연구의 Group 2에 포함된 식품에서 PFCs를 분석한 기존 연 구를 보면, Hradkova 등(31)이 체코의 어류와 수산물 가공품에서 3종의 PFCs물질을 메탄올을 이용하여 추출한 분석법은 회수율이 104-116%, 검출한계가 0.05-0.1 µg/kg 범위로 본 연구와 유사한 결과를 보였다. Zhao 등(32)이 중국의 마켓에서 구입한 20개의 어류에서 총 9종의 PFCs 물질을 ion-pairing 후 고체상추출로 정 제하여 HPLC-MS/MS로 분석한 결과, 회수율은 79-114%, 정량한 계(LOQ)가 0.25-1 ng/g의 범위로 본 연구와 비슷한 회수율을 보 였다. Vassiliadou 등(33)은 그리스에서 일반적으로 섭취하는 작은 지중해 물고기와 조개에서 가속 용매 추출기(AES)를 이용한 가 압액체추출법(PLE)으로 전처리 후 LC-MS/MS로 12종의 PFCs 물 질 분석한 결과, 회수율은 60-90%, 검출한계는 0.20-0.94 ng/g 수 준으로 본 연구에 비해 낮은 회수율을 보이며 높은 검출한계를 나타내었다. 본 연구의 Group 1과 2에 해당하는 식품에서 PFCs를 분석한 기존 연구를 보면, 포장된 식품과 다양한 원료 식품 그리고 조리 된 식품에서 10종의 PFCs물질을 액체상추출과 고체상추출하고 Envi-Carb를 이용한 정제를 실시한 뒤 분석한 결과, 회수율이 30-133%, 검출한계는 0.012-0.12 ng/g 범위를 보였다(24). 이는 본 연 구와 검출한계는 비슷하지만 회수율의 범위가 넓게 나타났다. Schecter 등(17)이 텍사스의 슈퍼마켓에서 구입한 31개의 식품을 Table 2. Optimization of MS/MS parameters for the analysis of PFCs
Compounds Q11) Mass (amu) Q32) Mass (amu) DP3) CE4) CXP5)
PFPeA 263.0 218.9 -25 -12 -13 PFHxA 313.0 268.9 / 119.0 -35 -12 / -30 -7 / -5 PFHpA 363.0 318.9 / 168.9 -35 -14 / -24 -7 / -9 PFOA 413.0 368.9 / 168.8 -40 -16 / -26 -9 PFNA 463.0 418.8 / 218.9 -45 -14 / -26 -11 / -13 PFDA 513.0 468.9 / 218.9 -45 -16 / -26 -13 PFUnDA 562.9 518.9 / 268.8 -40 -18 / -26 -13 / -17 PFDoDA 613.0 569.0 / 168.8 -35 -18 / -40 -15 / -9 PFTrDA 663.0 619.1 / 168.9 -40 -16 / -44 -9 PFTeDA 713.1 669.1 / 168.9 -50 -20 / -44 -9 L-PFBS 298.9 79.8 / 99.0 -70 -60 / -42 -3 / -5 L-PFHxS 399.0 79.9 / 98.9 -95 -78 / -54 -5 L-PFOS 499.0 80.1 / 99.0 -105 -92 / -70 -5 PFDS 599.0 79.9 / 98.9 -55 -120 / -92 -15 / -5 N-MeFOSAA 570.0 418.8 / 482.8 -80 -28 / -22 -9 / -15 N-EtFOSAA 584.0 419.0 / 526.2 -60 -30 / -26 -9 / -13 PFOSA 498.0 78.0 / 168.7 -85 -70 / -40 -3 / -9 MPFHxA 314.9 269.9 -25 -12 -5 MPFOA 417.1 371.9 -40 -16 -9 MPFNA 468.0 423.0 -35 -14 -11 MPFDA 514.9 470.0 -35 -16 -11 MPFUnDA 564.8 520.0 -35 -16 -13 MPFDoDA 614.9 570.0 -35 -18 -15 MPFHxS 402.9 103.0 -85 -60 -5 MPFOS 503.0 80.0 / 99.0 -110 -90 / -76 -3 / -5 d3-N-MeFOSAA 573.0 419.1 -70 -30 -41 d5-N-EtFOSAA 588.9 418.9 / 531.1 -75 -32 / -26 -7 / -13 1)Q1=parent ion, m/z 2)Q3=daughter ion, m/z 3)DP=declustering potential (V) 4)CE=collision energy (V)
메탄올 추출 후 고체상추출을 실시하고 LC-MS로 11종의 PFCs 물질을 분석하였다. 그 결과, 검출한계는 0.01-0.5 ng/g 범위였으 며 내부표준물질의 회수율은 65-105%로 본 연구에 비해 낮은 회 수율과 높은 검출한계를 보였다. Ostertag 등(25)은 캐나다인이 일 반적으로 소비하는 65개의 식품을 메탄올로 추출 후 고체상추출 로 정제하여 LC-MS/MS로 9종의 PFCs를 분석한 결과, 회수율은 6-81%, 방법검출한계(MDL)는 0.05-0.97 ng/g으로 낮은 회수율과 높은 검출한계로 나타났다. 본 연구의 결과와 기존에 연구된 논문과 회수율 및 검출한계 를 비교해본 결과, 본 연구 결과가 우수한 회수율과 낮은 범위의 검출한계 값을 보여 본 연구의 저지방 저단백질 식품인 Group 1 의 ion-pairing 전처리 방법과 고지방 고단백질 식품인 Group 2의 효소처리 및 헥세인 처리 후 ion-pairing 전처리 방법이 다른 연 구의 전처리 방법보다 미량분석에 적합하다고 판단된다. 식품 혼합시료 중 PFCs의 함량 혼합된 식품시료를 분석한 결과 Group 1과 Group 2에서 PFBS 는 모두 불검출이었다. 총 17개의 PFCs 중 Group 1의 혼합시료 는 52.9% (n=9)가 검출되었고 Group 2의 혼합시료에서는 94.1% (n=16)가 검출되어 본 연구의 방법으로 많은 종류의 PFCs를 분 석할 수 있음을 확인하였다. 물질별 검출 농도를 보면 Group 1 과 Group 2의 PFOS가 각각 0.68과 1.87 ng/g으로 가장 높게 검 출되었고 대부분의 물질은 검출한계 미만으로 나타나 국내 유통 식품 중 PFCs의 오염 수준은 낮을 것으로 추정되었다. 총 PFCs 농도는 Group 1과 Group 2가 각각 1.14, 6.74 ng/g으로 Group 2 의 농도가 Group 1에 비해 약 6배 높게 검출되었다(Table 4). Schecter 등(17)이 시리얼과 사과, 감자 등 31개의 식품에서 11 종의 PFCs 물질을 분석한 결과 PFOA와 PFBS, PFHxS 3종만 검 출되었는데 PFOA는 31개의 식품 중에서 54.8% (n=17)가 검출되 었고 그 농도 범위는 0.02-1.8 ng/g였으며, 유제품의 경우 버터에 서만 1.07 ng/g로 높게 검출되었다. 시리얼과 사과, 감자에서는 PFCs가 검출되지 않았고 대구에서만 PFBS와 PFHxS가 각각 0.12, 0.07 ng/g 농도로 검출되었다. Hradkova 등(31)이 자주 소비되는 35개의 어류 통조림과 해산 물제품에서 3종의 PFCs를 분석한 결과, 가장 높은 농도로 검출 된 물질은 PFOS이였으며 그 범위가 0.7-12.8 µg/kg였고 정어리 통 조림이 12.8 µg/kg로 가장 높았다. PFOA의 경우 1.2-5.1 µg/kg 범 위로 검출되었고 정어리 통조림 농도가 5.1 µg/kg으로 가장 높게 검출되었다.
Table 3. LODs and assessment result of analysis feasibility (accuracy & precision) of 17 PFCs
Compounds LODs
1)
(ng/mL)
Group 1 Group 2
Accuracy (%) Precision (%) Accuracy (%) Precision (%) 0.2 ng/mL1.0 ng/mL5.0 ng/mL0.2 ng/mL1.0 ng/mL5.0 ng/mL0.2 ng/mL1.0 ng/mL5.0 ng/mL0.2 ng/mL1.0 ng/mL5.0 ng/mL PFHxA 0.045 101.8 104.8 101.2 5.1 3.2 2.1 83.1 109.0 89.5 16.3 7.7 6.1 PFHpA 0.034 102.4 106.1 105.8 3.5 3.4 4.7 89.4 81.7 87.6 10.7 19.4 13.3 PFOA 0.02 103.9 96.4 90.4 2.8 3.7 2.3 84.8 100.2 81.8 11.3 17.4 8.3 PFNA 0.043 98.5 97.4 96.5 10.0 8.7 1.9 100.2 96.3 81.3 7.7 4.8 1.7 PFDA 0.026 101.7 103.9 100.0 6.4 3.8 3.4 109.2 104.3 82.8 5.5 4.5 4.9 PFUnDA 0.081 100.6 106.7 109.6 3.4 3.8 7.4 104.3 104.0 89.5 3.1 4.7 4.6 PFDoDA 0.019 95.1 107.4 106.5 3.2 8.9 4.1 111.2 108.3 88.4 1.9 5.4 5.8 L-PFHxS 0.013 91.3 105.4 98.7 6.7 5.0 7.0 111.3 105.2 80.8 12.8 10.7 7.0 L-PFOS 0.044 96.6 99.9 105.2 6.5 8.2 3.6 87.3 94.3 86.5 14.8 11.4 6.1 L-PFBS 0.145 90.6 93.7 84.7 19.7 3.8 4.0 102.9 99.7 80.1 9.2 5.5 3.7 PFPeA 0.032 78.8 92.9 82.4 21.1 6.2 3.2 95.0 83.6 81.3 28.2 11.3 6.6 PFTrDA 0.013 99.1 94.8 93.3 3.7 12.7 8.8 114.5 103.7 80.0 5.2 5.9 3.1 PFTeDA 0.043 109.8 92.9 93.2 11.1 5.2 0.8 95.2 106.7 97.2 13.9 7.5 6.0 PFDS 0.079 101.0 105.8 102.6 6.6 6.3 6.8 97.1 109.0 108.7 14.4 8.1 8.1 N-EtFOSAA 0.035 106.4 106.8 103.5 5.2 5.2 3.0 109.9 99.7 100.6 8.9 7.9 6.3 N-MeFOSAA 0.114 97.7 99.8 104.3 12.5 10.0 8.6 83.3 100.1 95.6 7.7 7.7 9.9 PFOSA 0.129 100.4 92.8 95.3 9.9 12.8 3.6 82.0 104.9 99.9 17.1 11.2 10.6 1)Limits of detection
Table 4. Concentration of PFCs in composite samples Compounds Group 1 (ng/g) Group 2 (ng/g)
PFHxA 0.09 0.10 PFHpA 0.05 0.13 PFOA ND1) 0.19 PFNA 0.04 0.16 PFDA 0.03 0.24 PFUnDA ND1) 1.15 PFDoDA 0.02 0.29 L-PFHxS 0.15 0.08 L-PFOS 0.68 1.87 L-PFBS ND1) ND1) PFPeA 0.05 0.23 PFTrDA 0.02 0.55 PFTeDA ND1) 0.11 PFDS ND1) 1.05 N-EtFOSAA ND1) 0.10 N-MeFOSAA ND1) 0.15 PFOSA ND1) 0.35 Total 1.14 6.74
He 등(1)이 15개의 어류에서 8종의 PFCs를 분석한 결과 모든 물질이 검출되었다. 어류에서 검출된 총 PFCs의 농도는 2.01-43.8 ng/g의 범위로 나타났고 평균농도는 13.50 ng/g으로 본 연구의 Group 2검출농도인 6.74 ng/g에 비해 높은 농도를 보였다. 분석 된 물질들의 평균 농도는 0.22-5.03 ng/g의 범위로 나타났고 가장 높은 농도로 검출된 물질은 PFOS로 평균 5.03 ng/g이었다. 국외의 식품 내 PFCs 모니터링의 연구결과를 검토해보았을 때, 대부분이 채소류에 비해 어류와 그 가공품에서 PFCs의 농도가 높게 검출되었고 그 중에서도 PFOS의 농도가 높게 나온 것으로 나타났다. 이러한 결과를 통해 본 연구의 Group 2 혼합시료의 PFCs농도가 Group 1 혼합시료에 비해 높게 검출된 것은 어류와 그 가공품이 포함되어있기 때문에 나타난 결과로 사료된다. 그러나 본 연구는 여러가지 식품시료를 혼합하여 분석한 결과 로, 각각의 식품 중 농도는 알 수 없어 Schecter 등(17), Hradkova 등(31)과 He 등(1)이 분석한 식품시료 중 PFCs의 농도를 본 연 구와 비교하는 데는 한계가 있다.
요
약
본 연구는 국내 유통되는 다양한 식품을 효율적인 방법으로 전 처리하고 LC-MS/MS를 이용해 식품 내 PFCs의 분석법을 확립할 목적으로 실시되었다. 109건의 식품을 지방과 단백질의 함량에 따라 두 그룹으로 나누고, 각각의 시료를 분취하여 혼합한 시료 를 사용하였다. 지방과 단백질의 함량이 높은 혼합시료는 효소처 리와 헥세인 추출을 한 후 ion-pairing방법으로 전처리 후 분석을 실시하였으며, 17 종의 PFCs에 대한 검출한계 값은 0.013-0.145 ng/mL 였고, 두 그룹의 정확도와 정밀도는 각각 Group 1이 78.8-109.8, 0.8-21.1%, Group 2가 80-114.5, 1.7-28.2% 범위를 보여 안 정적인 회수율과 정밀도를 보였다. 본 결과로 볼 때 고지방, 고 단백질 식품 중 PFCs의 검출에는 효소처리 및 헥세인 처리가 효 과적이었으며, 식품 중 지방과 단백질 함량에 따라 전처리 방법 을 결정하는 것이 분석의 정확성을 높일 수 있을 것으로 사료된 다. 또한 본 연구결과를 통해 추후 국내 유통되는 다양한 식품 내 PFCs의 분석을 위한 전처리 방법으로 적용 가능할 것으로 사 료된다.감사의 글
본 연구는 2015년 식품의약품안전평가원의 연구개발비(과제번 호 15162 불량식 077)로 수행되었으며, 이에 감사드립니다.References
1. He XM, Dai K, Li A, Chen H. Occurrence and assessment of perfluorinated compounds in fish from the Danjiangkou reservoir and Hanjiang river in China. Food Chem. 174: 180-187 (2015) 2. Barbarossa A, Gazzotti T, Farabegoli F, Mancini FR, Zironi E,
Badiani A, Pagliuca G. Comparison of perfluoroalkyl substances contamination in farmed and wild-caught European sea bass (Dicentrarchus labrax). Food Control. 63: 224-229 (2016)
3. Jogsten IE, Nadal M, van Bavel B, Lindstrm G, Domingo JL. Per-and polyfluorinated compounds (PFCs) in house dust and indoor air in Catalonia, Spain: Implications for human exposure. Environ. Int. 39: 172-180 (2012)
4. Wille K, Bussche JV, Noppe H, De Wulf E, Van Caeter P, Jans-sen CR, Vanhaecke L. A validated analytical method for the determination of perfluorinated compounds in surface-, sea-and sewagewater using liquid chromatography coupled to
time-of-flight mass spectrometry. J. Chromatogr. A. 1217: 6616-6622 (2010)
5. Suja F, Pramanik BK, Zain SM. Contamination, bioaccumulation and toxic effects of perfluorinated chemicals (PFCs) in the water environment: a review paper. Water Sci. Technol. 60: 1533-1544 (2009)
6. Lau C, Thibodeaux JR, Hanson RG, Narotsky MG, Rogers JM, Lindstrom AB, Strynar MJ. Effects of perfluorooctanoic acid exposure during pregnancy in the mouse. Toxicol. Sci. 90: 510-518 (2006)
7. Kennedy GL, Butenhoff JL, Olsen GW, O'Connor JC, Seacat AM, Perkins RG, Farrar DG. The toxicology of perfluorooc-tanoate. Crit. Rev. Toxicol. 34: 351-384 (2004)
8. Paiano V, Fattore E, Carra A, Generoso C, Fanelli R, Bagnati R. Liquid chromatography-tandem mass spectrometry analysis of perfluorooctane sulfonate and perfluorooctanoic acid in fish fillet samples. J. Anal. Methods Chem. 2012: 719010 (2012)
9. Lau C, Anitole K, Hodes C, Lai D, Pfahles-Hutchens A, Seed J. Perfluoroalkyl acids: A review of monitoring and toxicological findings. Toxicol. Sci. 99: 366-394 (2007)
10. Weihe P, Kato K, Calafat AM, Nielsen F, Wanigatunga AA, Needham LL, Grandjean P. Serum concentrations of polyfluoro-alkyl compounds in Faroese whale meat consumers. Environ. Sci. Technol. 42: 6291-6295 (2008)
11. Quinete N, Wu Q, Zhang T, Yun SH, Moreira I, Kannan K. Spe-cific profiles of perfluorinated compounds in surface and drinking waters and accumulation in mussels, fish, and dolphins from southeastern Brazil. Chemosphere 77: 863-869 (2009)
12. Haug LS, Salihovic S, Jogsten IE, Thomsen C, van Bavel B, Lindstrm G, Becher G. Levels in food and beverages and daily intake of perfluorinated compounds in Norway. Chemosphere 80: 1137-1143 (2010)
13. Tittlemier SA, Pepper K, Seymour C, Moisey J, Bronson R, Cao XL, Dabeka RW. Dietary exposure of Canadians to perfluorinated carboxylates and perfluorooctane sulfonate via consumption of meat, fish, fast foods, and food items prepared in their packaging. J. Agr. Food Chem. 55: 3203-3210 (2007)
14. Kadar H, Veyrand B, Antignac JP, Durand S, Monteau F, Le Bizec B. Comparative study of low-versus high-resolution liquid chromatography-mass spectrometric strategies for measuring per-fluorinated contaminants in fish. Food Addit. Contam. A. 28: 1261-1273 (2011)
15. Saito N, Harada K, Inoue K, Sasaki K, Yoshinaga T, Koizumi A. Perfluorooctanoate and perfluorooctane sulfonate concentrations in surface water in Japan. J. Occup. Health. 46: 49-59 (2004) 16. Naile JE, Khim JS, Wang T, Chen C, Luo W, Kwon BO, Giesy
JP. Perfluorinated compounds in water, sediment, soil and biota from estuarine and coastal areas of Korea. Environ. Pollut. 158: 1237-1244 (2010)
17. Schecter A, Colacino J, Haffner D, Patel K, Opel M, Ppke O, Birnbaum L. Perfluorinated compounds, polychlorinated biphe-nyls, and organochlorine pesticide contamination in composite food samples from Dallas, Texas, USA. Environ. Health Persp. 118: 796-802 (2010)
18. Liu J, Li J, Zhao Y, Wang Y, Zhang L, Wu Y. The occurrence of perfluorinated alkyl compounds in human milk from different regions of China. Environ. Int. 36: 433-438 (2010)
19. Yamaguchi M, Arisawa K, Uemura H, Katsuura-Kamano S, Takami H, Sawachika F, Hasegawa M. Consumption of seafood, serum liver enzymes, and blood levels of PFOS and PFOA in the Japanese population. J. Occup. Health. 55: 184-194 (2013) 20. Kannan K, Choi JW, Iseki N, Senthilkumar K, Kim DH,
Masu-naga S, Giesy JP. Concentrations of perfluorinated acids in livers of birds from Japan and Korea. Chemosphere 49: 225-231 (2002) 21. Maestri L, Negri S, Ferrari M, Ghittori S, Fabris F, Danesino P,
Imbriani M. Determination of perfluorooctanoic acid and perfluo-rooctanesulfonate in human tissues by liquid chromatography/sin-gle quadrupole mass spectrometry. Rapid Commun. Mass Sp. 20: 2728-2734 (2006)
22. Raab U, Albrecht M, Preiss U, Vlkel W, Schwegler U, Fromme H. Organochlorine compounds, nitro musks and perfluorinated substances in breast milk-Results from Bavarian Monitoring of
Breast Milk 2007/8. Chemosphere 93: 461-467 (2013)
23. Kärrman A, Lindström G. Trends, analytical methods and preci-sion in the determination of perfluoroalkyl acids in human milk. TRAC-Trend. Anal. Chem. 46: 118-128 (2013)
24. Ericson-Jogsten I, Perell G, Llebaria X, Bigas E, Mart-Cid R, Krrman A, Domingo JL. Exposure to perfluorinated compounds in Catalonia, Spain, through consumption of various raw and cooked foodstuffs, including packaged food. Food Chem. Toxicol. 47: 1577-1583 (2009)
25. Ostertag SK, Chan HM, Moisey J, Dabeka R, Tittlemier SA. His-toric dietary exposure to perfluorooctane sulfonate, perfluorinated carboxylates, and fluorotelomer unsaturated carboxylates from the consumption of store-bought and restaurant foods for the Cana-dian population. J. Agr. Food Chem. 57: 8534-8544 (2009) 26. Clarke DB, Bailey VA, Routledge A, Lloyd AS, Hird S,
Mor-timer DN, Gem M. Dietary intake estimate for perfluorooctane-sulphonic acid (PFOS) and other perfluorocompounds (PFCs) in UK retail foods following determination using standard addition LCMS/MS. Food Addit. Contam. 27: 530-545 (2010)
27. Ballesteros-Gómez A, Rubio S, van Leeuwe, S. Tetrahydrofuran-water extraction, in-line clean-up and selective liquid chromatog-raphy/tandem mass spectrometry for the quantitation of perfluori-nated compounds in food at the low picogram per gram level. J. Chromatogr. A. 1217: 5913-5921 (2010)
28. Johnson GD, Patil G.P. Cost analysis of composite sampling for classification. Environ. Ecol. Stat. 8: 91-107 (2001).
29. Ropers MH, Durand S, Veyrand B, Beaumal V, Marchand P, Anton M, Le Bizec B. Contamination of food by fluorinated sur-factants-Distribution in emulsions and impact on the interfacial protein behaviour. Food Hydrocolloid. 23: 1149-1155 (2009) 30. Herzke D, Huber S, Bervoets L, D’Hollander W, Hajslova J,
Pulkrabova J, de Voogt P. Perfluorinated alkylated substances in vegetables collected in four European countries; occurrence and human exposure estimations. Environ. Sci. Pollut. R. 20: 7930-7939 (2013)
31. Hradkova P, Poustka J, Hlouskova V, Pulkrabova J, Tomaniova M, Hajslova J. Perfluorinated compounds: Occurrence of emerg-ing food contaminants in canned fish and seafood products. Czech J. Food Sci, 28: 333-342 (2010)
32. Zhao YG, Wan HT, Law AY, Wei X, Huang YQ, Giesy JP, Wong CK. Risk assessment for human consumption of perfluorinated compound-contaminated freshwater and marine fish from Hong Kong and Xiamen. Chemosphere 85: 277-283 (2011)
33. Vassiliadou I, Costopoulou D, Kalogeropoulos N, Karavoltsos S, Sakellari A, Zafeiraki E, Leondiadis L. Levels of perfluorinated compounds in raw and cooked Mediterranean finfish and shell-fish. Chemosphere 127: 117-126 (2015)