Plant Community and Species Distribution in Both Slopes of the Mt. Neungdong
Man Kyu Huh*
Department of Molecular Biology, Dongeui University 995 Eomgwangno, Busanjin-gu, Busan 614-714, Korea
Received January 7, 2009 /Accepted June 15, 2009The purpose of the present investigation was to investigate diversity patterns in Mt. Neungdong for- ested landscape. It was conducted on twelve sloping plots (100×100 m) in the east and west sides of Mt. Neungdong. A total of 2,157 specimins were identified as trees with a diameter at breast height (DBH) ≥10 cm. There were a total of 135 species of 35 families present in both regions of Mt.
Neungdong. Least significant differences (LSD) by post hoc analysis revealed that region A had sig- nificantly greater densities than region B. Shannon-Wiener functions differed significantly between for- ests (F=4.12, p<0.05), with region B forest having a significantly higher value (2.118) than region A (1.882). Pinus thunbergii and Quercus aliena were dominant on most plots of both regions, however, the P. densiflora forest of region A was distributed better in the middle plots exposures compared to the opposite ones. Q. aliena, Q. mongolica, and Carpinus laxiflora largely occupied the middle and lower exposures of region B. The spatial distribution in Neungdong's forest was very heterogeneous and re- flected by most species as having micro-climate and patchy distributions.
Key words : Mt. Neungdong, least significant differences, Shannon-Wiener functions
*Corresponding author
*Tel:+82-51-890-1529, Fax:+82-51-890-1521
*E-mail : [email protected], [email protected]
Introduction
The correlation between vegetation and environmental parameters is one of the most fundamental questions con- tributing to understanding plant species composition and structure in a particular habitat, landscape and region [3,8].
Although plant communities are dynamics entities under- going continuous change in response to climate, land use patterns and intrinsic dynamics within the communities, ba- sic inventories provide a baseline against which changes can be determined [15].
Recently, the new road which is situated between Ulju-gun and Miryang-shi has been opened instead of old No. 24 National Road. In addition, the Mt. Neungdong is pierced by a tunnel. Understanding vegetation and environ- mental correlations at one point in time may be help to pre- dict possible shifts attributed to climate and land use changes. In addition, urban growth is gradually going on adjacent to Seongnamsa (temple) and Ice Valley forest in Miryang-shi. Urbanization adjacent to natural regions and parks often results in simplification of habitats and a com- munity of plant, which lead to fewer species dominated by habitat patch size to species richness, increasement of immi- gration and extinction rates, and have been applied to hab-
itat patch dynamics in fragmented urban areas [10,11].
Forest losses across in Korea have led to declines in native plant species diversity and loss of habitat for numerous species.
The destruction and fragmentation of habitat results in the conservation of relatively continuous ecosystems, such as forests, into archipelago of natural habitat surrounded by a 'sea' of urban development [5].
The purpose of the present investigation was to inves- tigate diversity patterns in Mt. Neungdong forested landscape. It was conducted on sloping twelve plots (100×100 m) that was representative of the two separated forests, where the canopy has well developed. What is the nature of floristic diversity and species richness patterns generally, and what are the effects of habitat fragmentation?
The study was conducted to examine the relationship be- tween floristic diversity patterns and plant life forms.
Materials and Methods
The Mt. Neungdong is located in the eastern of Miryang-shi and the western of Ulju-gun, Korea (35
o38'26”
N~35
o38'27”N, 129
o04'48”E~129
o04'48”E) (Fig. 1). The
mountain has a diversity of vegetation, most dominated by
pine and oak trees. The mountain is situated on the south
of the Mt. Gaji which has ca. 106.07 km². The topography
is gently sloping in the lower and middle altitudes, and
Fig. 1. Location of the regions at Mt. Neungdong and twelve sites used in this study. Region A: UU, UM, and UL mean upper, middle, and lower sites in the direction of Ulsan-shi, respectively. Region B: MU, MM, and ML mean upper, middle, and lower sites in the direction of Miryang-shi, respectively.
rather steep at higher altitude. The region B including the Hobakso on southeast Neungdong is a typically developed and truly old-growth evergreen broad-leaved forest.
These twelve sites had been selected to represent a valley slope geomorphic classification with similar elevation.
Within each forest region, six placed 100×100 m plots were set up on the plot with the most developed canopy and were completely censured for all trees with a diameter at breast height (DBH) ≥10 cm.
Analysis of variance and least significant differences post hoc tests were used with SYSTAT 9 to compare results be- tween forest areas [9,16].
The Shannon-Weiner index of diversity was used to char- acterize species richness and abundance[3,14]. It was calcu- lated as:
H'=-s
Σ (
pi
)(lnpi
) i=1Where s is the total number of species and pi is the pro- portion of all individuals in a sample that belong to the ith species.
Species diversity may be thought as being composed of two components. The first is the number of species in the community, which ecologists often refer to as species richness. The second component is species evenness or equitability. Two well-known richness indices are as follows:
R1 and R2 indices [7].
R1= s-1 In(
n
)R2= s
√
n
s: the total number of species in a community, n: the total number of individuals observed.
The common evenness indices used by ecologists are E1-E5 [2].
Jaccard's coefficient (J) of similarity for twelve 100 × 100 m plots was used to compare the number of species shared between plots in different shared regions.
J = number of shared species between plot A and plot B / number of species in plot A + number of species in plot B.
Environmental species and environmental plot relation- ships were investigated by detrended canonical corre- spondence analysis using CANOCO, version 4.0, based on normal data [12].
Results
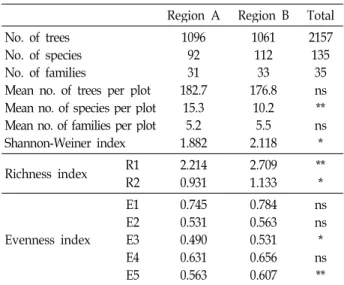
Overall across the regions, total 2157 trees were identified and measured in the 100×100 m plots (Table 1). These were a total of 135 species and 35 families present in the two regions. Mean number of species per plot differed sig- nificantly between the two regions (F=6.22, p<0.01). Post hoc LSD tests showed that region A had a significantly greater mean number of species per region than region B. Mean number of families per region varied between 31 (region A) and 33 (region B), giving a total of 33 over all plots. Average density (tree per plot) differed significantly between regions (F=5.46, p<0.001). Least significant differences (LSD) post
Table 1. Richness and abundance parameters for 12 plots (100×
100 m) in two forest regions
Region A Region B Total No. of trees
No. of species No. of families
Mean no. of trees per plot Mean no. of species per plot Mean no. of families per plot Shannon-Weiner index
109692 182.731 15.35.2 1.882
1061112 176.833 10.25.5 2.118
2157135 35ns ns**
* Richness index R1
R2 2.214
0.931 2.709
1.133 **
*
Evenness index E1 E2E3 E4 E5
0.745 0.531 0.490 0.631 0.563
0.784 0.563 0.531 0.656 0.607
ns ns* ns
**
* and **: Significant at the 0.05 and 0.01 levels, respectively.
ns: Nonsignificant.
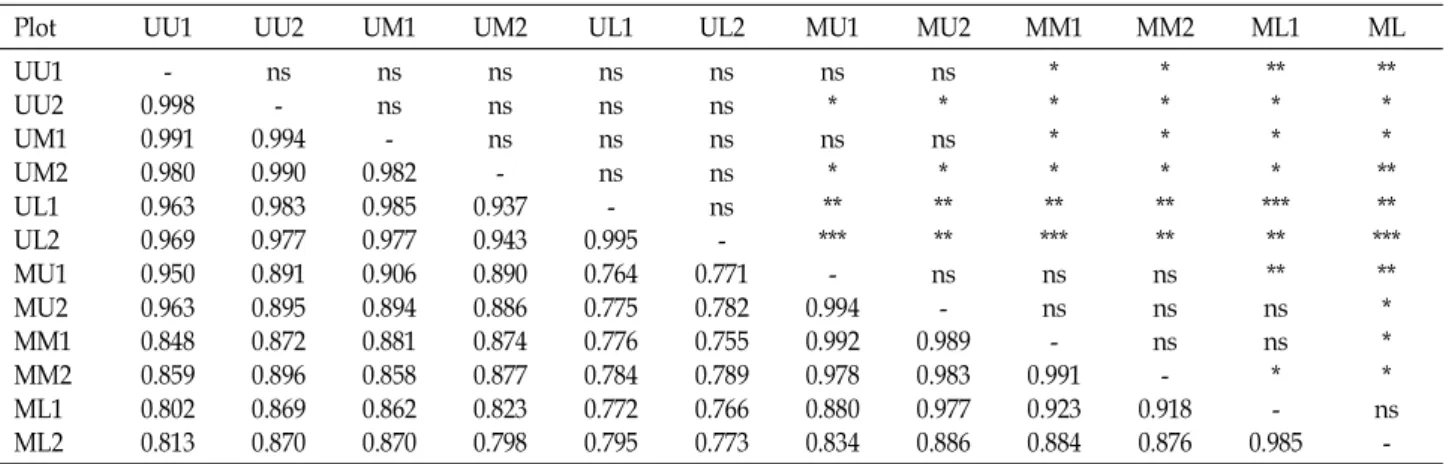
Table 3. Jaccard's coefficient of similarity (below diagonal) and t-tests (above diagonal) among 12 forest plots
Plot UU1 UU2 UM1 UM2 UL1 UL2 MU1 MU2 MM1 MM2 ML1 ML
UU1UU2 UM1UM2 UL1UL2 MU1MU2 MM1MM2 ML1ML2
0.998- 0.991 0.980 0.963 0.969 0.950 0.963 0.848 0.859 0.802 0.813
ns- 0.994 0.990 0.983 0.977 0.891 0.895 0.872 0.896 0.869 0.870
nsns 0.982- 0.985 0.977 0.906 0.894 0.881 0.858 0.862 0.870
nsns ns- 0.937 0.943 0.890 0.886 0.874 0.877 0.823 0.798
nsns nsns 0.995- 0.764 0.775 0.776 0.784 0.772 0.795
nsns nsns ns- 0.771 0.782 0.755 0.789 0.766 0.773
ns* ns*
*****
0.994- 0.992 0.978 0.880 0.834
ns* ns*
****
ns- 0.989 0.983 0.977 0.886
**
**
*****
nsns 0.991- 0.923 0.884
**
**
****
nsns ns- 0.918 0.876
***
**
*****
ns**
ns* 0.985-
***
***
*****
***
** ns-
Asterisks and ns are the same as Table 1. ***: Significant at the 0.001 level.
hoc analysis revealed that regions A had significantly greater densities than region B. Shannon-Wiener functions differed significantly between forests (F=4.12, p<0.05), with region B forest having significantly higher value (2.118) than region A (1.822). The richness indices R1 and R2 decrease from re- gion B to region A. Although the all evenness indices of region A was than those of region B, there did not show a significant differences.
A total of 17 species occurred at an abundance of 20 trees per plot or greater in at least one region, and ten spe- cies at an abundance of 40 trees per plot or greater, and two species at an abundance of 60 trees per plot or greater (Table 2).
Table 2. Major tree species exceeding 20 (+), 40 (++) and 60 (+++) individuals per plot in two forest regions
Species (Family) Region
A Region B
Pinus densiflora
Sieb. & Zucc. (Pinaceae)Pinus thunbergii
Parlatore (Pinaceae)Quercus aliena
Blume (Fagaceae)Quercus mongolica
Fischer (Fagaceae)Quercus dentata
Thunb. (Fagaceae)Quercus variabilis
BL. (Fagaceae)Quercus acutissima
Carruth. (Fagaceae)Carpinus laxiflora
BL. (Betulaceae)Carpinus cordata
Bl. (Betulaceae)Sorbus commixta
Hedl. (Rosaceae)Prunus sargentii
Rehder (Rosaceae)Prunus yedoensis
Matsumura (Rosaceae)Cornus controversa
Hemsl. (Coraceae)Cornus walteri
Wanger (Coraceae)Robinia pseudo-acacia
L. (Leguminosae)Chionanthus retusa
Lindl. et Paxton (Oleaceae)Fraxinus rhynchophylla
Hance (Oleaceae)+++
++++ ++ + ++ ++ ++ + ++
+ ++
+++++
+++++
++
++++
+++ ++ ++
+ ++
Mean Jaccard's coefficient of similarity between regions pairs was compared by the two-sample t-test (Table 3). The Jaccard's coefficient showed two distinct groups, although UU1 and UU2 of region A and four middle and lower plots of region B were not well separated from each other.
Species abundance patterns in the two Neungdong re- gions mirror the right tail of a lognominal distribution, both for tree in the 100 × 100 m plots (Fig. 2). More than two-thirds of tree species and understory species of the two regions (A and B) are found in the first three abundance classes of the log-distribution (<20 years), while fewer than 6% were found in each of the final 12~15 abundance class.
The distribution for all forests dramatically dropped off to a long right tail. However, 33% of the region B including the Hobakso Reserve is found in the final class of the log-distribution.
Two species were typical on almost all plots; Pinus thun- bergii and Quercus aliena, thus they were the dominant hab- itat type on most plots. The most common species in the region A forest were P. densiflora, according for 35.4% of the individuals sampled in 100×100 m plots. The P. densiflora forest of region A is distributed better in the middle plots exposures compared with the opposite ones. Q. aliena, Q.
mongolica, and Carpinus laxiflora largely occupied the middle and lower exposures of region B.
Restricting analysis gradually to higher dominant species, the dependency of species variance on environmental fac- tors was still variances a little more (Fig. 2). When this study restricted the species to more than 5% in dominance (10 spe- cies), the first axis explained 12.8% of the species variation.
P. thunbergii was dominant on most plots and they corre-
lated with a combination of substrate variables, essentially
(A) (B)
Fig. 2. Detrended canonical correspondence analysis coordination diagram showing understory species scores (○) and plot scores (●) by basal regions A (A) and B (B).
presenting level temperature and slopes, while Q. aliena, Q.
mongolica, and C. laxiflora appeared to be linked to commun- ities in lower altitude on moderate slopes.
Discussion
Environmental heterogeneity has an important influence on the development of plant community. Numerous re- searches have proposed a positive correlation between envi- ronmental variability and species richness [4]. The dis- tribution of plant communities in the Mt. Neungdong re- flects the combined influence of altitude, topology and mi- cro-temperature, a patterns observed in many mountain areas [13]. In a broader context these patterns can be consid- ered a combination of factors operating at different scales.
Regional parameters such as climatic and associated floristic regions provide the species matrix for a particular area [6].
Landscape parameters, for example altitude sorting vegeta- tion composition along with a local climatic gradient, further redefine vegetation patterns. Microhabitats and tiny Föhn wind conditions provide the final separation into local plant communities. Föhn wind is a type of dry down slope wind which occurs in the lee of a mountain range (region A).
Region A shows a warmer climate due to the Föhn and re- gion B. Thus, cold region B and circumferences are suitable candidates for apple cultivation and famous for “Eoreumgol- apple”.
In this study, tree density and soil pH per plot were not related directly to estimates of recruitment for several tree species. However, smaller habitat that is consisted of a great-
er proportion of edge habitat that is unsuitable for out- crossing mating system species than inbreeding species and high density in a area [1]. Accurately determining the dis- tance into forests that is unsuitable for all species is not yet possible and would require better projections for pop- ulations using measures of mortality and survivorship over multiple years. Still, these is a marked reduction in recruit- ment at site near edges. For example, although fragments are usually not square-shaped, two 100×100 m plots for each plot is more diversity than four 100×100 m plots for each region.
A total of 68 tree species occurred at an abundance of fifteen in at least one fragments (Table 1). Among understory species, 33 species were found at abundance of 87 in- dividuals or more (data not shown).
Considering just the most common species, the commun- ity comparison of the fragments is strikingly different (Fig.
2). The region A is primarily a P. thunbergii - Q. aliena forest, whereas the region B is all dominant by Q. aliena - C. laxiflora.
The spatial distribution in southern Neungdong's littoral forest in very heterogeneous, reflected by most species hav- ing low densities and patchy distributions. In addition there were significant differences between the two forest regions in this study in terms of Shannon-Weiner index of diversity, number of trees, species richness, family richness, species evenness and species composition.
References
1. Aizen, M. A. and P. Feinsinger. 1994. Forest fragmentation,
pollination, and plant reproduction in Chago dry forest.
Argentina.
Ecology
75, 330-351.2. Alataro, R. V., A. Lundberg, and K. Stahlbrandt. 1982. Why do pied fly catcher females mate with already-mated males?
Anim. Behav.
30, 585-593.3. Barbour, M. G., J. H. Burk, W. D. Pitts, F. S. Gilliam, and M. W. Schwartz. 1999. Terrestial Plant Ecology.
Benjamin/Cummings, Don Mills, Ontario.
4. Campbell, B. D. and J. P. Grime. 1989. A comparative study of plant responsiveness to the duration of episodes of min- eral nutrient enrichment.
New Phytol.
112, 261-267.5. Harada, K. 2003. Attitude of local people towards con- servation and Gunung Halimun National Park in West Java, Indonesia.
J. For. Res.
8, 271-282.6. Hobbs, R. J. and V. A. Cramer. 2003. Natural ecosystem:
Pattern and process in relation to local and landscape diver- sity in southwestern Australian woodlands.
Plant and Soil
257, 371-378.7. Margalef, R. 1958. Information theory in ecology.
Gen. Syst
. 3, 36-71.8. Mucina, L. 1997. Classification of vegetation: Past, present and future.
J. Veg. Sci.
8, 751-760.9. Slius, W. J. 2002. Patterns of species richness and composi- tion in recreated grassland.
Rest. Ecol.
10, 677-684.10. Soulé, M. E., D. T. Bolger, and A. C. Alberts. 1988.
Reconstructed dynamics of urban habitat islands.
Conser.
Biol.
2, 75-91.11. Tilghman, N. G. 1987. Characteristics of urban woodlands affecting breeding bird diversity and abundance.
Land. &
Urban Plan.
14, 481-495.12. ter Braak C. J. and P. Smilauer. 1998. Software for Vanonical Community Ordination (Ver. 4). Microcomputer Power:
Ithaca, NY.
13. Toth, L. A. 2005. Plant community structure and temporal variability in a channelized subtropical flood plain.
Southeastern Natl.
4, 393-408.14. Weaver, M. and M. Kellman. 1981. The effects of forest frag- mentation on woodland tree biotas in Southern Ontario.
J.
Biogeography
8, 199-210.15. Young, T. P. 2000. Restoration ecology and conservation biology.
Biol. Conser.
92, 73-83.16. Zar, J. H. 1984.
Biostatistical Analysis.
2nd eds., Prentice-Hall.Englewood Cliffs, NJ.