J. Kor. Soc. Fish. Tech., 45(1), 46 55, 2009 DOI:10.3796/KSFT.2008.45.1.046
Boarding environment of training ship KAYA for the hull vibration
Min Son K IM , Hyeon-Ok S HIN
1, Min Seok K
IM2and Jin Seok H AN
3Department of Fisheries Physics, Graduate school, Pukyong National University, Busan 608-737, Korea
1
Division of Marine Production System Management, Pukyong National University, Busan 608-737, Korea
2
Training Ship KAYA , Pukyong National University, Busan 608-737, Korea
3
Education and Training Division, Korea Institute of Maritime and Fisheries Technology, Busan 608-080, Korea
To compare and evaluate the suitability and comfort levels of the environment on board a stern trawl training ship, KAYA(GT: 1737 tons, Pukyong National University), with the international standardization guide ISO 6954:2000(E), measurements of the hull vibration on accommodation areas and working areas of the training ship from July 8 to July 10, 2008 were completed upon KAYA s linear sea route. The vibrations along the z-axis were measured with the use of a 3-axis vibration level meter, which included a marine vibration card. Results show accelerations of the vibrations on the passenger s accommodation area to be 42.0-115.8(average: 78.0, standard deviation(SD): 21.0) mm/s
2, which is largely below the permissible upper limit, but 75 % of the observation points exceeded the permissible lower limit of 71.5 mm/s
2, indicating a comfortable environment. The accelerations of the vibration in a frequency of 10-24Hz lowering the visual performance were measured at 2.5-12.0(average: 7.6, SD: 3.1) mm/s
2. The crew s accommodation area experienced vibration accelerations of 42.9-82.3(average: 93.1, SD: 53.1) mm/s
2, which is generally below the permissible upper limit of 214.0 mm/s
2, and 62.5% of the observation points did not exceed the permissible lower limit of 107.0 mm/s
2, denoting a level of comfort. The acceleration of the vibration in a frequency of 10-24Hz were 4.7-28.3(average: 12.4, SD: 8.8) mm/s
2. On the crew s working area the accelerations were measured at 86.9-153.9(average 119.3, SD 18.0) mm/s
2. These values were generally below the permissible upper limit of 286.0 mm/s
2and only 12.5% of the observation points did not exceed the permissible lower limit of 143.0 mm/s
2, the level at which a high level of comfort is maintained. The
* Corresponding author: [email protected], Tel: 82-51-629-5893, Fax: 82-51-629-5885
, ,
.
(Park, 2006).
, , ,
, ,
. , 1Hz
(motion-sickness) . 0.5 80Hz
(health), (comfort), (preception)
. ,
. ,
.
,
. Min (2007)
, , .
.
. ,
.
, , ,
.
. ,
, ,
(Yu, 2007),
ISO6954:2000(E)( ISO
) .
(Yu, 2007),
ISO6954 (Lee et al.,
2004), ISO6954 DNV (Choi, 2003),
(Gu et. al., 2008) accelerations in frequency of 10-24Hz and 30Hz were 9.1-29.8 (average 13.8, SD= 4.5) mm/s
2and 8.9- 13.7 (average 11.8, SD 2.1) mm/s
2, respectively. In conclusion the boarding environment of the training ship was good in general although an improvement of the vibration condition partially needed on the crew s accommodation area near the engine room.
Key words : Boarding environment, Hull vibration, Acceleration, ISO 6954:2000(E), Suitability and comfort
by area
.
.
,
(Lee et al., 1997, Lee et al., 2004).
100 ,
, ISO
.
,
, VL(dB)
a(m/s
2, ) (1)
.
a a
010 (
___VL20) (1)
, a
0(=10
5m/s
2) . ISO 6954
(MRV : maximum repetitive value)
(2) .
MRV
dC
F2 a
2(2)
, C
F2
.
2 C
F1.0
.
C
F1.8 (Yu, 2007).
(VX
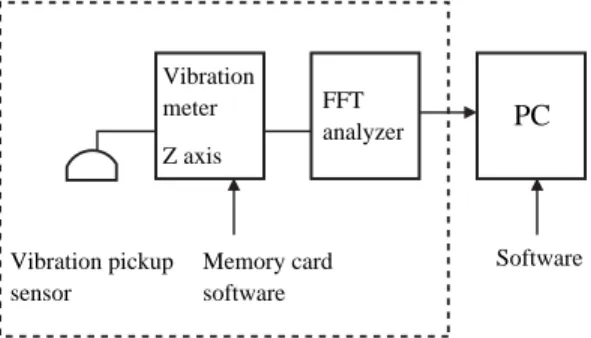
54WS, RION Co. LTD) 3
(VM 54, RION CO. LTD) 3 (PV 83CW, RION Co. LTD)
, z
.
FFT Analyzer (VS 2000L, Autosys Co, LTD)
. Fig. 1 .
Table 1 .
, ISO
2
.
2008 7 8 7 10
. 3
. ,
Fig. 1. A Block diagram of experimental setup for measuring vibration.
Vibration pickup sensor
Memory card software
Software FFT
analyzer Vibration
meter Z axis
PC
145 rpm, pitch 85%
.
ISO
(Area A), (Area B)
(Area C)
(Table 2),
Table 2 .
Table 3 . A
,
,
. B
,
. C
, , ,
. Fig. 2
. Table 1. Specification of training ship KAYA
Ship name Training ship KAYA Gross tonnage 1,737tons
Length(OA) 81.7m
Breadth 13.2m
Depth 8.0m
Main engine &
tow-stroke diesel eng. 2,976 250rpm Horse Power
Propeller C.P.P 4 blades 2.95m
Speed maximum 14.8knots, Service 13.5knots Max. boarding 152 peoples
Launching date May 3, 1993
Table 2. Overall frequency-weighted r.m.s values from 1Hz to 80Hz given as guidelines for the habitability of different areas on a ship (ISO6954:2000(E). Area A, Area B and Area C indicate the accommodation area of passenger, the accommodation area of crew and the working area, respectively
Area classification Area A Area B Area C (mm/s
2) (mm/s
2) (mm/s
2) Permissible upper limit
(uncomfortable) 143 214 286
Permissible lower limit
(comfortable) 71.5 107 143
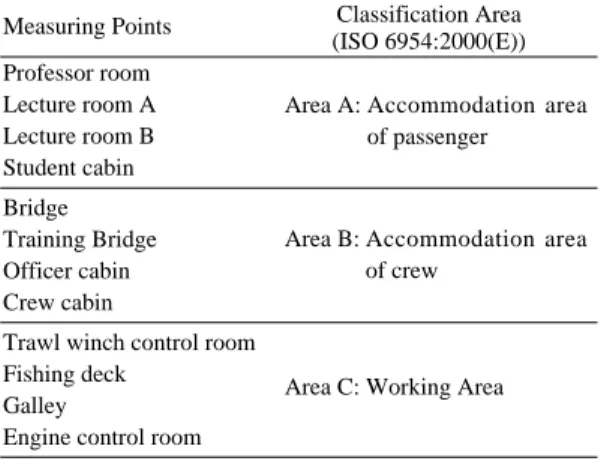
Table 3. Measuring points in the training vessel and classification Area defined by ISO 6954:2000(E) Measuring Points Classification Area
(ISO 6954:2000(E)) Professor room
Lecture room A Lecture room B Student cabin Bridge Training Bridge Officer cabin Crew cabin
Trawl winch control room Fishing deck
Galley
Engine control room
Area A: Accommodation area of passenger
Area B: Accommodation area of crew
Area C: Working Area
Fig 2. Measurement area of the vibration in the training ship KAYA. Area A(a-1 a-8), Area B(b-1 b-8) and Area C(c-1 c-8) denote the accommodation area of passenger, the accommodation area of crew and the working area, respectively.
F cle Deck Bridge Deck
Upper Deck
2ndDeck
3rdDeck
Table 4 .
A
ISO 6954:2000(E) A
A
Fig. 3 .
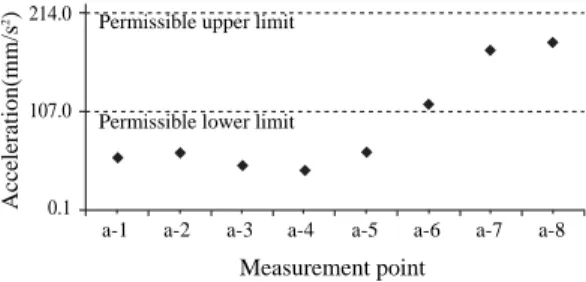
a 1 a 2, 1 a 3
a 4 79.8mm/s
288.8mm/s
2, 2 a 5 a 6 42.0mm/s
2, 53.2mm/s
2. 78.8mm/s
2115.8mm/s
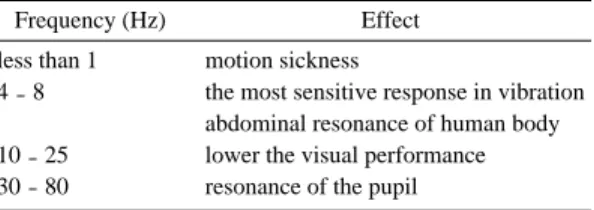
2Table 4. Effect of vibration frequency on human body
(Lee et al., 1990)
Frequency (Hz) Effect
less than 1 motion sickness
4 8 the most sensitive response in vibration abdominal resonance of human body 10 25 lower the visual performance 30 80 resonance of the pupil
Fig. 4. Power spectrum of z-axis vibration measured on professor room (a-1 and a-2), no. 1 lecture room (a-3 and a-4), no.
2 lecture room (a-5 and a-6), and student cabin (a-7 and a-8), respectively.
15 10 5 0 15 10 5 0 15 10 5 0 15 10 5 0
a-1 a-2
a-3 a-4
a-5 a-6
a-7 a-8
0 20 40 60 80 0 20 40 60 80
Frequency(Hz) Acceleration(mm/s
2)
Fig. 3. The compared vibration criterion of ISO 6954:
2000(E) Area A to the measured vibration values on the vessel of Area A.
a-1 a-2 a-3 a-4 a-5 a-6 a-7 a-8
Permissible upper limit
Permissible lower limit 143.0
71.5
2
Acceleration(mm/s )
0.0Measurement point
(a 8) . (a 8)
, 125.0mm/s
2.
(Yu et al., 1995).
Fig. 4 z
.
, 1Hz
1.4mm/s
24.1mm/s
2.
4 8Hz
2.4mm/s
25.5mm/s
2.
10 25Hz
2.5mm/s
212.0mm/s
2.
30 80Hz 0.8mm/s
25.4mm/s
2. A
10mm/s
210 25Hz
(a 8) .
A .
B B
. Fig. 5 ISO 6954:2000(E) B
B .
Fig. 5 ,
57.4mm/s
2114mm/s
2.
173.8mm/s
2182mm/s
2. (b 7, b 8)
, 125mm/s
2.
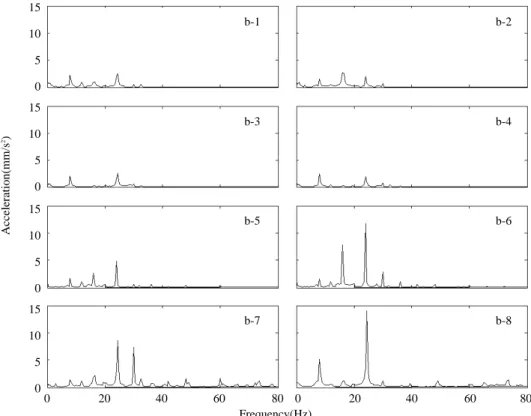
Fig. 6 B z
. , 1Hz
1.9mm/s
22.7mm/s
2.
,
4 8Hz 2.9mm/s
210.2mm/s
2.
10 25Hz 3.8mm/s
228.3mm/s
2.
Fig. 5. Comparison of the vibration acceleration measured on the Area B with the vibration criterion of ISO 6954:2000(E).
a-1 a-2 a-3 a-4 a-5 a-6 a-7 a-8
Permissible upper limit
Permissible lower limit 214.0
107.0
2
Acceleration(mm/s )
0.1Measurement point
30 80Hz
1.1mm/s
214.7mm/s
2.
B
10mm/s
24 8Hz
b 8 , 10 25Hz b 6
b 8 . 30 80Hz
b 7 .
B
. , ,
.
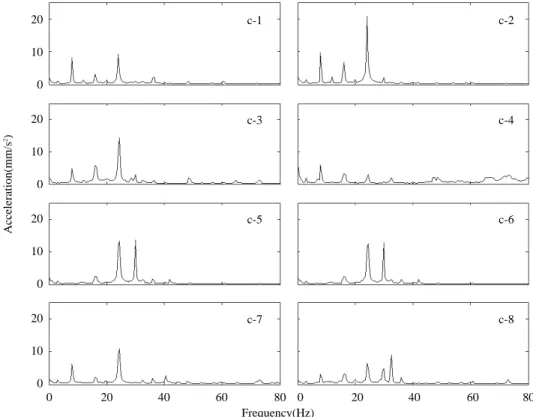
C
ISO 6954:2000(E) C
C
Fig. 7 . C
86.92mm/s2 155.7mm/s
2Fig. 6. Power spectrum of z-axis vibration measured on the bridge (b-1, b-2), training bridge (b-3, b-4), officers cabin (b- 5, b-6) and crew cabin (b-7, b-8), respectively.
15 10 5 0 15 10 5 0 15 10 5 0 15 10 5 0
b-1 b-2
b-3 b-4
b-5 b-6
b-7 b-8
0 20 40 60 80 0 20 40 60 80
Frequency(Hz) Acceleration(mm/s
2)
Fig. 7. The compared vibration criterion of ISO 6954:
2000(E) Area C to the measured vibration values on the vessel of Area C.
a-1 a-2 a-3 a-4 a-5 a-6 a-7 a-8
Permissible upper limit
Permissible lower limit
Measurement point
286.0143.0
2