Application of a Deep Learning Method on Aerial Orthophotos to Extract Land Categories
Won, Taeyeon1)·Song, Junyoung2)·Lee, Byoungkil3)·Pyeon, Mu Wook4)·Sa, Jiwon5)
Abstract
The automatic land category extraction method was proposed, and the accuracy was evaluated by learning the aerial photo characteristics by land category in the border area with various restrictions on the acquisition of geospatial data. As experimental data, this study used four years’ worth of published aerial photos as well as serial cadastral maps from the same time period. In evaluating the results of land category extraction by learning features from different temporal and spatial ranges of aerial photos, it was found that land category extraction accuracy improved as the temporal and spatial ranges increased. Moreover, the greater the diversity and quantity of provided learning images, the less the results were affected by the quality of images at a specific time to be extracted, thus generally demonstrating accurate and practical land category feature extraction.
Keywords : Land Category, Aerial Photo, Deep Learning, Serial Cadastral Map
1. Introduction
In cadastral records, land category is registered by classifying the type of land according to the main use of the land, and the value of the land is mostly determined by the land category (Hong et al., 2004). In addition, accurate management of land categories is essential for compensation in land use planning and disaster prevention measures (Lee et al., 2009). Land category extraction determined by remote sensing provides efficiency in checking the real land category for a wide range of areas, and its accuracy is expected to improve with the rapid development of image sensors and spectral resolution (Lee et al., 2011).
As a study to extract land category from remote exploration images, Hong et al. (2004) conducted a study
in which he extracted a land category non-coincidence ratio with IKONOS satellite images, 1:1000 scale digital maps, and a digital cadastral map. The image classification was based on a maximum likelihood method, and 14 out of 28 land categories were automatically classified to confirm their applicability. Lee and Hyun (2014) successfully classified land categories using hyperspectral sensor images (Lee et al., 2014).
In the analysis of the results, the currently registered designation is a legal land category rather than a true land category, indicating the limits of the results of the accuracy assessment. However, the future cadastre is prepared for the expansion of land category types and the availability of renewal of land category through land cover classification and production mapping is confirmed.
Received 2020. 09. 23, Revised 2020. 10. 05, Accepted 2020. 10. 26
1) Dept. of Advanced Technology Fusion, M.S. student, Konkuk University, Seoul, Korea (E-mail: [email protected])
2) Member, Dept. of Civil and Environmental Engineering, Undergraduate student, Konkuk University, Seoul, Korea (E-mail: [email protected]) 3) Member, Dept. of Civil Engineering, Professor, Kyonggi University, Suwon-si, Gyeonggi-do, Korea (E-mail: [email protected])
4) Corresponding Author, Member, Dept. of Civil and Environmental Engineering, Professor, Konkuk University, Seoul, Korea (E-mail: neptune@konkuk.
ac.kr)
5) Dept. of Digital Culture & Contents, Vice Professor, Konkuk University, Seoul, Korea (E-mail: [email protected])
https://doi.org/10.7848/ksgpc.2020.38.5.443 Original article
This is an Open Access article distributed under the terms of the Creative Commons Attribution Non-Commercial License (http://
The spectral reflection values contained within an image do not always fully reflect the actual land characteristics, making a proper interpretation of the elements a particularly difficult problem.
To overcome this problem, various studies have been conducted, such as the extraction of objects in images through spectral reflection values, shape, texture, and segmentation, but these methods also have technical limitations that are inconsistent with user intervention (Jensen, 2004).
Recently, the development of computer technology has led to the emergence of deep learning techniques that determine the characteristics of land cover in areas that may be classified by learning the characteristics of land cover from various training images. There has been a study that classified bareland, paddy field, and grassland from Kompsat-3 satellite images by the CNN (Convolutional Neural Network) technique. Also, it has been announced that semantic segmentation based on SegNet was carried out using aerial photos and the subsequent classification of urbanized dry areas, cropland, forests, and waters showed improvement over existing statistical techniques (Rhee et al., 2018; Lee &
Kim, 2019). Park et al. (2019) applied a deep learning model to the location-based Forest Aerial Photography image of the National Forest Inventory, and proved its applicability by automatically interpreting and classifying images according to the country-level land use category.
However, to develop a proper expectation, it is necessary to study how accurate the automatic land category extraction method can be when learning land category-specific images under limited conditions, such as the existence of security image occlusion areas and non-geocoded aerial photos that are released to the public.
In this study, an automatic land category extraction experiment was conducted by acquiring multitemporal aerial photos and serial cadastral maps corresponding to the study area through the national geospatial information portal and learning the aerial photo of parcel by land category. By experimenting with different temporal and spatial ranges of learning materials, the factors that have a positive effect on accuracy were analyzed.
2. Deep Learning of Aerial Photos
2.1 CNN (Convolutional Neural Network)
CNN (Convolutional Neural Network) was first introduced in “Backpropagation applied to handwritten zip” published by LeCun in 1989. It was designed specifically in “Hierarchical Neural Network for image interpretation” published by Behnke in 2003 (LeCun et al., 1989). A FCN (Fully Connected neural Network), which was used for the existing image recognition, serializes the pixels of the image and uses it as an input value to solve the classification problem through a neural network that is completely connected between nodes.
Therefore, as the image resolution increases, the number of nodes entering the input value increases, and the number of nodes in the hidden layer naturally increases, resulting in a large number of parameters and computational load. Having a strong dependence on the input image for all nodes, an overfitting problem can easily occur. CNN was studied as a method to overcome this hardware problem (Behnke, 2003).
The main concept of CNN is to generate a feature map through convolution, and then down-sample the feature map using pooling. The generated features are input to the FCN, and the classification problem is performed on the main features of the image. Owing to the convolution and pooling process, it was more flexible in the overfitting problem of FCN, and the amount of computation applied to learning was effectively reduced. CNN is mainly used to extract data features that have geometric and texture correlations between data, and various CNN-based models such as LeNet, AlexNet, ZFNet, GoogleNet, VGGNet, and ResNet were also studied using this technique (Song Ahram et al., 2017).
2.2 VGGNet
Through a competition called ILSVRC (ImageNet Large- Scale Visual Recognition Challenge) (Russakovsky et al., 2014), the development of an in-depth visual recognition architecture was achieved. In order to effectively develop the CNN model, another important aspect of the design of the convolutional neural network architecture, depth, was introduced. To realize this, a team steadily increased the network depth by modifying other parameters of the architecture and adding more circuit layers. This was
possible due to the use of very small (3 × 3) convolution filters in all layers. Through this, VGGNet has achieved significant improvements to the prior technique. Fig. 1 shows the VGGNet model structure. The early part of the model is composed of convolution and pooling, and the latter part is the FCN for the classifier (Simonyan et al., 2015).
Fig. 1. Model structure of VGGnet
The SmallerVGGNet applied in this study is a small VGGNet that simplifies the model itself among VGGNets, and it has the advantage that learning and prediction are a little faster than VGG16 or VGG19 because the number of weights is small. SmallerVGGNet was chosen in consideration of the poor specifications of the machine to be tested. However, because it is difficult to predict land cover including various features with the existing SmallerVGGNet classifier, a layer with 1000 nodes has been added to the classifier to allow
better accuracy in various cases. Here, the error function is set to binary cross entropy, and the accuracy for multiple labels is individually derived. It was composed of a system that shows the estimates for each of the various land cover classifications with the resulting multiple labels.
3. Experimental Data and Methods
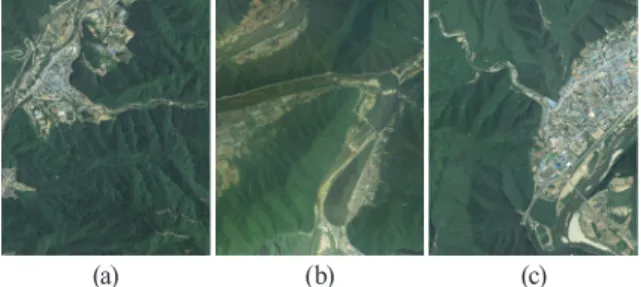
3.1 Experiment Locations and Data Acquisition The location for carrying out the experiments was selected as a part of Inje-gun, Gangwon-do, the Nam-myeon Eoron area, the Girin-myeon Hyeon-ri area, and the Inje-eup area;
in these areas where urban areas, farmland, and forest areas are evenly distributed (Fig. 1). To compare multitemporal parcel data as well as a variety of parcel data locally, image data corresponding to different years in the same region were acquired. The aerial photos and serial cadastral maps used in the experiment were downloaded from the Spatial Data Portal (http://map.ngii.go.kr/ms/map/NlipMap.do) and National Special Data Infrastructure Portal (http://www.
nsdi.go.kr/lxportal/?menuno=2679). The data were produced in accordance with the working regulations on video map production. Serial cadastral maps used for experiments were published in 2015, 2017 and 2019 immediately after the aerial photography. Table 1 summarizes the metadata for each year of images in Eoron, Hyeonri, and Inje.
Metadata file identifier Year Height Photo scale Map name GSD
201312002037801014 2013 Contour line 1:5000 Eoron014 0.25
201511000137801014 2015 DEM 1:5000 Eoron014 0.51
201711000737801014 2017 DEM 1:5000 Eoron014 0.51
201912000137801014 2019 DEM 1:5000 Eoron014 0.51
201312002038813077 2013 Contour line 1:5000 Inje077 0.25
201511000138813077 2015 DEM 1:5000 Inje077 0.51
201711000738813077 2017 DEM 1:5000 Inje077 0.51
201711000737802013 2017 DEM 1:5000 Hyeon-ri013 0.51
201912000137802013 2019 DEM 1:5000 Hyeon-ri013 0.51
Table 1. Annual aerial photos metadata by region
(a) (b) (c) Fig. 2. Aerial photos of experimental areas (a) eoron, nam-
myeon, Inje-gun, gangwon-do(2017), (b) hyeon-ri, girin- myeon, inje-gun, gangwon-do(2017), (c) inje-eup, inje-gun,
gangwon-do(2017)
3.2 Pre-Processing of Experimental Data Because they are also border areas, the experimental areas do not have geocoding, and therefore, the geometry correction is performed. In the case of a serial cadastral map, a computerized cadastral map and a forest map’s drawing boundary point are aligned as reference information that cannot be used as survey data. Therefore, rather than converting the serial cadastral map and aerial image to geographic coordinates, the aerial images were registered on the serial cadastral map. As shown in Fig. 3, the ground control points were extracted from the serial cadastral map for simple geometry correction, and as a result of by the experimental region, RMSE was computed within three pixels, that is 1.6 pixels of Eoron, 2.65 pixels of Hyun-ri, and 2.63 pixels of Inje-eup.
(a) (b) (c)
Fig. 3. Ground control points ( layout (a) eoron (2019) (25 points), (b) hyeon-ri (2019) (25 points), (c) inje-eup
(2017) (27 points)
3.3 Data Processing
Training images were acquired by performing a clipping operation according to the matching area using ArcGIS software that version is 10.2.2, and using aerial photos
that were geometrically matched on the cadastral map.
Describing as a model builder tool flow, to specify the fields for feature selection in ‘Group By Fields’ parameters, each parcel was selected through ‘Iterate Feature Selection’, and the ‘Copy Features’ tool was used to save each ‘Selected Features’ class. Each of the stored feature classes was used as a mask in ‘Extract by Mask’ to extract parcels from the input raster image that are the source data required to train the deep learning model.
There were 23 land categories included in the serial cadastral map used in the experiment; among them were,
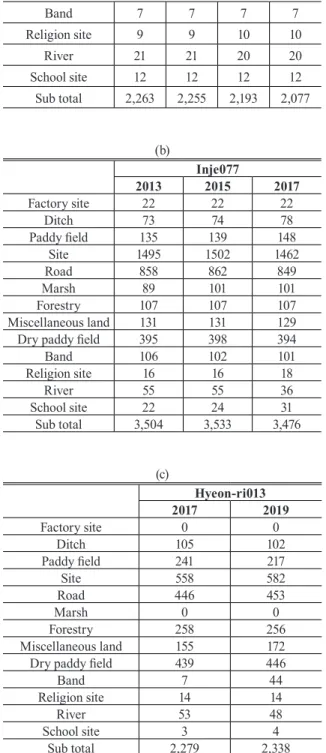
‘mineral spring site’, ‘saltern’, ‘historical area’, ‘water supply site’, or ‘recreation area’. In addition, if the number of parcels that can be learned is less than 100, the corresponding site was also excluded and a total of 13 sites were selected and tested as shown in Table 2. Table 2 represents the change in the number of parcel data collected in each year’s serial cadastral map within the experimental region.
The number of parcels used in the experiment shows a difference between the 2013 and 2015 aerial photos, even though the 2015 serial cadastral map was used in both cases. This is because of Select by Polygon tool that is manual processing in specifying clipping area. Because inappropriate data that can’t use in resampling process was generated by clipping process when the extent of clipping area was specified by ‘extent’ option from environment of tool.
Because Select by Polygon tool was just used to specifying clipping area, it does not affect the accuracy evaluation.
Table 2. The number of each year’s experimental serial cadastral parcel
(a)
Eoron014
2013 2015 2017 2019
Factory site 32 32 27 27
Ditch 56 55 51 56
Paddy field 116 115 115 116
Site 862 862 834 794
Road 569 569 560 451
Marsh 41 42 41 42
Forestry 94 95 95 97
Miscellaneous land 98 98 100 111
Dry paddy field 346 338 321 334
Band 7 7 7 7
Religion site 9 9 10 10
River 21 21 20 20
School site 12 12 12 12
Sub total 2,263 2,255 2,193 2,077
(b)
Inje077
2013 2015 2017
Factory site 22 22 22
Ditch 73 74 78
Paddy field 135 139 148
Site 1495 1502 1462
Road 858 862 849
Marsh 89 101 101
Forestry 107 107 107
Miscellaneous land 131 131 129
Dry paddy field 395 398 394
Band 106 102 101
Religion site 16 16 18
River 55 55 36
School site 22 24 31
Sub total 3,504 3,533 3,476
(c)
Hyeon-ri013
2017 2019
Factory site 0 0
Ditch 105 102
Paddy field 241 217
Site 558 582
Road 446 453
Marsh 0 0
Forestry 258 256
Miscellaneous land 155 172
Dry paddy field 439 446
Band 7 44
Religion site 14 14
River 53 48
School site 3 4
Sub total 2,279 2,338
3.4 Experimental Method
This study evaluates the accuracy of land category feature extraction subject to limited learning image conditions, such as discrepancies between the legal land category and the true
land category, security processing of aerial photographs, and locational misregistration between the serial cadastral map and the aerial photo. Aerial photos and the serial cadastral map for 2019 were selected as the reference data for the accuracy assessment.
The process used for feature extraction and accuracy evaluation is shown in Fig. 4. After dividing the data according to conditions, train the SmallerVGGNet model from the training data. Next, the test data is predicted by the trained model and its accuracy is evaluated. Everything that trains the data, image predict, and analyzes errors was used Python version 3.7.3 and the framework used for training is Tensorflow version 1.15.0 and Keras version 2.2.4.
Fig. 4. Flow chart of the overall work process of the system First, the trained model was produced using the 2017 Aerial Photo and Land Category of Serial Map, and then the Land Category was extracted from the 2019 Aerial Photo. In other words, the single-year trained model of the study area was applied to the aerial photos of other years to extract the land category and evaluate its accuracy. In addition, these models were evaluated by applying them to aerial photos from different regions.
Second, we perform an experiment to determine how much the accuracy of feature extraction is improved compared to single-year learning when training includes the multitemporal aerial photos by their land category. In addition, the feature extraction accuracy was calculated when the trained model was applied to other areas by learning the multitemporal aerial photos. Third, we tested the improvement of the accuracy of land category extraction when the spatial range of the parcels was expanded.
Aerial photos for each land category are pre-processed,
and stored in a certain folder to suit the training environment.
Since it requires a very high-performance computer to learn from the original aerial photos, all the images were reduced to a certain size prior to training.
4. Results and Discussion
4.1 Learning Results using Single Year Aerial Photos
As an experiment on learning using single-year photos, aerial photos in 2019 were used for testing, and aerial photos in 2017, the nearest year, were used for learning. The training was conducted using aerial photos of the Eoron area, and the
Land
category Clipped Image Land
category Clipped Image
park miscellaneous
land
ditch dry paddy field
paddy field bank
site religion site
road river
marsh school site
forestry
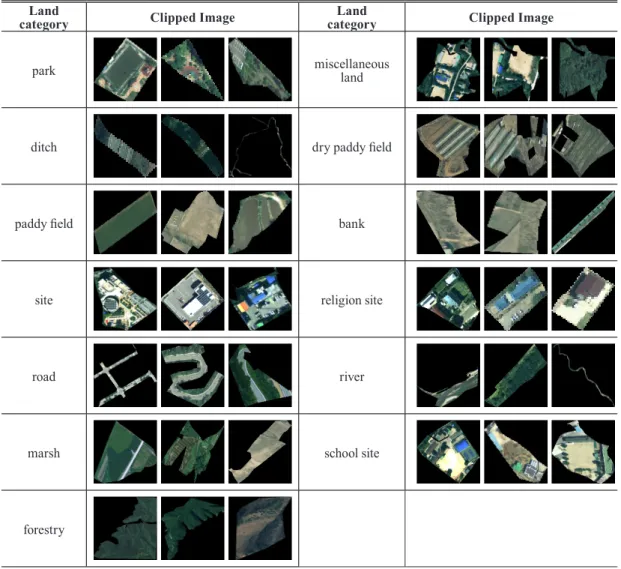
Table 3. Training and validation dataset built according to the land cover system of the ministry of environment
result of testing the accuracy of classifying aerial photos from the Eoron area was 92.4%. The land category that realized the lowest accuracy was the miscellaneous land category, mainly misclassified as the dry paddy field land category. Experiments using the Hyeon-ri area for learning yielded poor results. The learning was conducted using aerial photos of Hyeon-ri area, and the result of testing aerial photos from the Hyeon-ri area showed a low overall accuracy of 63.9%. Land categories with poor accuracy were bank, religion site, and school site land categories. In the cadastral map of 2017 of the Hyeon-ri area, there were 7 banks, but in 2019, the number of banks increased to 44, which is believed to be related to the fact that the characteristics of the land
categories were not accurately learned in training. There is a little religious land, and it does not have distinct features compared to the site land category. The religion site land category was usually misclassified into other land categories.
After training using aerial photos of the Eoron area, the accuracy of the test result of aerial photos of Hyeon-ri area was 39.2%. This is presumed to be since the characteristics such as the shape and size of each land category in the Eoron area and Hyeon-ri area are significantly different.
4.2 Learning Results Using Multitemporal Aerial Photos
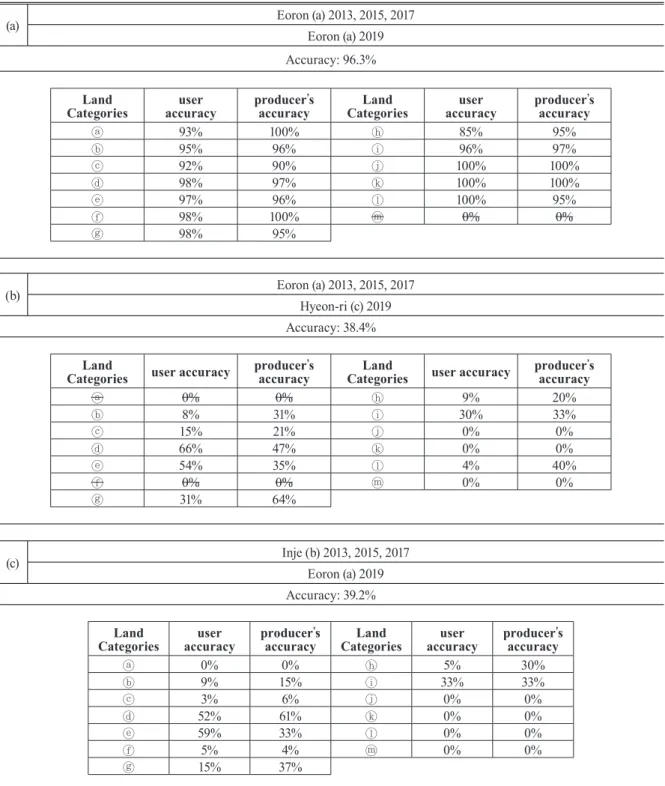
The learning was conducted using multitemporal (2013, 2015, 2017) aerial photos taken in the Eoron area, and the overall accuracy of the result of testing aerial photos from 2019 of the Eoron area was 96.3% (Table 4 (a)). The land category that realized the lowest accuracy was the miscellaneous land category, mainly misclassified as either the road or dry paddy field land categories.
In addition, learning was conducted using multitemporal (2013, 2015, 2017) aerial photos in the Eoron area, and the accuracy of the result of testing aerial photos taken in 2019 of the Hyeon-ri area was 38.4% (Table 4 (b)). The accuracy of the results of training using multitemporal aerial photos in the Inje area and testing 2019 aerial photos from the Eoron area was calculated as 39.2% (Table 4 (c)). The land categories that generally showed low accuracy in the two experiments with poor results were among the ditch, bank, religion site, river, and school site land categories. These are analyzed as having poor results because they do not have distinct features, and learning was performed with only a few training objects.
Previously, the analysis of the Hyeon-ri area, which had a lot of regional changes from 2017 to 2019, and the accuracy of the results as applied to the Hyeon-ri area after training in the Eoron area were analyzed and found to perform similarly for the same reason.
4.3 Learning Results by Expanding the Spatial Range
The training in this experiment was conducted using 2017 aerial photos of all regions (Eoron, Inje, Hyeon-ri), and the results predicted using only the 2019 aerial photos from the
Eoron regions were highly accurate at 92.6% (Table 4 (d)).
The same model, given only the 2019 aerial photos from Hyeon-ri extracted features with 70.5% accuracy, which is greater than other similar experiments for the Hyeon-ri (Table 4 (e)). When tested with aerial photos taken in 2019 from all regions, the predicted results by this model were 87.8% accurate, a satisfactory result (Table 4 (f)).
In these experiments, the land category with the lowest accuracy is a bank, and the land categories most accurately predicted were factory site, marsh, and school site. The bank land category varies greatly from year to year and its shape varies depending on the river shape, whereas land categories such as factory sites, marshes, and school sites have distinct characteristics such as the shape and color of the object. Misclassification in the paddy field and dry paddy field land categories during the experiment seems to be a problem caused by inherent seasonal differences in the aerial photographs.
4.4 Discussion
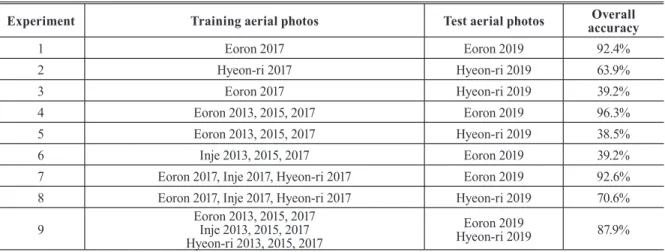
In this study, the accuracy of the test results was evaluated after performing nine experiments, as listed in Table 5. These were performed according to the presence or absence of multitemporal aerial photos and 2019 aerial photos. Overall, the accuracy of the model that applied the results of learning about the same area, as was the case in experiments 1 and 4, was excellent. On the other hand, the accuracy of the model trained on one region, but extracting features from another, such as experiments 3, 5, and 6, was quite low. Experiment 2 was a test that applied the results learned and predicted within the same area, but the classification result was not high.
Experiment 4, trained with multitemporal aerial photos in the Eoron region, improved accuracy by 3.9% compared to experiment 1, trained with aerial photos from only a single year. Experiment 5, which trained multitemporal aerial photos in Eoron area, but used to classify Hyeon-ri images, decreased accuracy by 0.7% compared to experiment 3, which trained with aerial photos from only a single year.
Experiment 7, which classified Eoron images after broadening the regional range of training, improved accuracy by 0.2% compared to experiment 1 on Eoron.
Experiment 8, which tested Hyeon-ri, improved accuracy
Table 4. Accuracy evaluation results
(a) Eoron (a) 2013, 2015, 2017
Eoron (a) 2019 Accuracy: 96.3%
Land
Categories user
accuracy producer’s
accuracy Land
Categories user
accuracy producer’s accuracy
ⓐ 93% 100% ⓗ 85% 95%
ⓑ 95% 96% ⓘ 96% 97%
ⓒ 92% 90% ⓙ 100% 100%
ⓓ 98% 97% ⓚ 100% 100%
ⓔ 97% 96% ⓛ 100% 95%
ⓕ 98% 100% ⓜ 0% 0%
ⓖ 98% 95%
(b) Eoron (a) 2013, 2015, 2017
Hyeon-ri (c) 2019 Accuracy: 38.4%
Land
Categories user accuracy producer’s
accuracy Land
Categories user accuracy producer’s accuracy
ⓐ 0% 0% ⓗ 9% 20%
ⓑ 8% 31% ⓘ 30% 33%
ⓒ 15% 21% ⓙ 0% 0%
ⓓ 66% 47% ⓚ 0% 0%
ⓔ 54% 35% ⓛ 4% 40%
ⓕ 0% 0% ⓜ 0% 0%
ⓖ 31% 64%
(c) Inje (b) 2013, 2015, 2017
Eoron (a) 2019 Accuracy: 39.2%
Land
Categories user
accuracy producer’s
accuracy Land
Categories user
accuracy producer’s accuracy
ⓐ 0% 0% ⓗ 5% 30%
ⓑ 9% 15% ⓘ 33% 33%
ⓒ 3% 6% ⓙ 0% 0%
ⓓ 52% 61% ⓚ 0% 0%
ⓔ 59% 33% ⓛ 0% 0%
ⓕ 5% 4% ⓜ 0% 0%
ⓖ 15% 37%
(d) Eoron (a), Inje (b), Hyeon-ri (c) 2017 Eoron (a) 2019
Accuracy: 92.5%
Land
Categories user
accuracy producer’s
accuracy Land
Categories user
accuracy producer’s accuracy
ⓐ 70% 100% ⓗ 84% 96%
ⓑ 84% 90% ⓘ 91% 94%
ⓒ 84% 97% ⓙ 86% 75%
ⓓ 96% 93% ⓚ 100% 100%
ⓔ 93% 89% ⓛ 100% 95%
ⓕ 93% 93% ⓜ 83% 83%
ⓖ 97% 95%
(e) Eoron (a), Inje (b), Hyeon-ri (c) 2017
Hyeon-ri (c) 2019 Accuracy: 70.5%
Land
Categories Land
Categories producer’s
accuracy Land
Categories user
accuracy producer’s accuracy
ⓐ 0% 0% ⓗ 28% 71%
ⓑ 60% 81% ⓘ 73% 73%
ⓒ 56% 77% ⓙ 0% 0%
ⓓ 86% 71% ⓚ 36% 63%
ⓔ 83% 62% ⓛ 52% 50%
ⓕ 0% 0% ⓜ 25% 100%
ⓖ 73% 86%
(f) Eoron (a), Inje (b), Hyeon-ri (c) 2013, 2015, 2017
All region 2019 Accuracy: 87.8%
Land
Categories user
accuracy producer’s
accuracy Land
Categories user
accuracy producer’s accuracy
ⓐ 89% 95% ⓗ 78% 85%
ⓑ 79% 91% ⓘ 81% 92%
ⓒ 80% 91% ⓙ 22% 55%
ⓓ 95% 90% ⓚ 83% 100%
ⓔ 93% 85% ⓛ 78% 83%
ⓕ 98% 95% ⓜ 88% 78%
ⓖ 93% 82%
ⓐ : factory site, ⓑ : ditch, ⓒ : paddy field, ⓓ : site, ⓔ : road, ⓕ : marsh, ⓖ : forestry,
ⓗ : miscellaneous land, ⓘ : dry paddy field, ⓙ : bank, ⓚ : religion site, ⓛ : river, ⓜ : school site Text : Text with strikethrough means no image for predict
by 6.7% and 30.4%, respectively, compared to Experiment 2 and Experiment 3 for Hyeon-ri. After training with all aerial photos and testing all aerial photos in 2019, the result was 6.3% better than the average of 81.6% of experiments 7 and 8 with an accuracy of 87.9%.
In this way, for land category extraction by deep learning, the best result was to expand the spatial range of training, and the use of multitemporal aerial photos was also found to have a positive effect.
The causes of misclassification include damage to the internal texture during the image resizing process, an error in matching between the cadastral map and the aerial photos, an insufficient number of available images used for training, and differences between the aerial photos used for training and the aerial photos tested.
5. Conclusion
Recently, the government has provided various cadastral information and aerial photos through spatial information portals. Using this information to extract and update land category information is important to accurately assess the value of land and to properly establish land use plans. As a method of implementing this, deep learning has been shown to enable aerial photo detection, and in this experiment, it was shown that technical implementation using public data is possible.
The experimental area does not provide embedded
Experiment Training aerial photos Test aerial photos Overall
accuracy
1 Eoron 2017 Eoron 2019 92.4%
2 Hyeon-ri 2017 Hyeon-ri 2019 63.9%
3 Eoron 2017 Hyeon-ri 2019 39.2%
4 Eoron 2013, 2015, 2017 Eoron 2019 96.3%
5 Eoron 2013, 2015, 2017 Hyeon-ri 2019 38.5%
6 Inje 2013, 2015, 2017 Eoron 2019 39.2%
7 Eoron 2017, Inje 2017, Hyeon-ri 2017 Eoron 2019 92.6%
8 Eoron 2017, Inje 2017, Hyeon-ri 2017 Hyeon-ri 2019 70.6%
9 Eoron 2013, 2015, 2017
Inje 2013, 2015, 2017 Hyeon-ri 2013, 2015, 2017
Eoron 2019
Hyeon-ri 2019 87.9%
geocoding information in the public aerial photos used but does have characteristics of border area topographic data such as the presence of camouflage areas. In addition, different cameras are used for each image acquisition year for aerial photography, and due to the nature of Korea’s climate, an additional restriction condition exists in that the aerial photos are concentrated in a specific season. Under these conditions, land category information and aerial photo data were acquired, learning was conducted, and accuracy was evaluated. As a result of the experiment, it was found that both multitemporal aerial photo learning for the same area and land category types in various places play a positive role in improving the accuracy of land category extraction. In addition, it was confirmed that the more the temporal and spatial ranges were expanded for training, the better the prediction accuracy was, regardless of the quality of the test aerial photos.
In the future, the study of land category detection that accommodates seasonal and regional characteristics will be conducted by securing a broad range and sufficient amount of learning data and by performing various types of training varied by the time of image capture.
Acknowledgment
This research was funded and conducted of the MOTIE (Ministry of Trade, Industry and Energy), operated by KEIT (Korea Evalusation Institute of Industrial Technology).
Table 5. Summary of experimental results
(Development of BIM-based UAV system and service to cope with collision accident of construction site workers No.
20005101)
References
Hong, S.E., Yi, D.H., and Park, S.H. (2004), Non-coincidence Measurements Using High Resolution Satellite Images and Digital Topographic Maps, The Journal of GIS Association of Korea, Vol. 12, No. 1, pp. 43-56. (in Korean with English abstract).
Lee, G.S., Kim, Y.R., Sim, J.M., and Min, K.S. (2009), The Analysis of Land Category Information for Flood Inundation Area Based on GIS, Journal of The Korean Cadastre Information Association, vol.11, no.2, pp. 45-55.
(in Korean with English abstract).
Lee, H.J., Lu, J.H., and Kim, S.Y. (2011.3), Land Cover Object- oriented Base Classification Using Digital Aerial Photo Image, The Korean Society for Geospatial Information Science, vol.19, no.1, pp. 105-113. (in Korean with English abstract).
Lee, I.S. and Hyun, C.U. (2014), Applicability of Hyperspectral Imaging Technology for the Check of Cadastre’s Land Category, Journal of the Korean Society of Surveying, Geodesy, Photogrammetry and Cartography, Vol. 32, No.
4-2, pp. 421-430. (in Korean with English abstract) Jensen, J.R. (2004), Introductory Digital Image Processing
- a Remote Sensing Perspective, 3rd edition, Prentice Hall Inc.
Rhee, S.Y., Jeon, W.S., and Choi, H. (2018), Analysis on the applicability of deep learning for Kompsat-3A satellite image classification, Journal of the Korean Society for Geospatial Information Science, Vol. 26 No. 4, pp. 69-76.
(in Korean with English abstract)
Lee, S.H. and Kim, J.S. (2019), Land Cover Classification Using Semantic Image Segmentation with Deep Learning, Korean Journal of Remote Sensing, Vol. 35, No. 2, pp. 279- 288. (in Korean with English abstract)
Park, J.M., Sim, W.D., and Lee, J.S. (2019), Automatic Classification by Land Use Category of National Level LULUCF Sector using Deep Learning Model, Korean Journal of Remote Sensing, Vol. 35, No. 6-2, pp. 1053-
1065. (in Korean with English abstract)
LeCun, Y., Bottou, L., Bengio, Y., and Haffner, P. (1998), Gradient-based learning applied to document recognition.
Proceedings of the IEEE, Vol. 86, No.11, pp. 2278-2324.
Simonyan, K., and Zisserman, A. (2014). Very deep convolutional networks for large-scale image recognition. arXiv, https://arxiv.org/abs/1409.1556 LeCun, Y., Boser, B., Denker, J.S., Henderson, D.,
Howard, R.E., Hubbard, and W., Jackel, L.D., (1989), Backpropagation Applied to Handwritten Zip Code Recognition, Neural Computation, Volume 1, Issue 4, Dec., pp. 541 – 551.
Behnke, S. (2003), Hierarchical Neural Networks for Image Interpretation, Lecture Notes in Computer Science, Draft submitted to Springer-Verlag. Vol. 2766
Russakovsky, O., Deng, J., Su, H., Krause, J., Satheesh, S., Ma, S., Huang, Z., Karpathy, A., Khosla, A., Bernstein, M., Berg, A.C., and Fei, L.F. (2014), ImageNet Large Scale Visual Recognition Challenge, International Journal of Computer Vision, Vol. 115, Issue. 3, pp. 211-252.
Song, A.R., and Kim, Y.I. (2017), Deep Learning-based Hyperspectral Image Classification with Application to Environmental Geographic Information Systems, Korean Journal of Remote Sensing, v. 33 no. 6 pt. 2, pp. 1061-1073.
(in Korean with English abstract)