Research on Stock price prediction system based on BLSTM
Sunghyuck Hong
Professor, Baekseok University, Division of ICT
BLSTM을 이용한 주가 예측 시스템 연구
백석대학교 ICT학부 부교수 홍성혁
Abstract Artificial intelligence technology, which is the core of the 4th industrial revolution, is making intelligent judgments through deep learning techniques and machine learning that it is impossible to predict if it is applied to stock prediction beyond human capabilities. In US fund management companies, artificial intelligence is replacing the role of stock market analyst, and research in this field is actively underway. In this study, we use BLSTM to reduce errors that occur in unidirectional prediction of the existing LSTM method, reduce errors in predictions by predicting in both directions, and macroscopic indicators that affect stock prices, namely, economic growth rate, economic indicators, interest rate, analyze the trade balance, exchange rate, and volume of currency. To help stock investment by accurately predicting the target price of stocks by analyzing the PBR, BPS, and ROE of individual stocks after analyzing macro-indicators, and by analyzing the purchase and sale quantities of foreigners, institutions, pension funds, etc., which have the most influence on stock prices.
Key Words : BLSTM, Deep Learning, AI Stock Prediction, Big Data, Prediction System
요 약 4차산업혁명의 핵심인 인공지능 기술은 인간의 능력을 뛰어넘어 주식예측에도 적용하고 있으면 예측이 불가능 한 것을 딥러닝 기법과 머신러닝을 통하여 지능화된 판단을 내리고 있는 실정이다. 미국의 펀드매니지먼트 회사에서는 증시 에널리스트의 역할을 인공지능이 대신하고 있으며, 이 분야의 연구가 활발히 진행 중에 있다. 본 연구에서는 BLSTM을 이용하여 기존의 LSTM방식의 단방향 예측에서 발생하는 오류를 줄이고, 양방향으로 예측하여 예측에 대한 오류를 줄이고, 주식 가격에 영향을 미치는 거시 지표, 즉 경제성장률, 경제지표, 이자율, 무역수지, 환율, 통화량을 분 석한다. 거시 지표 분석 후에 개별 주식에 대한 PBR, BPS, ROE 예측과 가장 주식 가격에 영향을 미치는 외국인, 기관, 연기금 등 매수와 매도 물량을 분석하여 주식의 목표주가를 정확히 예측하여 주식 투자에 도움을 주기 위해 본 연구를 수행했다.
주제어 : BLSTM, 딥러닝, 인공지능 주가분석, 빅데이터, 예측 시스템
*This research was supported by 2020 Baekseok University Research Fund.
*Corresponding Author : Sunghyuck Hong([email protected]) Received August 28, 2020
Accepted October 20, 2020 Revised September 22, 2020 Published October 28, 2020
1. Introduction
Korea's KOSPI market is evaluated at 1,393
trillion won, with a net profit of 81 trillion and
equity capital of 1,589 trillion, ranking 14th in
the world, and Samsung Electronics ranked 18th
in the market cap of the world's top 50 companies [1]. Research on stock prediction is divided into technical analysis, basic analysis, data analysis, machine learning analysis, and statistical analysis. Among them, machine learning analysis is being done actively. Recently, interest in big data has emerged.
At the same time, analysis research using big data is also underway. Research using big data uses Internet news and search trends. For the thesis that establishes a stock index prediction model for each Internet news medium using real-time Internet news, and the sentiment score is calculated by constructing a sentiment dictionary using the words of the news, and the opinion score is standardized based on the sentiment score to 55.21% [1]. A study using search trends analyzed the frequency of search of specific words related to stocks on domestic search sites to analyze the rate of return for each search term trend is not this research area[2-4].
This research focused on analysis for technical variables which can affect a stock price.
2. BLSTM(Bidirectional Long-Short Term Memory)
BLSTM uses two LSTM models which are one for right direction and the other for left direction.
LSTM is a part of recurrent neural network [5].
Humans don't start all thinking from the bottom up. It is clear that you, reading this now, will understand every word based on the previous one. You will throw away everything you've seen so far, and you won't think without knowing anything. Thinking is going on. The big drawback is that traditional neural networks are unable to conceive of such persistent thinking. For example, let's say you want to classify the events that happen at every moment in a movie.
Traditional neural networks are unable to think of what happens later based on what happened before [6-8].
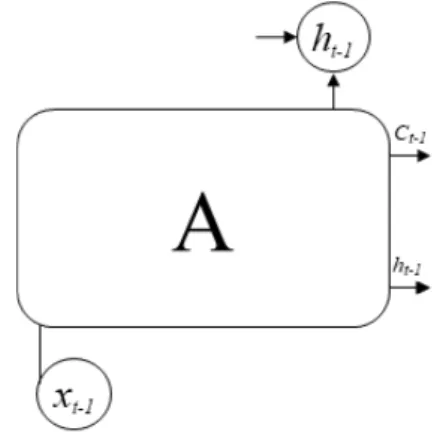
The recurrent neural network (hereinafter referred to as RNN) is a model to solve this problem. The RNN repeats itself, allowing the information obtained in the previous step to persist. Recurrent neural networks have loops RNN repeats itself. In the Fig. above, A is a chunk of RNN. In Fig. 1, A is input, and it takes X
tand exports h
t[9-11]. The iteration around A shows that the network in the next step receives the information from the previous step.
Fig. 1. Basic Structure of RNN
The repetitive structure of this RNN may seem mysterious, but if you think about it a little more, you can see that the RNN is not so different from the existing neural network. Think of an RNN as a network that continuously copies one network and delivers information in order. It will be easier to understand if you solve the repetition altogether.
Like this, the nature of the RNN's chain tells us
that it leads directly to a sequence or list. It is a
neural network with a structure optimized to
handle such data. In addition, RNN is well
suitable to predict similar pattern over and over
again.
2.1 Problems in Long Term Dependency The key to RNN's success is the use of "Long Short-Term Memory Network". LSTM is a very special kind of RNN, and it solves the problems of understanding the movie frame by frame that we talked about before, really much better than a simple RNN. If the existing RNN can do this as well as the LSTM, the RNN will be very useful, but unfortunately, the performance of the RNN varies depending on the situation. Sometimes, it only needs up-to-date information, not far away, to get something at the moment. For example, consider a language model that predicts the next word based on previous words. If we want to match the last word in "the clouds are in the sky", we don't need to look any further than that sentence. The last word must be sky. As in this case, if the time gap for obtaining necessary information is not large, the RNN can also learn based on past information. Therefore, the past closed data will more effect on the result than old data [12-16].
3. BLSTM Overview
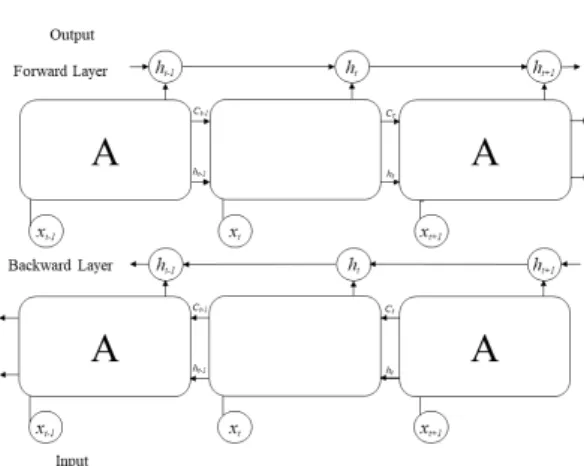
BLSTM is Bidirectional LSTM (Long-Short Term Memory) which the preceding and succeeding input sequences are be used to exploit all data to satisfy best learning process performance [3]. Fig.
2 shows simple BLSTM structure [5]. Schuster and Paliwal [6] developed Bidirectional LSTM which trains the network using input data sequences in the past and future in Fig. 2 [4].
3.1 Major Factors to Affect on Stock Price Recently, stock prices have changed sensitively not only to domestic economic variables such as inflation and economy.
Fig. 2. Simple Structure of BLSTM
However, it is also to the movement of foreign economic variables such as the US interest rate and the yen/dollar exchange rate, so how stock prices react to changes in major macroeconomic variables at domestic and abroad. Therefore, in this study, after selecting major macroeconomic variables that are likely to have high explanatory power for stock price fluctuations, five models were set as a behavioral approach based on the macroeconomic model, and predictions using BLSTM were performed [17].
As a result of empirical analysis of the prediction model, the effect of the impact of macroeconomic variables on the stock price in the long term is consistent with the direction predicted by the theory, and it is judged that the model has appropriateness. The factors can apply for micro assessments which means weight values. For example, the factors are not good enough, the predicted stock price must be controlled by ratio per the factors.
The major factors including macroscopic
indicators are affecting stock prices, namely,
economic growth rate, economic indicators,
interest rate, analyze the trade balance, exchange
rate, and volume of currency. To help stock
investment by accurately predicting the target
price of stocks by analyzing the PBR, BPS, and
ROE of individual stocks after analyzing
macro-indicators, and by analyzing the purchase
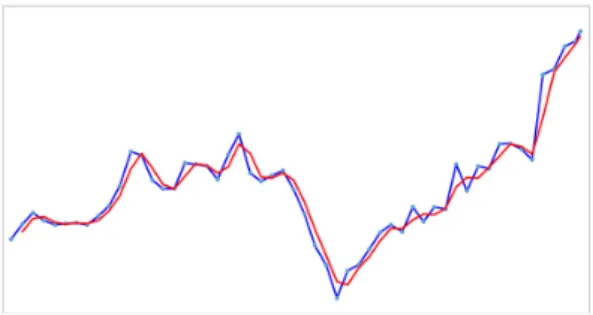
Fig. 3. incremental ratio graph
and sale quantities of foreigners, institutions, pension funds, etc., which have the most influence on stock prices. After prediction for macroscopic indicators, it’s time to predict major stock indicators which means KOSDAQ, KOSPI, DOW, S&P500, and NASDAQ [18-21].
Fig. 3 shows NASDAQ and Qualcomm incremental ratio graph.
Qualcomm is a major IT company and NASDAQ is avaerage stock price for IT companies. They are quit similar. If BLSTM predict NASDAQ, the each stock price will be affected by major NASDAQ.
3.2 BLSTM Test Environments
To predict stock price, we used Python, TensorFlow, Jupyter notebook, and Keras.
Hardware specification is not relevant for testing.
Software environment is more relevant than hardware environment. Generally speaking, a cyclical neural network has a time series concept added, and it can store information of past data in a hidden layer, but because the input order is processed in chronological order, so there is a limitation that the result tends to be mainly based on the previous pattern [17]. To solve this limitation, the bidirectional circulatory neural
network is trained through two separate circulatory neural networks in the forward and reverse directions. The performance is improved by adding an additional hidden layer in the reverse direction of the time series data to be trained [18].
Fig. 4 shows BLSTM forward and backward Python code. Keras provides well available library codes. It does not have to generate code.
# Training model total_st = len(train_loader) for epoch in range(num_epochs):
for i, (images, labels) in enumerate(train_loader):
images = images.reshape(-1, sequence_length, input_size).
to(device)
labels = labels.to(device)
#forward
outputs = model(images) loss = criterion(outputs, labels)
#backward
optimizer.zero_grad() loss.backward() optimizer.step() if (i+1) % 200 == 0:
print ('Epoch [{}/{}], St [{}/{}], Loss: {:.4f}'
.format(epoch+1, num_epochs, i+1, total_st, loss.item()))
Fig. 4. BLSTM Python Code
3.3 BLSTM Prediction Results
Fig. 5 shows Qualcomm stock price and
prediction graph. The blue line is an actual
Qualcomm stock price, and the red line is
prediction stock price. They are similar, and it can be managed by micro indicators major stock indicators which are KOSDAQ, KOSPI, DOW, S&P500, PER, PBR, Sales, Profit, ROA, and ROE.
Fig. 5. Predicted Stock Price for Qualcomm
PER is price earning ratio, and it is stock return ratio in Table 1. Each stock’s PER, PBR, Sales, Profit, ROA, and ROE can be estimated, and they can be also predicted by BLSTM. The price prediction is a major. However, there are many other indicators to effect the predicted price. Therefore, once BLSTM has completed the predication of price, then compare to other indicators for micro control stock price. That would be more accurate price in the future.
Type Year 2020 2019 2018 2017
PER 29.60 70.61 - 20.64
PBR 32.59 - - 4.56
Sales 21,094M 19,573M 22,732M 22,291M
Profit 5,170M 3,381M 2,829M 5,048M
ROA 11.76 13.36 -9.01 4.18
ROE 97.68 153.46 -28.05 7.89