This is an Open-Access article distributed under the terms of the Creative Commons Attribution Non-Commercial License(http://creativecommons.org/licenses/by-nc/3.0) which permits unrestricted non-commercial use, distribution, and reproduction in any medium, provided the original work is properly cited.
Influence of Surface Roughness of Tools on the Friction Stir Welding Process
Michael Hartmann*, Stefan Böhm* , † and Sven Schüddekopf*
*Department for Cutting and Joining (tff), Institute for Production Technologies and Logistics (IPL), University of Kassel Kurt-Wolters-Straße 3, 34125 Kassel, Germany
†Corresponding author : [email protected]
(Received July 1, 2014 ; Revised September 24, 2014 ; Accepted November 1, 2014)
Abstract
Most publications on friction stir welding describe phenomena or results with given process parameters like feed rate, rotation speed, angle and depth of penetration. But without a complete documentation of tool design, the results under the same process parameters are completely different.
For this purpose, the Institute of Cutting and Joining Manufacturing Processes (tff), University of Kassel investigated the influence of tool roughness on the friction stir welding process. Therefore a defined surface finish was produced by turning and die sinking. As basis of comparison the constant parameters were rotation speed, feed rate, tilt angle and a heel plunge depth. Sound butt-welds were produced in aluminium alloy 6082 (AlMgSi1) with 1.5 mm sheet thickness with a turned reference tool with a surface of Ra = 0.575 µm in position controlled mode. The surfaces are manufactured from a very fine to a very rough structure, classified by the VDI-classes with differences in the arithmetical mean roughness.
It can be demonstrated with the help of temperature measures, that less heat is generated at the surfaces of the shoulder and the pin by the higher roughness due to lower active friction contact surface. This can also be seen in the resulting wormhole defects.
Key Words : Friction stir welding, Tool design, Surface roughness
ISSN 1225-6153 Online ISSN 2287-8955
40.00 35.00 30.00 25.00 20.00 15.00 10.00 5.00 0.00
Ductility dip Cracking
Solidification:
modeling Lead-free
solder Dissimilar Filler metals Solidification,
stainless steel, steel welds
Weld metals, (alloy) steel Creep, steel(ferrite, heat resistant)
Flux core arc welding
Gas tungsten arc welding
Gas metal arc welding Laser & hybrid welding Resistance spot welding
Fluid flow, heat transfer X-ray diffraction, heat affected zone
Air brazing Transient liquid
Phase bonding Wafer bonding
silicon
Friction welding Hot, affected zone, liquation cracking
Friction stir welding Welding distortion residual stress, finite element method
Papers par unit weighed by centrality
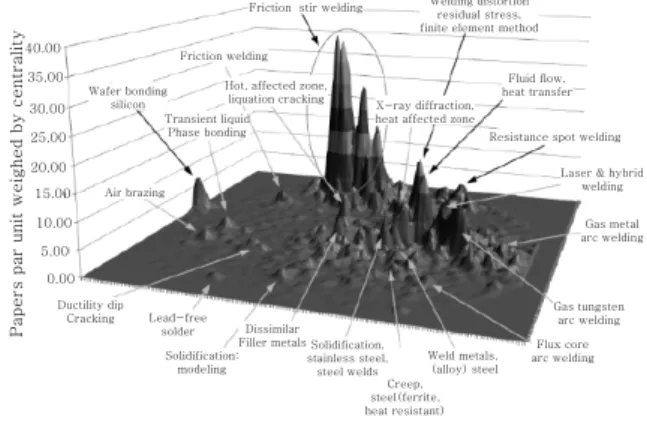
Fig. 1 State of publications in 2011
3)1. Introduction
The friction stir welding is one of the upcoming joining technologies of the new millennium.
Since it was discovered in 1991 by Wayne Thomas at the TWI
1), numerous research projects are engaged in the basics of the pressure welding process. Especially the amount of patents
2)and publications
3)in the area of the friction stir welding reveals the potential of this technology.
Particularly in case of the aluminium materials, the friction stir welding has proven to be a strong alternative. This is due to the fact that a lot of the obstacles like pore formation and the risk of hot cracking, which arise when welding aluminium, are not generated because of the
comparatively low joining temperatures. In addition to that, the existing oxide layers of the aluminium only disturb the process in a minor way compared to fusion welding processes
4). Furthermore, the friction stir welding offers, process related, a
Research Paper
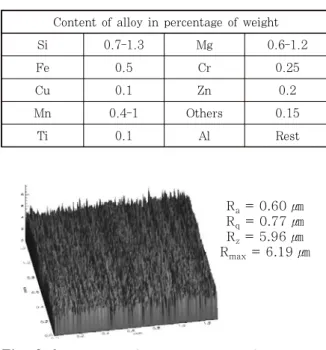
Content of alloy in percentage of weight
Si 0.7-1.3 Mg 0.6-1.2
Fe 0.5 Cr 0.25
Cu 0.1 Zn 0.2
Mn 0.4-1 Others 0.15
Ti 0.1 Al Rest
Content of alloy in percentage of weight
C 1,2 Cr 0,7 V 0,1
R
a= 0.60 ㎛ R
q= 0.77 ㎛ R
z= 5.96 ㎛ R
max= 6.19 ㎛
Fig. 2 3D image of the optical topography measure- ment of a used aluminium sheet
Table 2 Chemical composition of 115CrV3
10)Table 1 Chemical composition of EN-AW 6082
9)good energetic efficiency factor. As the friction
stir welding generates no fumes, dusts or gases and most of the times abstains from the use of additional materials, this process offers a huge potential to cut down welding additives and additional security measures
5).
Numerous examination in the area of the friction stir welding deal with the influences of different parameters on the welding result. Thus, the different tool parameters (amongst others the shoulder diameter and forms; pin diameter, lengths and forms; radii) are as relevant as the different process diameters (amongst others rotations speeds, feed rates, forces, feed speed, dwell times).
Due to a lot of interactions between the parameters, only sporadic examinations of the parameters can be found and only few have been researched in studies. A transmission of the parameters from one to another material is often difficult and most of the times impossible without adapting the parameters.
In 2009, Hatamleh et al. dealt with the rough- ness of resulting friction stir welds and the effects on the characteristics of the welds
6). Arbegas mentionsthe influence of the roughness on the welding process by influencing the friction coefficient and the correlation of cold and hot welding with error emergence
7). An experiment executed by Valentin L. Popov demonstrates how a roughened surface affects its friction coefficient.
In mechanical descriptions, the friction is often related to a roughened surface,and “even” often means frictionless. But if you consider the tri- bological contact of two surfaces, it shows that an especially even surface can have a higher friction coefficient than a rougher one. That means, the frictional force is not directly related to the roughness of a surface. An experiment with the transmission of radioactive elements between to contact partners provides the evidence for this.
In this experiment, a radioactive copper block has been pulled over a copper plate with two different types off roughness
8).
So far, there haven’t been any systematic experi- ments in which the weld quality of the friction stir welding was considered and evaluated depen-
dant on the tool surface. Therefore, the question is if the welding result is related to the surface condition of the used tools, and how future tools need to be constructed with regard to their surface. The examinations shall demonstrate which influence a different roughness of the tools has on the welding result; they shall also show to which extent an improvement of the weld can be reached by inserting defined surfaces.
2. Materials
The experiments were done on aluminium EN- AW 6082 T6 (AlMgSi1) (see Table 1) with the dimensions 165×35×1.5 mm. They have been jointly welded in butt-joint on a length of 100 mm.
It has a shoulder diameter of 10 mm. The pin protrudes 1.2 mm from the shoulder surface and has a medium diameter of 3 mm at the tip.
The conical form with an angle of 20° makes it
easy to plunge into the workpieces that are to
be joined.
Fig. 3 FSW tool and EDM tool
R
a= 0.57 µm R
q= 0.81 µm R
z= 8.04 µm R
t= 13.43 µm
Fig. 4 Result of the roughness measurement of the untreated tool
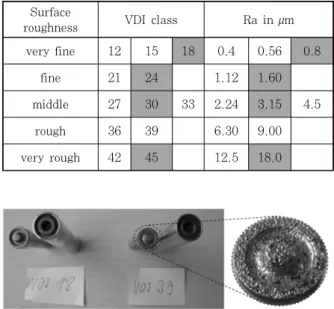
Surface
roughness VDI class Ra in µm
very fine 12 15 18 0.4 0.56 0.8
fine 21 24 1.12 1.60
middle 27 30 33 2.24 3.15 4.5
rough 36 39 6.30 9.00
very rough 42 45 12.5 18.0
Fig. 5 Tools and electrodes after spark discharge Table 3 Comparative table of chosen data (marked
in grey)
3. Method
The roughness is produced by the die sinking on the tool surface. The die sinking proves to be reasonable for this purpose as the geometry of the tool can be completely recorded and the process is controllable and reproducible.
At first, a negative of the tool geometry is con- structed and produced from copper for the roughe- ning, see Fig. 3 on the right side. When eroding, the electrode is moved to the tool and a tension is generated, so that the roughness set in advance is produced due to the spark discharge.
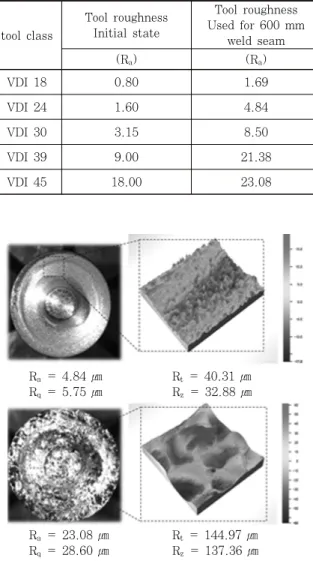
Each of the tools has been produced with the roughness of the Verein Deutscher Ingenieure (VDI) classes VDI 18, VDI 24, VDI 30, VDI 39 und VDI 45 (Table 3). Thus, the differences can be judged step by step. An untreated tool after the turning process is used as a reference (Fig. 4) with a roughness of Ra = 0.57 µm. The comparison of the VDI classes demonstrates that it corresponds to an eroding process of the VDI 15 (Table 3). How-ever, the VDI 18 surface is distinctly defined and, for instance, it does not show first or second order discrepancies which
can be the case with the turned surface.
The results of the roughening process can already be seen optically when looking at the tools (Fig. 5).
As basis of comparison the constant parameters were rotation speed n = 1250 rpm, feed rate f = 250 mm/min, tilt angle α = 1° and a heel plunge depth hdp = 0.15 mm in position controlled mode.
4. Result
Generally, it can be noted that a rougher tool generates a rougher weld surface. Fig. 6 shows details of the welds VDI 24 and VDI 39, each at the start, in the middle and at the end, with the produced negative.
The VDI 24 shows a consistent imbrication of the weld, while samples of the VDI 39 show a very uneven surface, similar to a surface galling defect. Different to the surface galling defect, which results from a hot weld, the high roughness of the tools causes a reduced contact surface;
consequently, it causes a lower frictional heat
input. For this reason, the weld pitch outside
the process window is moved toward the cold
welds; the insufficient plasticisation causes the
shearing of the joining material on the surface
of the weld and of the tool, and it results in
Start of seam
Middle of seam
End of seam
Fig. 6 Welds with VDI 24 (Left) and VDI 39 (Right)
Finest resulting
weld surface
VDI 18
(
*) VDI 24 VDI 30 VDI 39 VDI 45
Roughest resulting
weld surface
Fig. 7 Imbrication of the weld due to different tool roughness
270
265
260
255
250
245
240
235
230
225
220
2.8 3 3.2 3.4 3.6 3.8 4
Elongation [mm]
Ten s ile s tre ngth [N/m m
2]
VDI45
VDI39 VDI24
VDI30 VDI18
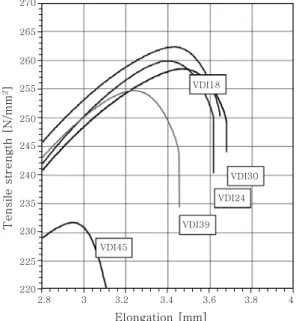
Fig. 8 Stress-strain diagram on welds with different roughness classes
deposits/sediments of aluminium particles on the tool surface.
The weld surface, which was optically the most even, was produced with tools of the roughness VDI 18, which is the finest surface. No difference could be found between these VDI 18 welds and those welds which were produced with untreated tools. The imbrications on the weld surface con-
tinually increased from the even to the rough samples, due to the different roughness, see Fig. 7.
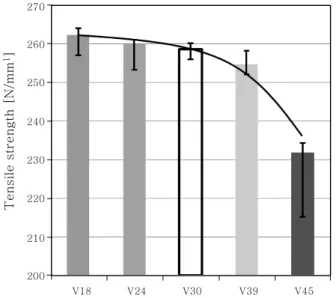
The irregularities on the weld surfaces caused by rougher tool structures are also reflected in the tensile strength. The resulting defects, which are similar to the surface galling defects, considerable reduce the quality of welding (Fig.
8, Fig. 9). The fracture position of the samples shifts to the weld centre/middle and the maximum elongations are reduced. Each of the samples welded with the VDI 45 tool broke at the weld centre/middle (Fig. 10). The high discrepancy between minima and maxima is remarkable in the tensile tests of the VDI 45.
Additionally to the turbulent streams of the
270
260
250
240
230
220
210
200
V18 V24 V30 V39 V45
Ten s ile s tren gt h [N/m m
1]
Fig. 9 Tensile strength of the tensile tests with minima and maxima on welds with different roughness classes
V18
V24
V30
V45
0% 20% 40% 60% 80% 100%
Fracture in the middle of weld in % of all specimen Fig. 10 Examination of the fracture positions of
different roughness classes
VDI 18 VDI 45 350
300
250
200
150
100
50
0
Shoulder Tool Weld