Relationship between Rainfall Intensity and Shear Strength of Slope
사면의 전단강도와 강우강도와의 상관관계
Lee, Jungsik1) ・ Han, Heuisoo† ・ Jang, Jinuk2) ・ Yang, Namyong2) 이 정 식 ・ 한 희 수 ・ 장 진 욱 ・ 양 남 용
ABSTRACT : The unsaturated slope usually is stable for a long time, but fails during heavy rainfall. And the factors of the rainfall intensity exhibit significant roles because the water content and the shear stress developed along the potential failure surface will be changed by the rainfall intensity. The objective of the study presented in this paper is to analyze the relationship between rainfall intensity and shear stress of the soil slopes by applying the laboratory slope model apparatus and undrained direct shear test with rainfall intensity controlled. The soil sample was taken from the field slope of Youngdong, and particle size analysis was done. To look over the relationship between rainfall intensity and shear strength of slope, the three-dimensional relationships among shear strength, normal stress and water content of the slope soil samples are examined; those are based on the data from the TDR sensor and undrained direct shear test.
Keywords : Rainfall intensity, Slope failure, Water content, Undrained direct shear test
요 지 : 일반적으로 강우는 사면의 전단강도와 전단응력 변화에 의한 사면붕괴를 유발하므로 강우강도와 전단강도의 변화는 사면 안정해석시 매우 중요한 요소이다. 다양한 강우강도가 사면내의 함수비 변화차이를 유발할 뿐만 아니라, 사면 내 지반의 점착력 및 마찰력의 변화를 유발한다. 본 연구의 목적은 강우재현 실험장치를 이용하여, 강우강도와 사면의 전단강도의 관계를 규명하는 것이다. 사용된 토양은 국내의 사면에서 채취한 것으로 입도분석을 실시하였으며, 종래의 함수비 측정방법 대신 TDR 센서를 사용 하여 함수비를 측정하였고, 전단강도 측정을 위해 비배수 직접전단시험을 하였다. 본 연구에서의 결과를 정리하면 첫째, 함수비는 토양의 투수성과 밀접한 관계를 가지며, 강우지속기간은 토양함수비를 결정하는데 중요한 요소이다. 둘째, 강우재현 실험장치를 이용한 안정성 분석은 사면에서의 함수비와 전단응력의 측정이 가능하여, 매우 유용한 사면해석방법이다. 셋째, 함수비와 관련된 비배수 전단응력식을 제시하였으며, 제시한 식은 기존 연구와 비교하여 보다 간편한 것으로 나타났다.
주요어 : 강우강도, 사면붕괴, 함수비, 비배수 직접전단시험
1) Regular menber, Professor, School of Civil and Environmental Engineering, Kumoh National Institute of Technology 한국지반환경공학회 논문집
제11권 제2호 2010년 2월 pp. 13~21
1. Introduction
A large number of slopes usually remain stable for a long time and then fail during heavy rainfall. In many cases, these failures cause losses of life and economic. Slope stability analysis of unsaturated slopes requires an extensive and detailed seepage analysis, because slope failures in unsaturated condition are closely related to heavy rainfall and infiltration. The mechanism leading to slope failures is the negative pore-water pressures variation, in other words, the apparent cohesion will increase when water starts to infiltrate into the unsatu- rated soil (Duncan and Wright, 1976; Fredlund and Rahardjo, 1993; Fakher et. al., 1999; Pathma et. al., 2006).
Infiltration modeling of unsaturated soil slopes is a difficult
task because infiltration is controlled by many factors. Field observations show that rainfall intensity and antecedent rainfall over a period of time prior to the major rainfall event can very often affect directly to the stability of unsaturated soil slopes (Lim et. al., 1996; Fredlund and Rahardjo, 1993).
However, after studying the relation between rainfall and slope failures in Hong Kong, it was concluded that antecedent rainfall is not a significant factor for inducing slope failures as long as the major rainfall event is a high intensity (Fredlund, 1981), also those research results could be appro- priate to the area in South Korea.
The main contents of this study at first are the laboratory slope model apparatus that contains controlling rainfall intensity and slope model parts to simulate the natural slope. In addition,
1
4
3 2
Fig. 1. Laboratory slope model apparatus
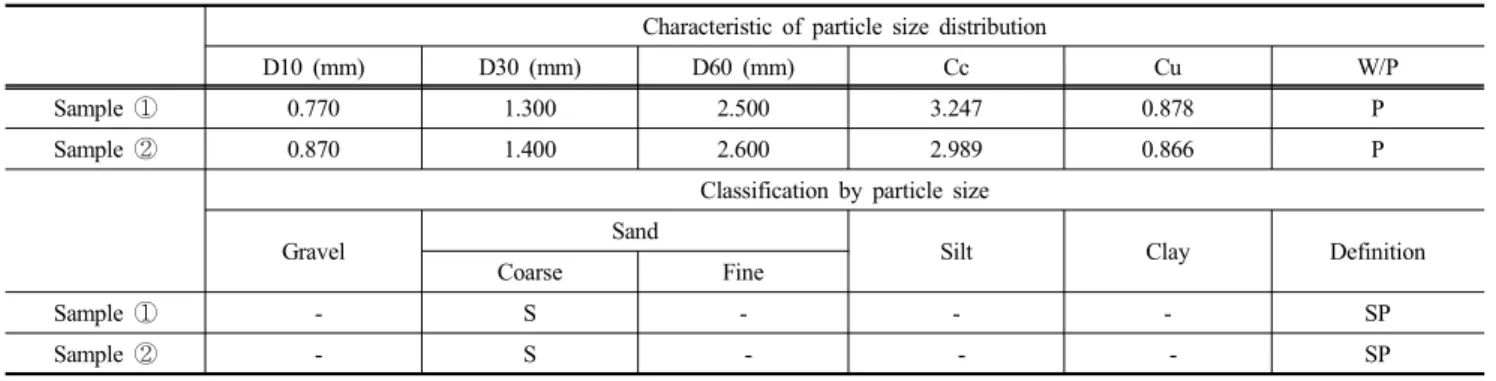
Table 1. The definition of the subjected soil
Characteristic of particle size distribution
D10 (mm) D30 (mm) D60 (mm) Cc Cu W/P
Sample ① 0.770 1.300 2.500 3.247 0.878 P
Sample ② 0.870 1.400 2.600 2.989 0.866 P
Classification by particle size
Gravel Sand
Silt Clay Definition
Coarse Fine
Sample ① - S - - - SP
Sample ② - S - - - SP
Fig. 2. The particle size distribution curve of the subjected soil the undrained direct shear test was applied to measure the
shear stress of the soil samples taken from the laboratory slope models. Finally, the relationship between rainfall intensity and shear stress of soil slopes was analyzed.
2. Laboratory slope model apparatus
Recently, many geotechnical engineers focus on studying the effects of hysteresis on steady-state infiltration in unsatu- rated slopes by applying laboratory slope model. The slope model apparatus is made to simplify the complex behaviors of the relationship between rainfall intensity and shear strength of the natural unsaturated soil slopes. Generally, there are two parts: one part is designed model slope, and the other is rainfall intensity control system.
Figure 1 shows the laboratory slope model apparatus. The water flow parts and nozzles are shown from Figure 1, which are used to make the rainfall, and they are controlled by part ③, which is water flow meter. They are the parts of the controlling rainfall intensity. The part ④ is the model slope, and part ② is the control box for the model slope.
2.1 Soil classification
In this study, the soil of the laboratory model slope was taken from the natural slopes of Youngdonggun, South Korea.
The sieve analysis of ASTM Test Designation D22 was applied and two soil samples were taken. The Figure 2 shows the graphs of the particle size distributions of two soil samples by sieve analysis. And the Table 1 shows the characteristics of the soil samples which are induced from the Figure 2. According to Table 1, the soil is defined as poorly graded sandy soil.
2.2 Design of the model slope
The model slope used in this study has 42 cm hight and 45° inclination (inclination ). The slope geometry was presented in Figure 3. It is assumed that the slope was composed of homogeneous and residual soil, because the sample soil is taken after sieve analysis.
Moreover, the soil was compacted to avoid the crack in the soil surface. Table 2 shows the types of the compaction test of the Korea Geotechnical Society (KS F 2312). The types of C, D and E are appropriate to represent the natural soil, however, type C was applied in order to simply the
Table 3. Kinds of rainfall intensity
No. Rainfall intensity
Intensity Duration Notes
Exp.1 60 mm/hr 20 min Equals to Moderate rainfall in South Korea Exp.2 60 mm/hr 40 min Equals to Mid-Heavy rainfall in South Korea Exp.3 60 mm/hr 60 min Equals to Heavy rainfall in South Korea Table 2. Types of compaction test
Type The weight
of rammer (kg)
The diameter of mould (cm)
The number of compaction layer
The height of every layer
A 2.5 10 3 25
B 2.5 15 3 55
C 4.5 10 5 25
D 4.5 15 5 55
E 4.5 15 5 92
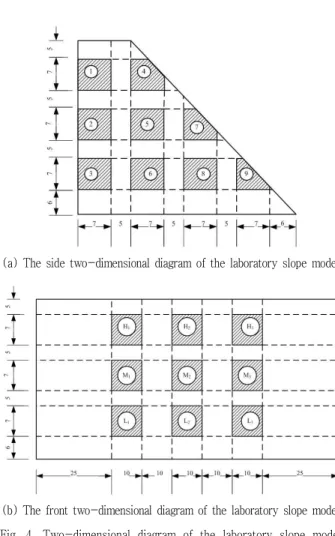
(a) The side two-dimensional diagram of the laboratory slope model
(b) The front two-dimensional diagram of the laboratory slope model Fig. 4. Two-dimensional diagram of the laboratory slope model
(unit:cm) Fig. 3. The laboratory slope model
compaction test.
The rammer compaction area of the type C is as follows:
× × ㎝
In our laboratory apparatus, the weight of rammer is 10 kg and the compaction area is 174.44 cm2 as following equation, and the falling heights of the rammers are same.
4.5kg : 10 kg = 78.5 cm2 : , and 174.44 cm2
2.3 Design of rainfall distribution
The antecedent rainfall is a significant factor for inducing slope failures in the subjected area, which is related to the inherent water content of soil. In addition, the behavior of rainfall contains two important parameters—the intensity and duration of rainfall—for analyzing the slope stability. How- ever, the rainfall duration is more important compared to the rainfall intensity, because water penetration into slope is mostly related to the soil permeability.
In this study, therefore the rainfall duration has been considered as important factor to research the stability of unsaturated slope during rainfall. In Table 3, it was observed
that three kinds of the rainfall duration were designed to represent natural rainfall in South Korea.
2.4 Soil samples
After rainfall, some soil samples were taken from different vertical and horizontal places of model slope as shown in
Fig. 5. TDR sensor
Table 4. Water content of slope soil samples
Water content of 9 location soil samples (%)
① ② ③ ④ ⑤ ⑥ ⑦ ⑧ ⑨
EXP.1
(60 mm/hr × 20 min) 21.03 3.07 3.92 24.90 8.43 4.38 25.55 7.91 25.37
EXP.2
(60 mm/hr × 40 min) 19.83 8.44 5.03 23.36 14.41 6.71 23.70 20.71 23.31
EXP.3
(60 mm/hr × 60 min) 18.37 17.10 12.03 22.03 19.10 13.63 20.44 19.20 21.01
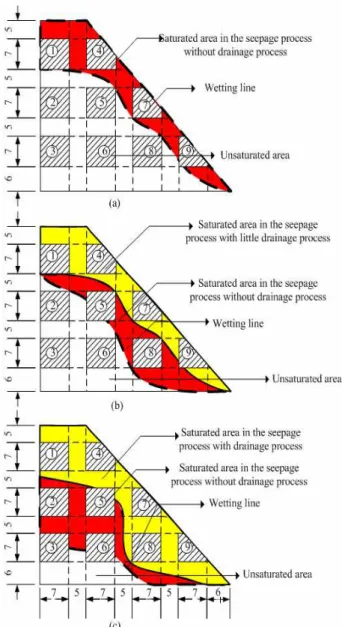
Fig. 6. Rainfall infiltration in the unsaturated laboratory model slope (unit:cm)
(a) Rainfall intensity is 60 mm/hr × 20 min; (b) Rainfall intensity is 60 mm/hr × 40 min; (c) Rainfall intensity is 60 mm/hr × 60 min
Figure 4 to analyze the failure surface of slope. Figure 4 (b) shows the 3 groups of soil sampling places; every group contains 9 soil sampling places as shown in Figure 4 (a).
They were taken carefully and undrained direct shear tests were done with different normal stresses.
3. Water content of the soil samples
3.1 Water content by TDR sensor
In this study, TDR sensor is used to measure the water content of each soil sample. This TDR sensor reads and stores the measured volumetric soil water content. In Figure 5, it shows how to measure the water content of a certain soil sample.
Table 4 shows the average values of the water content of the subjected soil samples from model slope. This water content test should be done as early as possible after taking soil samples from model slope to assure the accuracy of obtained data.
From Table 4, It can be observed that the water contents of the samples ①, ④, ⑦ and ⑨ always keep higher, i.e., these upper located soils are saturated after experimental rainfalls. However, Table 4 also shows that the water contents of the samples ②, ③, ⑤ and ⑧ are changed so much with the rainfall duration because of the time-related per- meability coefficient.
3.2 Infiltration with depth
The wetting lines of slope model could be induced from the water content of soil samples and analyzed, Figure 6 shows the wetting lines made by different rainfall durations
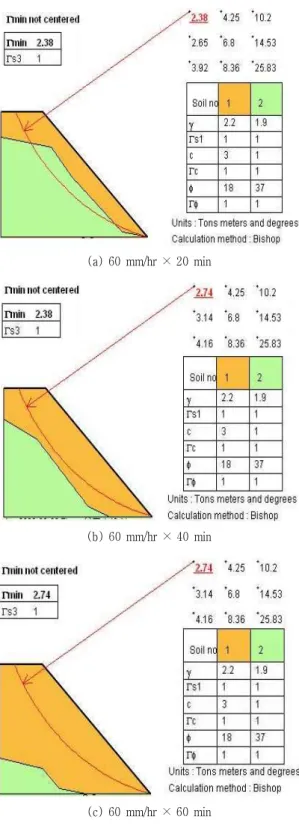
(a) 60 mm/hr × 20 min
(b) 60 mm/hr × 40 min
(c) 60 mm/hr × 60 min
Fig. 7. Failure surface of slope model according to rainfall intensity
Fig. 8. Drained and undrained strength envelopes for partly saturated clay
according to Table 4. And the experimental slope is separated as three layers for this research.
The soil samples ①, ④, ⑦ and ⑨ are located at the first layer of this model slope in the vertical direction, as shown in Figure 6 (a). In addition, these soil samples always were retained the higher water contents as shown in Table 4 and this layer of model slope has become saturated after
20min rainfall.
The soil samples ②, ⑤ and ⑧ were treated as the second layer of the model slope, this layer was partly saturated when rainfall duration is 40min, but the soil sample ⑧ had been completely saturated.
The soil samples ③ and ⑥ were studied together due to their same vertical locations. For three experiments, the soil samples of third layer were always kept unsaturated condition.
4. Analysis of the shear stress of the soil specimens
4.1 Failure surface by slope model
The objective of this study is to clarify the relationship between rainfall intensity and shear stress of slope soils, which can be obtained by doing direct shear test. Fig. 7 displays the failure surfaces analyzed by commercial program (TARLEN) according to infiltration into model slope, which is crossed through ④, ⑤, ⑦ and ⑨ of Fig. 6.
The change of shear strength of the soil sample is related to the water content. In this study, the undrained shear strength envelope was not horizontal as shown in Figure 8, because the cohesion and internal friction angle will be changed by the water content in soil. In addition, the normal stress is changed by the pore pressure variation, which is the function of water content. Therefore, to study the cha- racteristic of undrained shear stress, water content and normal stress should be analyzed together.
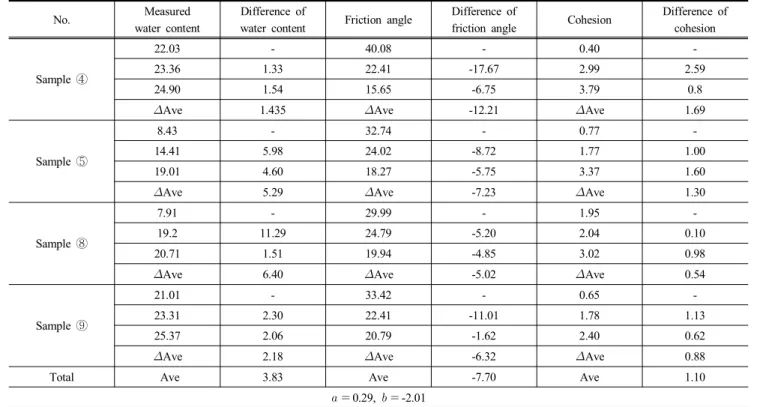
The equation (1) and (2) exhibit the changes of cohesion
Table 5. Coefficients related to water content
No. Measured
water content
Difference of
water content Friction angle Difference of
friction angle Cohesion Difference of cohesion
Sample ④
22.03 - 40.08 - 0.40 -
23.36 1.33 22.41 -17.67 2.99 2.59
24.90 1.54 15.65 -6.75 3.79 0.8
Ave 1.435 Ave -12.21 Ave 1.69
Sample ⑤
8.43 - 32.74 - 0.77 -
14.41 5.98 24.02 -8.72 1.77 1.00
19.01 4.60 18.27 -5.75 3.37 1.60
Ave 5.29 Ave -7.23 Ave 1.30
Sample ⑧
7.91 - 29.99 - 1.95 -
19.2 11.29 24.79 -5.20 2.04 0.10
20.71 1.51 19.94 -4.85 3.02 0.98
Ave 6.40 Ave -5.02 Ave 0.54
Sample ⑨
21.01 - 33.42 - 0.65 -
23.31 2.30 22.41 -11.01 1.78 1.13
25.37 2.06 20.79 -1.62 2.40 0.62
Ave 2.18 Ave -6.32 Ave 0.88
Total Ave 3.83 Ave -7.70 Ave 1.10
0.29, -2.01 and friction angle by water content.
′ (1)
′ (2)
The equation (3) and (4) show the normal stress and shear stress changes by water content.
′ (3)
′ tan ′ (4)
Therefore, the cohesion, internal friction angle and pore water pressure could be applied as variables instead of integers if the water content changes. The cohesion increases and the internal friction angle decreases due to increasing water content as shown in Fig. 8 and Eq. (5) and (6).
(5)
(6)
In addition, when the normal stress of slope failure surface changes with the infiltration, the pore water pressure increases and the effective normal stress decreases as the water content increases. To express the shear strength of unsaturated soil, all related items were treated as variables as shown in Eq.
(7), and it can be expressed as terms of water content in Eq. (8).
′ tan (7)
′ tan (8)
where and are experimental coefficients.
Table 5 shows the calculated coefficients, and , related to the water content of soil from experiments. The unsaturated shear strength of the model slope can be expressed as Eq. (9).
′ tan (9)
The overburden normal pressure is expressed as follows.
(10a)
(10b)
where is the unit weight of unsaturated soil, is the degree of saturation, is the specific gravity, is the void ratio, and is the unit weight of water.
Furthermore, water content changes as terms of saturation degree.
(11a)
Fig. 9. Three-dimensional figures related to water content variation
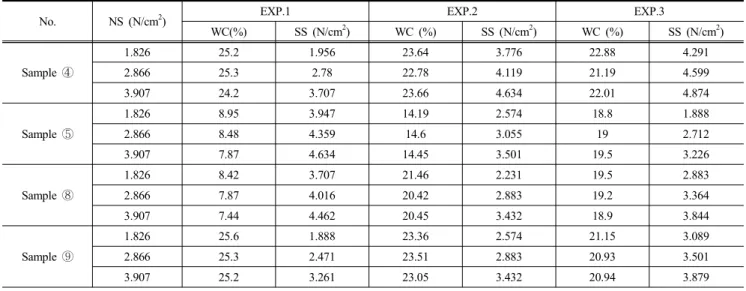
Table 6. The data of three-dimensional figures of analyzed failure surface
No. NS (N/cm2) EXP.1 EXP.2 EXP.3
WC(%) SS (N/cm2) WC (%) SS (N/cm2) WC (%) SS (N/cm2)
Sample ④
1.826 25.2 1.956 23.64 3.776 22.88 4.291
2.866 25.3 2.78 22.78 4.119 21.19 4.599
3.907 24.2 3.707 23.66 4.634 22.01 4.874
Sample ⑤
1.826 8.95 3.947 14.19 2.574 18.8 1.888
2.866 8.48 4.359 14.6 3.055 19 2.712
3.907 7.87 4.634 14.45 3.501 19.5 3.226
Sample ⑧
1.826 8.42 3.707 21.46 2.231 19.5 2.883
2.866 7.87 4.016 20.42 2.883 19.2 3.364
3.907 7.44 4.462 20.45 3.432 18.9 3.844
Sample ⑨
1.826 25.6 1.888 23.36 2.574 21.15 3.089
2.866 25.3 2.471 23.51 2.883 20.93 3.501
3.907 25.2 3.261 23.05 3.432 20.94 3.879
Note: NS=Normal Stress; WC=Water Content; SS=Shear Strength
′
tan′
(11b)
Fredlund formulated the shear strength of an unsaturated soil in terms of independent stress state variables (Fredlund et.al., 1993), which is Eq. (12).
′ tan′ tan (12)
where is the net normal stress state on the failure plane at failure, is the pore-air pressure on the failure plane at failure, is the matric suction on the failure plane at failure, and tan is the angle indicating the rate of increase in shear strength related to the matric suction
Fredlund’s equation should find , , and to estimate the undrained shear strength, because he treated ′ and ′ as constants, and the effects of water content are consisted of , , and .
However the revised Eq. (8) is consisted of all variable terms which related to water content, therefore if water content
and pore pressure were known, the unsaturated shear strength could be estimated. If the revised equation is used to esti- mate the undrained shear strength, more simple tests are needed compared to those of Fredlund’s equations, they are the direct shear test, water content and pore pressure for it.
4.2 Three-dimensional analysis of shear stress
Figure 9 shows the three-dimensional figures to analyze the relationships among the shear stress, water content and normal stress at the same time, which are the variables to calculate the undrained shear strength if rainfall penetration occurs. Three-dimensional figures were made of shear strength vs. normal stress plane (constant water content), normal stress vs. water content plane (unit weight variation) and shear strength vs. water content plane (constant normal stress).
Theoretically, the higher water content of soil can provide the lower shear stress. And, the higher normal stress will show the higher value of shear stress.
The experimental values were plotted as shown in Fig.
(a) Soil sample ④ (b) Soil sample ⑤
(c) Soil sample ⑧ (d) Soil sample ⑨
Fig. 10. Three-dimensional figures from experiments
10 according to the system of Fig. 9. Figures 10 (a)~(d) show the three-dimensional figures of four soil samples (④,
⑤, ⑧, and ⑨) acquired from the three different rainfall duration experiments, and these three dimensional figures are based on Table 6. Please refer Fig. 6 and 7 to find the sampling points, which are located in failure surface analyzed.
In addition, the data of cohesion and friction angle of all samples from three experiments were obtained by spread sheet, the results of which can be seen in Figure 10.
Because the soil samples from experiments were located in failure surface and saturated, each sample exhibited not so much different to consider. However, the shear stresses increase according to the water contents decrease, although these phenomena were not perfectly clear because of time delay to finish the experiments for 27 samples within a short period, that made some difficulties to perform measuring water content and undrained shear test at the same time.
Therefore some water in the soil were evaporated and water content decreased.
5. Conclusions
The main conclusions obtained from this research are summarized as follows:
(1) After rainfall, the water content ratio (water weight/soil solid weight) is dependent on the permeability of the soil; even though the large amount of the rainfall is drained to the slope surface, the amount of ground water is constrained by permeability. Therefore rainfall duration is the most important factor to determine the water content of soil.
(2) The total stress analysis of the slope stability was applied for the study, in other words, undrained direct shear test is used to measure the shear stress of soil samples.
Furthermore, water content and normal stress variation were analyzed together to study the characteristic of undrained shear stress. The revised equation was suggested to estimate the unsaturated shear strength, which equation
was consisted of all variable terms related to water content.
The revised equation needs more simple tests compared to those of Fredlund's equations.
(3) Because the water contents as well as normal stress affect the shear strength of soil simultaneously, three dimensional analysis considering both terms could be used to make the relationship among the shear strength, water content and normal stress.
(4) The wetting lines of the experiments had been made according to the water content of soil samples. They could be used to determine the degree of saturation and the amount of ground water from a hydrological point of view.
Acknowledgement
This paper was supported by Research Fund from Kumoh National Institute of Technology. The authors would like to thank for it.
References
1. Duncan, J.M. and Wright, S.G. (1976), Soil Strength and Slope Stability, John Wiley & Sons, New York, pp. 120~125.
2. Fakher, A., Jones, C.J.F.P. and Clarke, B.G. (1999), Yield Stress of Super Soft Clays, Journal of Geotechnical and Geo- environmental Engineering, ASCE, Vol. 125, No. 6, pp. 499~
509.
3. Fredlund, D.G. (1981), The Shear Strength of Unsaturated Soil and its Relationship to Slope Stability Problems in Hong Kong, The Hong Kong Engineer, Vol. 9, No. 4. pp. 435~
443.
4. Fredlund, D.G. and Rahardjo, H. (1993), Soil Mechanics for Unsaturated Soils, John Wiley & Sons, New York, pp. 137~
146.
5. Korea Geotechnical Society (2006), KS F 2312.
6. Lim, T.T., Rahardjo, H., Chang, M.F. and Fredlund, D.G.
(1996), Effects of Rainfall on Matric Suctions in a Residual Soil Slope, Canadian Geotech. J., Vol. 33, No. 6, pp. 618~
628.
7. Pathma, C., Gallage, K. and Uchimura, T. (2006), Effects of Wetting and Drying on the Unsaturated Shear Strength of Silty Sand Under Low Suction, The Fourth International Conference on Unsaturated Soils, April 2-6, 2006, Carefree, Arizona, USA.
(접수일: 2009. 9. 25 심사일: 2009. 9. 30 심사완료일: 2010. 1. 7)