Head and Neck Vascular Lesions:
Characterization of the Flow Pattern by the Use of Three-Phase CT
Objective: This study was designed to evaluate the usefulness of three-phase CT to characterize the hemodynamics of vascular lesions in the head and neck area.
Materials and Methods: We analyzed vascular malformations of head and neck regions in 21 patients with the use of three-phase CT, including pre-contrast phase, vascular phase (scan delay: 20-35 seconds after intravenous contrast material injection) and equilibrium phase (scan delay: 3-5 minutes) imaging. The flow characteristic of each lesion was determined and categorized as either a high- or a low-flow lesion according to findings on selective arteriography and/or direct puncture venography. The CT number was acquired from two areas in a vascular lesion, sorted by the enhancement pattern: area 1, a highly enhanced area seen on the vascular phase; area 2, a delayedly enhanced area seen on the equilibrium phase. The CT numbers of each phase were compared between high- and low- flow lesions with use of the unpaired t-test. The flow patterns of high- and low-flow lesions were analyzed by assessment of time-density curves of three phase CT.
Results: High-flow lesions were detected in nine patients and low-flow lesions were detected in 12 patients. On the vascular phase, the CT number of areas 1 and 2 of high-flow lesions was significantly higher than for low-flow lesions (p <
0.05). Contrary to early peaks seen in time-density curves of high-flow lesions, low-flow lesions showed a delayed peak.
Conclusion: Three-phase CT seems to be a valuable non-invasive method to differentiate a high-flow lesion from a low flow lesion of head and neck vascular lesions.
he classification of vascular lesions has been confused by the large number of descriptive and histological terms that have been used in the literature. Since Mulliken and Glowacki (1) introduced in 1982 a new classification of vascular birthmarks based on the clinical and histological characteris- tics of these lesions, two categories have been used to classify these malformations caused by hemangiomas and vascular malformations.
In order to select the optimal form and time of treatment, vascular anomalies are classified according to the vascular dynamics of a lesion as high- or low-flow lesions (2). These radiological terms indicate the speed of flow through the lesion and the rate of shunting between the arterial and venous components. Based on the flow dynamics, high-flow vascular lesions can include hemangiomas and arteriovenous malformations.
Low-flow lesions include most venous malformations (3). However, some types of vascular malformation can have mixed components of high- and low-flow lesions, which sometimes make correct diagnosis and management difficult. The distinction is Chang-Woo Ryu, MD1
Jae Kyun Kim, MD2 Sang Joon Kim, MD3 Jeong Hyun Lee, MD3 Jeoung Hyun Kim, MD3 Hong Il Ha, MD3 Dae Chul Suh, MD3
Index terms : Head and neck
Arteriovenous malformation Three-phase CT
DOI:10.3348/kjr.2009.10.4.323
Korean J Radiol 2009;10:323-332 Received August 19, 2008; accepted after revision March 2, 2009.
1Department of Radiology, East-West Neomedical Center, Kyung Hee University, College of Medicine, Seoul 134-090, Korea; 2Department of Radiology, Seoul Veterans Hospital, Seoul 134-791, Korea; 3Department of Radiology and Research Institute of Radiology, University of Ulsan, College of Medicine, Asan Medical Center, Seoul 138-736, Korea
Address reprint requests to : Dae Chul Suh, MD, Department of Radiology, Asan Medical Center, University of Ulsan, College of Medicine, 388-1 Pungnap2-dong, Songpa-gu, Seoul 138-736, Korea.
Tel. (822) 3010-4366 Fax. (822) 476-0090 e-mail: [email protected]
T
clinically significant as high-flow lesions are predisposed for spontaneous and intraoperative hemorrhage, have higher recurrence rates, and often involve and destroy bone and may therefore require transarterial embolization (4, 5).
As the performance of spiral CT scanning has dramati- cally improved the scanning repetition rate, multiphase CT is a helpful diagnostic tool that has been widely used to characterize the hemodynamics of hepatic masses or vascular lesions (6-8). In the head and neck area, however, little is known about the diagnostic value of the use of multiphase CT for vascular lesions. We hypothesize that multiphase CT is useful to distinguish high- from low-flow lesions in vascular lesions of the head and neck area.
To determine whether three-phase CT is able to distin- guish high- from low-flow vascular lesions, we evaluated vascular lesions in the head and neck using three-phase CT consisting of pre-contrast, vascular (early) and equilibrium (delayed) phase scanning.
MATERIALS AND METHODS
Subjects
The study was performed according to the ethical standards of the Institutional Review Board, and informed consent was obtained from each patient.
Three-phase CT was selectively performed in 33 consec- utive patients with a clinical diagnosis of a head and neck vascular lesion who met the following criteria. 1) Subjects included referred patients who were clinically suspected of having a high-flow vascular lesion due to the presence of a pulsatile and compressible mass and patients with a known vascular malformation detected on previous surgery. 2) Subjects included patients who had a head or neck mass who were referred for evaluation of the vascularity of the mass. 3) Subjects included patients who were referred with a clinically suspected venous malformation due to the presence of a compressible, soft mass that enlarged during the Valsalva maneuver or patients with a residual vascular malformation despite surgical resection or ethanol sclerotherapy.
This study included only patients who had been finally diagnosed with vascular lesions based on clinical and radiological evaluations, i.e. clinical presentation and a physical examination in addition to selective arteriogram and/or direct puncture venogram findings and/or from a pathology specimen. Although three-phase CT images were obtained in 33 patients, 12 were excluded from the study. The excluded patients included nine patients with plexiform neurofibromatosis; one patient with a
hemangiopericytoma, one patient with a pseudoaneurysm;
and one patient where the arterial phase images were lost.
The final subjects of this study included 21 patients (eight men and 13 women; age range, 6-55 years; mean age, 22.5 years).
Three-Phase CT
All CT examinations were performed with the helical axial acquisition technique using a spiral CT scanner. The CT scans were planned to cover the entire palpable mass with a 2-3 cm margin of normal tissue. The CT images were reconstructed as axial slices with a 5-mm thickness without an interslice gap. After obtaining pre-contrast CT images, vascular-phase CT acquisition was started within 20-35 seconds after the beginning of contrast media injection (20 seconds was applied to children and 35 seconds was applied to adolescents and adults). A contrast medium bolus was injected by the use of a power injector.
Non-ionic iodinated contrast media (2 ml/kg or 80-90 ml of contrast medium, whichever was less) was injected at a rate of 3 ml/sec in most adult patients and at a rate of 2 ml/sec in children. After vascular-phase CT acquisition, equilibrium phase CT scanning was obtained 3 minutes later.
Imaging Analysis
Two neuroradiologists reviewed the three-phase CT images. The neuroradiologists examined the images together, blinded to patient name and diagnosis, and then reached consensus in cases of disagreement. Dense enhancement was defined as areas within a tumor that showed higher enhancement than on any other tumor portion and was greater than 120 HU on vascular-phase CT images. The size and shape of dense enhancement areas were determined and were documented in each case.
The size of dense enhancement was classified as small (less than 1 cm), moderate (1-2 cm) and large (greater than 2 cm) according to the maximum transverse diameter.
The CT number was measured from two areas in a vascular lesion, which was sorted by the enhancement pattern. Dense enhancement as seen on the vascular phase was designated as area 1. When dense enhancement was not demonstrated on the vascular phase, an area that showed a relatively higher attenuation than another portion of the vascular mass was considered as area 1. An area with delayed enhancement on equilibrium-phase CT or an area with the least enhancement in a vascular lesion as seen on vascular-phase CT was designated as area 2.
The CT number was measured on the same areas of the pre-contrast, vascular and equilibrium phases. In order to measure CT density, a round region of interest (ROI) with variable size capability according to the size of the enhanc-
ing area was placed at the same level of the lesion in all three phases. The ROI was selected when the cursor was not affected by partial volume averaging or by a beam- hardening artifact. A time density curve for areas 1 and 2 was acquired from the data that was used to measure the CT number.
The subjects were classified as having high- and low-flow lesions based on arteriogram and/or direct puncture venogram findings. A transfemoral selective arteriogram and/or a direct puncture venogram were obtained in all 21 patients. An arteriogram was obtained for 12 patients, a venogram was obtained for 15 patients and both images were obtained for six patients. A lesion showing an arteri- ovenous shunt, enlarged feeding artery, and rapid wash- out contrast without pooling of contrast media on a direct puncture venogram was defined as a high-flow lesion. A
large, dilated venous sac showing contrast pooling with or without normal draining was defined as a low-flow lesion.
For analysis of the enhancing pattern of the vascular lesions, a “filling-in ratio” and “wash-out ratio” of areas 1 and 2 were determined for the vascular lesions using the CT numbers in each phase. These values were calculated using following equation:
[1] Filling-in ratio = (Vd- Pd) / Pd [2] Wash-out ratio = (Vd- Ed) / Ed
Pd, Vd, and Edare the CT numbers of the pre-contrast, vascular and equilibrium phases, respectively.
The pattern of the time density curves of area 1 and 2 were analyzed. According to the degree of elevation of the CT number, the slope of the pre-contrast to vascular phase was classified as rapid (filling-in ratio > 1.0) and slow filling-in (filling-in ratio < 1.0). According to the degree of
A B C
Fig. 1. Imaging findings for 32-year-old male with arteriovenous malformation in right cheek (patient 5) are presented.
Pre-contrast (A), vascular (B) and equilibrium phase (C) CT images are shown. Focal areas of dense enhance- ment (arrow in B) are noted within lesion, but these areas were not differ- entiated from other areas of lesion as seen on equilibrium phase CT images (C). Focal, dense enhancement pattern corresponded to high-flow vascular lesion as seen on angiograms (D, E).
Surgical resection after transarterial embolization revealed pathologically presence of arteriovenous malformation.
C D
Table 1. Summary of Clinical and Radiological Findings and CT Numbers of Areas 1 and 2 in Each CT Phase of Vascular Lesions in Head and Neck Shape and Size Direct Presence CT Density CaseSex/Presenting of Densely Arteriographic Puncture of High No.AgeDiagnosisDSA ProblemManagementLocation Enhancing Area Findings Venographic FlowArea 1Area 2 on FindingsPcVaEqPcVaEq 1F/24AVMASlowly growing Embolization with L chinMultiple, Enlarged facial NDY5526010757179104 pulsatile mass PVA particles and round, artery, rapid AV after excision of OPsmallshunt and enlarged bean sized mass draining vein 3 years prior 2F/29AVMAKnown AVM in Embolization with L earIrregular, Enlarged posterior NDY4720597358477 left earPVA particles moderateauricular artery with and OPrapid venous filling 3M/29AVMARegrowth of Embolization with R upper Multiple, Enlarged bilateral NDY6125614051140142 AVM after PVA particles lipirregular,facial and infraorbital excisionand OPlarge artery with rapid venous filling 4F/55AVMASlowly growing OPR cheek Multiple, Enlarged posterior NDY62284159498298 massand eartubular and auricular artery with round, largeenlarged draining vein 5M/32AVMAPurplish color Embolization with R cheekIrregular, Transverse facial artery NDY14236101192864 change of right PVA particles largeand superficial temporal cheek since birth& OPartery with rapid venous filling 6F/16HemangiomaA & VOccipital scalp OPR scalpMultiple, Hypervascular contrast Enlarged Y7328114867178132 mass since birthirregular, pooling without AV irregular venous smallshunt. Enlarged sac with stasis transverse facial artery of contrast with rapid filling of venous sac that showed persistent stasis 7F/28HemangiomaA & VSudden increase Embolization R masseterSingle, Enlarged transverse Large irregular Y4626781516279 of previous with irregular, facial artery with rapid venous sac with excised known PVA particleslargefilling of venous sac faint normal vascular massthat showed persistent venous drainage stasis 8F/23HemangiomaARapid swelling Embolization L scalpSingle,Hypervascular arterial NDN66152135535577 after aspiration of with small staining with faint bean sized soft gluenormal venous massdrainage 9F/6HemangiomaVIncrease of SclerotherapyR cheekMultiple, NDEnlarged irregularY4221512962105217 previously known irregular, venous sac with vascular masssmalldilated draining vein
Table 1. Summary of Clinical and Radiological Findings and CT Numbers of Areas 1 and 2 in Each CT Phase of Vascular Lesions in Head and Neck Shape and Size Direct Presence CT Density CaseSex/Presenting of Densely Arteriographic Puncture of High No.AgeDiagnosisDSA ProblemManagementLocation Enhancing Area Findings Venographic FlowArea 1Area 2 on FindingsPcVaEqPcVaEq 10F/19VMA & VSlowly growing SclerotherapyL cheekSingle, smallNormal except Dilated venous N561251394265109 massfocal arterial sac without staining draining vein 11M/7VMA & VPrevious sclero-Sclerotherapy L cheekMultiple, Multifocal Irregular large N472671254862121 therapy due to and OPirregular, arterial staining venous sac with huge bluish mass smallfaint normal sized since birthvenous drainage 12M/24VMVSwelling on SclerotherapyL chinNNDDilated venous sac N7377102667396 exertionwithout draining vein 13F/22VMA & VSlowly growing OPR face Contrast-blood Enlarged facial Enlarged draining Y81289144818487 soft elevated massnear eyelevel in dependent artery with small veins with rapid portion, moderateshunt and slow filling-in of unopacified filling of dilated flow that corresponded venous sacto small shunt 14M/10VMVPalpable soft SclerotherapyR masseterNNDDilated venous sac N6487109476695 mass detected 2 without draining vein years prior 15M/15VMVPrevious sclero-SclerotherapyL lower lipNNDDilated venous sac N69108125505399 therapy of slowly without draining vein growing soft mass 16M/16VMVPartially resected Sclerotherapy R buccal Single, smallNDDilated venous sac with N4912197536390 bluish massand OPareadilated draining vein 17F/28VMVLeft cheek swelling; SclerotherapyR cheekNNDDilated venous sac N55991296467208 previous excision with draining vein of mass 18F/18VMVLower lip swellingSclerotherapyR lower lipNNDDilated venous sac N621121725664195 with discolorationwith draining vein 19M/19VMVIncrease of SclerotherapyR lower lipMultiple, NDDilated venous sac N392191605268171 previously known irregular, with draining vein vascular massmoderate 20F/31VMA & VSlowly growing mass SclerotherapyR cheekMultiple, Multifocal arterial Dilated venous sac N571221455665166 after excision of irregular, stainingwith dilated draining mass 2 years priormoderatevein 21F/22VMVIncreased mass after SclerotherapyL cheekMultiple, NDDilated venous sac N511771804752173 excision 10 years round, with draining vein prior; persisted moderate since birth Note.─AVM = arteriovenous malformation, VM = venous malformation, DSA = digital subtraction angiography, A = selective arteriography, V = direct puncture venography, PVA = polyvinyl alcohol, OP = operation, R = right, L = left, N = not present or no, ND = not done, Y = yes, Pc = pre-contrast phase, Va = vascular phase, Eq = equilibrium phase, NA = not available
deceleration of the CT number, the slope of the vascular to equilibrium phase was classified as rapid wash-out (wash- out ratio > 0.5), slow wash-out (0.5 > wash-out ratio > 0.0) and pooling (wash-out ratio < 0).
Therapy included preoperative embolization, direct resection and sclerotherapy. Operative resection was performed in nine patients, transfemoral arterial emboliza- tion was performed in six patients and direct puncture alcohol sclerotherapy was performed in 12 patients. Six patients underwent surgery after embolization or sclerotherapy.
Statistical Analysis
Comparison of the CT number of areas 1 and 2 between high- and low-flow lesions was evaluated using the unpaired t-test in which a value of less than 0.05 was considered as statistically significant. The filling-in and
wash-out ratios of areas 1 and 2 between the high- and low-flow lesions were compared using the unpaired t-test and a value less than 0.05 was considered as statistically significant.
RESULTS
The clinical information, final diagnosis, flow pattern and imaging analysis for each patient are summarized in Table 1. The final diagnosis was an arteriovenous malformation in five patients, a hemangioma in four patients and a venous malformation in 12 patients. According to the findings of a selective arteriogram and/or direct-puncture venogram, nine vascular lesions had a high-flow
component (Fig. 1) while the other 12 lesions did not have a high-flow component (Fig. 2). The high-flow lesions included all five arteriovenous malformations, three
Fig. 2. Imaging findings for 18-year-old female with venous malformation in lower lip are presented.
A. Pre-contrast CT image shows soft tissue mass in right lower lip.
B. Focal area of enhancement is noted within lesion (arrows) on vascular phase image.
C. Geographic enhancement is noted on equilibrium phase CT image.
D. Direct-puncture venogram shows large, venous sac with venous drainage.
Alcohol sclerotherapy could be safely performed for this venous malformation with slow filling-in and wash-out hemodynamics.
A B
C D
hemangiomas and one venous malformation. The low-flow lesions included 11 venous malformations and one
hemangioma.
In nine patients with high-flow vascular lesions, the size of the dense enhancement as seen on the vascular phase was large in four patients, moderate in two patients and small in three patients. In 12 patients with low-flow lesions, five patients did not have any area categorized as dense enhancement; three patients had small lesions and the other four patients had moderate lesions.
On the vascular phase, the CT number of areas 1 and 2 of high-flow lesions was significantly different from that of low-flow lesions (areas 1 and 2: p < 0.05). However, the
CT number of areas 1 and 2 enhancement on the equilib- rium phase did not demonstrate a difference between the two areas (area 1: p = 0.4554, area 2: p = 0.2555) (Table 2).
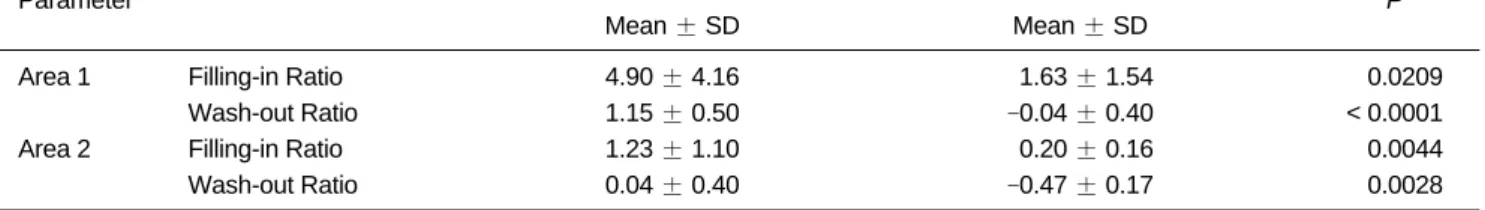
The filling-in and wash-out ratios of high flow lesions in both areas 1 and 2 (4.90 ± 4.16 and 1.15 ± 0.50; 1.23 ± 1.10 and 0.04 ± 0.40, respectively) were significantly higher than for low flow lesions (1.63 ± 1.54 and -0.04 ± 0.40; 0.20 ± 0.16 and -0.48 ± 0.17, respectively) in both areas 1 and 2 (Table 3).
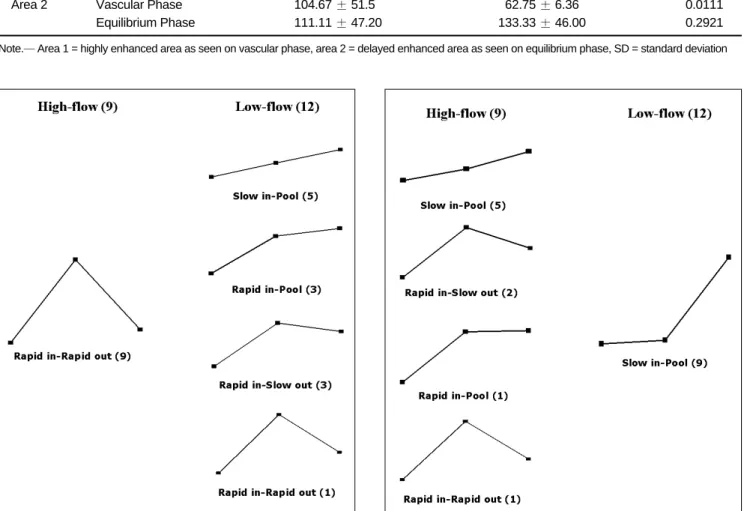
For the time-density curve for area 1, all nine high-flow lesions showed rapid filling-in and rapid wash-out. The curve for area 1 of low-flow lesions showed various
Fig. 3. Pattern of time-density curve for area 1 is shown. All of high-flow lesions (left) show dense (over 200 HU) enhancement on vascular phase CT images; this effect is markedly decreased on equilibrium phase. However, curve for low-flow lesion (right) shows various patterns. CT number of vascular phase is lower than for high-flow lesions.
Fig. 4. Pattern of time-density curve for area 2 is shown. Low- flow lesions (right) show marked elevation in equilibrium phase, thus indicating pooling of contrast medium in vascular lesions.
Contrary to area 1, patterns of time-density curve in all patients are consistent for low-flow lesions, but vary for high-flow lesions.
Table 2. Comparison of CT Numbers between Fast and Slow Flow Lesions CT Number
High-Flow Lesion (n = 9) Low-Flow Lesion (n = 12)
P
Mean ±SD Mean ±SD
Area 1 Vascular Phase 254.78 ±30.22 138.83 ±56.44 < 0.0001
Equilibrium Phase 122.89 ±20.08 134.83 ±26.25 < 0.3214
Area 2 Vascular Phase 104.67 ±51.50 62.75 ±6.36 < 0.0111
Equilibrium Phase 111.11 ±47.20 133.33 ±46.00 < 0.2921
Note.─Area 1 = highly enhanced area as seen on vascular phase, area 2 = delayed enhanced area as seen on equilibrium phase, SD = standard deviation
patterns, including slow filling-in and pooling (5 of 12), rapid filling-in and slow wash-out (3 of 12), rapid filling-in and pooling (3 of 12) and rapid filling-in and rapid wash- out (1 of 12) (Fig. 3). For the time-density curve for area 2, all 12 low-flow lesions demonstrated a similar curve pattern, with slow filling-in and pooling. For high-flow lesions, the pattern of the time density curve for area 2 varied, with slow-filling in and pooling (5 of 9), rapid filling-in and slow wash-out (2 of 9), rapid filling-in and pooling (1 of 9) and rapid filling-in and rapid wash-out (1 of 9) (Fig. 4).
DISCUSSION
Vascular malformations can be subdivided into groups depending on the vessel that predominates, i.e. capillary, venous or arterial, and with or without lymphatic anomalies. The term hemangioma should be restrictively used to refer to a vascular tumor that enlarges by rapid cellular proliferation followed by slow involution.
However, “hemangioma” has also been used as a term to indicate some type of vascular malformation, in particular a cavernous hemangioma (3). Arteriovenous malforma- tions and hemangiomas in the head and neck area are usually seen as high-flow lesions on arteriography where definite differentiation is difficult. Therefore, in this study, hemangiomas were diagnosed when there was abnormal cavernous malformation as well as abnormal arteries and veins as determined on a pathological specimen or as mixed high- and low-flow components on an imaging study.
Even though the histological classification of Mulliken and Glowacki (1) has been securely established, the differ- ential diagnosis is not always definite and does not always help to determine optimal treatment. The radiological classification used to clarify the dynamics within a lesion should be used to formulate a treatment plan based on the flow characteristics of the vascular lesion. Treatment has been usually sclerotherapy with or without excision for venous malformations, and embolization and excision for
high-flow lesions (2). Selective arteriography has been a standard diagnostic method to confirm the presence of high flow in vascular lesions (3) despite its shortcoming of occasionally causing complications (9, 10). When a less invasive diagnostic method is used, the necessity for arteri- ography is reduced except for some critical indications that require preoperative embolization, determination of lesion extent and circulatory mapping of an arteriovenous malformation and aneurysms (11).
Grey-scale and Doppler ultrasound (US) are alternative modalities to diagnose soft-tissue vascular anomalies (12);
however, US has only a limited ability to display the full extent of large lesions and to demonstrate an intra-osseous component (13, 14). Some MRI techniques have been used for classification of peripheral vascular lesions (14-16).
Time-of-flight MR angiography can show feeding arteries with high flow; however, this modality has a limitation regarding smaller vessels (15). A previous study by van Rijswijk et al. (16) has demonstrated that with the use of the dynamic contrast-enhancement gradient-echo
technique, venous malformations were distinguished from non-venous malformations with high specificity. Another study (14) has demonstrated that time-resolved MR projec- tion angiography was useful for the separation of high- and low-flow vascular malformations. However, these MRI techniques are inadequate to depict adjacent structures as MRI can only accentuate blood vessels. MRI also has disadvantages of a higher cost and examination time as compared with the use of CT. In addition, CT would be a useful alternative modality for patients with a contraindica- tion for undergoing MRI, such as pacemaker, claustropho- bia and a dental prosthesis.
Defining the type of venous drainage of vascular lesions is required to predict the relapse risk after sclerotherapy and to minimize the risk of distal embolization and thrombophlebitis (5). However, there has been no way to predict the venous drainage pattern before a direct puncture venogram is performed. Most previous studies of non-invasive dynamic imaging have evaluated only high- flow components within vascular lesions (2, 11, 14, 16),
Table 3. Comparison of Filling-in and Wash-out Ratios of Time-density Curves between Fast and Slow Flow Lesions Parameter
High-Flow Lesion (n = 9) Low-Flow Lesion (n = 12)
P
Mean ±SD Mean ±SD
Area 1 Filling-in Ratio 4.90 ±4.16 -1.63 ±1.54 < 0.0209
Wash-out Ratio 1.15 ±0.50 -0.04 ±0.40 < 0.0001
Area 2 Filling-in Ratio 1.23 ±1.10 -0.20 ±0.16 < 0.0044
Wash-out Ratio 0.04 ±0.40 -0.47 ±0.17 < 0.0028
Note.─Area 1 = highly enhanced area as seen on vascular phase, area 2 = delayed enhanced area as seen on equilibrium phase, SD = standard deviation
though it is usual for vascular lesions to present as a mixed lesion in the pathological specimen. In contrast to previous studies, we designed this study to evaluate the time-density curves of two different components a high-flow component (area 1) and a low-flow component (area 2) of a single lesion. Based on the results of this study, the patterns of the time-density curves in all patients were consistent for low-flow lesions but varied for high-flow lesions in area 2.
However, these patterns were reversed for the two flow lesions in area 1. Therefore, to differentiate between high- and low-flow lesions, an analysis of two different ROIs drawn within high- and low-flow components should be more useful than a single ROI in a high-flow component.
Our study has demonstrated that dense enhancement, which is designated as a “rapid filling-in” lesion with a high CT number as depicted on the vascular phase, correlated with the presence of a high-flow lesion. However, several low-flow lesions showed dense enhancement as seen on vascular phase CT. Only vascular phase CT images were limited to differentiate these lesions from high-flow malfor- mations. The comparison of the wash-out pattern as depicted on the equilibrium phase was useful to differenti- ate the lesions. It is noteworthy that rapid filling-in does not always correspond to rapid wash-out. Therefore, the analysis of a combined three-phase CT scan may be more predictable for the flow pattern within a vascular malfor- mation than the use of monophasic CT.
Interpretation and therapeutic application of the three- phase CT findings for low-flow lesions would be a prereq- uisite for a prediction of the effectiveness and risks of a sclerosing agent, such as alcohol, especially in large and/or complicated venous malformations. When there is rapid filling-in of a low-flow lesion, it is expected that there must be a rapid arterial inflow into the venous sac, thereby precluding the sclerosing effect of the alcohol caused by the rapid mixing of alcohol with blood. If there is rapid wash-out along the dilated veins, the injected alcohol can be washed out rapidly and may cause outflow tract sclero- sis or a systemic effect. When a vascular malformation does not show any a significant high-flow component on three-phase CT, invasive transfemoral arteriography is necessary to perform.
This study has some limitations. First, arteriography and venography were not performed in all patients because each study was decided based on findings of individual patient physical examinations that included factors such as compressibility, pulsatility and skin color change of lesions.
As angiograms were not compared in all patients, some lesions that were classified in a broad category may not have been accurately identified. Second, the scan parame- ters varied according to the type of CT scanner employed.
Several different types of CT scanners with various numbers of detector rows (4, 16, and 64) and different manufacturers of scanning equipment were used in our institution. However, the scan acquisition timing, volume and injection rate of the contrast media and the reconstruc- tion slice thickness were constant for all of the different types of CT scanners that were utilized in the study.
For a multiphase CT examination, a patient is exposed to a radiation dose that is multiplied by the number of scanning phases. The lens of the eye is especially sensitive to radiation delivered by X-ray based imaging modalities.
For radiation dose reduction for the use of multiphase CT of the head and neck, we propose to change the protocol by eliminating the use of pre-contrast CT and by acquisi- tion of only vascular and equilibrium phase images. It is also proposed to protect the lens of the eye by the use of bismuth-coated latex shielding (17) and to optimize the Z-axis automatic exposure control for multidetector CT (18).
Our results suggest that the pattern analysis of three phase contrast-enhanced CT would be a valuable support method for the evaluation and differentiation of vascular lesions of the head and neck. In addition, the rapidity and pattern of filling-in and wash-out of a contrast agent for a vascular lesion may be useful to decide the next step of imaging. If a vascular lesion with delayed contrast pooling does not show any early dense enhancing area, an arteriog- raphy is not necessary for the evaluation of arterial flow of the vascular lesion. When there are early dense enhancing areas that show contrast wash-out as seen on the equilib- rium phase, arterial angiography and/or direct puncture venography are necessary in order to evaluate arterial flow and wash-out of the flow from a lesion.
Acknowledgement
We acknowledge Sun Moon Whang, BS and Eun Hye Kim, RN in the patient data collection and the assistance of Eun Ja Yoon in manuscript preparation, and we thank Bonnie Hami, MA for English editorial assistance. This study was supported by a grant of the Korea Healthcare technology R&D Project, Ministry of Health & Welfare, Republic of Korea. (A080201)
References
1. Mulliken JB, Glowacki J. Hemangiomas and vascular malforma- tions in infants and children: a classification based on endothe- lial characteristics. Plast Reconstr Surg 1982;69:412-422 2. Jackson IT, Carreno R, Potparic Z, Hussain K. Hemangiomas,
vascular malformations, and lymphovenous malformations:
classification and methods of treatment. Plast Reconstr Surg 1993;91:1216-1230
3. Burrows PE, Mulliken JB, Fellows KE, Strand RD. Childhood
hemangiomas and vascular malformations: angiographic differ- entiation. AJR Am J Roentgenol 1983;141:483-488
4. Kaban LB, Mulliken JB. Vascular anomalies of the maxillofacial region. J Oral Maxillofac Surg 1986;44:203-213
5. Dubois JM, Sebag GH, De Prost Y, Teillac D, Chretien B, Brunelle FO. Soft-tissue venous malformations in children:
percutaneous sclerotherapy with Ethibloc. Radiology 1991;180:195-198
6. Byun JH, Kim TK, Lee CW, Lee JK, Kim AY, Kim PN, et al.
Arterioportal shunt: prevalence in small hemangiomas versus that in hepatocellular carcinomas 3 cm or smaller at two-phase helical CT. Radiology 2004;232:354-360
7. Sheafor DH, Frederick MG, Paulson EK, Keogan MT, DeLong DM, Nelson RC. Comparison of unenhanced, hepatic arterial- dominant, and portal venous-dominant phase helical CT for the detection of liver metastases in women with breast carcinoma.
AJR Am J Roentgenol 1999;172:961-968
8. Kim KW, Kim TK, Han JK, Kim AY, Lee HJ, Choi BI. Hepatic hemangiomas with arterioportal shunt: findings at two-phase CT. Radiology 2001;219:707-711
9. Miller JD, Grace MG, Russell DB, Zacks DJ. Complications of cerebral angiography and pneumography. Radiology 1977;124:741-744
10. Cloft HJ, Joseph GJ, Dion JE. Risk of cerebral angiography in patients with subarachnoid hemorrhage, cerebral aneurysm, and arteriovenous malformation: a meta-analysis. Stroke
1999;30:317-320
11. Hill JH, Mafee MF, Chow JM, Applebaum EL. Dynamic
computerized tomography in the assessment of hemangioma.
Am J Otolaryngol 1985;6:23-28
12. Trop I, Dubois J, Guibaud L, Grignon A, Patriquin H, McCuaig C, et al. Soft-tissue venous malformations in pediatric and young adult patients: diagnosis with Doppler US. Radiology 1999;212:841-845
13. Fordham LA, Chung CJ, Donnelly LF. Imaging of congenital vascular and lymphatic anomalies of the head and neck.
Neuroimaging Clin N Am 2000;10:117-136
14. Ziyeh S, Schumacher M, Strecker R, Rossler J, Hochmuth A, Klisch J. Head and neck vascular malformations: time-resolved MR projection angiography. Neuroradiology 2003;45:681-686 15. Dobson MJ, Hartley RW, Ashleigh R, Watson Y, Hawnaur JM.
MR angiography and MR imaging of symptomatic vascular malformations. Clin Radiol 1997;52:595-602
16. van Rijswijk CS, van der Linden E, van der Woude HJ, van Baalen JM, Bloem JL. Value of dynamic contrast-enhanced MR imaging in diagnosing and classifying peripheral vascular malformations. AJR Am J Roentgenol 2002;178:1181-1187 17. Hopper KD, Neuman JD, King SH, Kunselman AR.
Radioprotection to the eye during CT scanning. AJNR Am J Neuroradiol 2001;22:1194-1198
18. Namasivayam S, Kalra MK, Pottala KM, Waldrop SM, Hudgins PA. Optimization of Z-axis automatic exposure control for multidetector row CT evaluation of neck and comparison with fixed tube current technique for image quality and radiation dose. AJNR Am J Neuroradiol 2006;27:2221-2225