INTRODUCTION
Acquisition of accurate magnetic resonance (MR) images in pediatric patients requires sedation because MR imaging (MRI) is very sensitive to motion artefacts.1 Administration of hypnotic
agents prior to the start of MRI is mandatory, because most children are not reassured by verbal explanation. Additional administration of sedatives might also be required to prevent patient movement during MRI. Propofol is a popular intrave- nous anesthetic for pediatric sedation because of its properties of rapid onset and high efficacy of sedation, rapid and com- plete recovery, and prevention of nausea and vomiting.2-5 How- ever, at high concentrations, propofol is associated with a high incidence of side effects, including hypotension, bradycardia, respiratory depression, and apnea.6,7 Therefore, anesthesiolo- gists should administer appropriate dosages of propofol to ach- ieve adequate sedation without any adverse effects. However, because of the lack of MRI-compatible assessment monitors for the level of sedation (e.g., bispectral index) and target-con- trolled infusion systems, it is challenging to determine the ap- propriate dosage and time interval of additional propofol ad- Received: June 13, 2017 Revised: July 21, 2017
Accepted: July 24, 2017
Corresponding author: Dr. Dong Woo Han, Department of Anesthesiology and Pain Medicine, Anesthesia and Pain Research Institute, Yonsei University College of Medicine, Gangnam Severance Hospital, 211 Eonju-ro, Gangnam-gu, Seoul 06273, Korea.
Tel: 82-2-2019-3529, Fax: 82-2-3463-0940, E-mail: [email protected]
•The authors have no financial conflicts of interest.
© Copyright: Yonsei University College of Medicine 2017
This is an Open Access article distributed under the terms of the Creative Com- mons Attribution Non-Commercial License (http://creativecommons.org/licenses/
by-nc/4.0) which permits unrestricted non-commercial use, distribution, and repro- duction in any medium, provided the original work is properly cited.
A Simulation Study of Propofol Effect-Site Concentration for Appropriate Sedation in Pediatric Patients
Undergoing Brain MRI: Pharmacodynamic Analysis
Se Hee Na, Young Song, So Yeon Kim, Hyo-Jin Byon, Hwan-Ho Jung, and Dong Woo Han
Department of Anesthesiology and Pain Medicine, Anesthesia and Pain Research Institute, Yonsei University College of Medicine, Seoul, Korea.
Purpose: We aimed to establish the propofol effect-site concentration (Ce) for appropriate sedation by pharmacodynamic analysis and to determine the propofol Ce during occurrence of sedation-related side effects in pediatric patients undergoing brain mag- netic resonance imaging (MRI).
Materials and Methods: In 50 pediatric patients scheduled for brain MRI, sedation was induced with 2.0 mg/kg propofol; addi- tional propofol doses were 0.5−1 mg/kg. Propofol Ce was simulated by inputting the propofol administration profiles of patients into a pediatric compartmental model (Choi model). The relationship between propofol Ce and probabilities of sedation and re- covery were analyzed using a sigmoidal Emax model. The simulated propofol Ce for sedation-related side effects was investigated.
Population model parameters were estimated using the Nonlinear Mixed-Effects Modelling software.
Results: The mean values of propofol Ce50 for sedation during the preparation, scanning, and recovery phases were 1.23, 0.43, and 0.39 μg/mL. The simulated propofol Ce values during oxygen desaturation (SpO2 <90%) (3 patients; 6%), hypotension (16 patients;
32%), and bradycardia (12 patients; 24%) were 3.01±0.04, 2.05±0.63, and 2.41±0.89 μg/mL, respectively.
Conclusion: The required propofol Ce50 for applying monitors during the preparation phase before the start of MRI was higher than the propofol Ce50 required during the scanning phase. During low-intensity stimulation phases, such as scanning, propofol bolus dose should be strictly titrated not to exceed the propofol Ce that can lead to oxygen desaturation because of the relatively low propofol Ce (Ce95, 1.43 μg/mL) required for sedation in most patients.
Key Words: Effect-site concentration, magnetic resonance imaging, population pharmacodynamics modelling, propofol, sedation, simulation
pISSN: 0513-5796 · eISSN: 1976-2437 Yonsei Med J 2017 Nov;58(6):1216-1221
https://doi.org/10.3349/ymj.2017.58.6.1216
ministration. Furthermore, few studies to date have evaluated optimal propofol dosing strategies for achieving adequate se- dation with minimal adverse effects.8-10 The ability to predict the appropriate propofol effect-site concentration (Ce) for seda- tion, as well as its side effects, will be clinically advantageous, because the Ce of a drug is considered a surrogate for estimat- ing its effects without time delay. Simulation and population pharmacodynamic analysis can help determine the probabil- ity of sedation and adverse effects of sedation at specific pro- pofol Ce values simulated on the basis of the pharmacokinetic parameters of the compartmental model.
This study aimed to establish the propofol Ce for appropri- ate sedation by pharmacodynamic analysis and to investigate the Ce of propofol during occurrence of sedation-related side effects in pediatric patients undergoing brain MRI.
MATERIALS AND METHODS
This retrospective study was approved by the Institutional Re- view Board of Gangnam Severance Hospital (#3-2013-0075).
The medical data of fifty patients between the ages of 4 and 12 years scheduled for elective brain MRI (with and without con- trast) under sedation were reviewed retrospectively. Patients with heart and lung diseases, airway abnormalities, uncontroll- ed movement, and recent history of use of anticonvulsants or psychotropic medication were excluded. The pediatric seda- tion protocol for MRI scanning was used in our hospital as fol- lows: Preprocedural fasting of 6 h for solid food and 2 h for clear fluids were ensured for MRI. Baseline values of mean arterial pressure (MAP) and heart rate (HR) were recorded, and an in- travenous cannula was placed in the general ward before the patients were brought into the preparation room for MRI. Seda- tion was induced with a combination of 2 mg/kg propofol and 2 mg/mL lidocaine administered over 30 s before application of monitors for recording electrocardiography (ECG), non-in- vasive blood pressure (NIBP), oxygen saturation (SpO2), and end-tidal CO2 level. Supplemental oxygen was supplied at 3−4 L/min, and nasal capnography was performed. Patients were provided earplugs for protection against the operating noise of the scanner and were appropriately positioned on the scanning table using a soft neck roll. During the preparatory period for
application of monitors, patients exhibiting University of Michi- gan Sedation Scale (UMSS) (Table 1) scores ≥3 and no move- ment after 1.5 min of propofol administration were considered adequately “sedated” for the preparation phase, while those ex- hibiting movement or UMSS scores <3 were considered to be
“not sedated,” after which 0.5−1 mg/kg propofol was addition- ally administered. Following the preparation phase, when pa- tients were judged to be adequately sedated, scanning was st- arted after ensuring airway patency and adequacy of spontane- ous respiration. During the MR scanning period, if patients were considered to be “not sedated,” 0.5−1 mg/kg propofol was ad- ditionally administered. In case of suspected airway obstruc- tion or oxygen desaturation, scanning was stopped, the patient was brought out from the imaging tunnel, and the neck was ex- tended with a chin lift. Upon completion of the scanning proce- dure, patients were transported to the adjacent recovery room, where HR, MAP, respiratory rate, and SpO2 were monitored by a nurse. “Recovery” from sedation was defined by spontaneous eye opening and vocalization by the patients. Parents were al- lowed to stay with the patients in the recovery room. Upon ful- filment of the discharge criteria,11 patients were discharged from the recovery room.12
The dosage and time of administration of propofol, appropri- ateness of sedation, and incidence of hypotension (MAP 20%
below the baseline value), bradycardia (HR 20% below the ba- seline value), oxygen desaturation (SpO2 <90%), and the man- agements for sedation-related events were collected from elec- tronic medical records. On the assumption that stimuli present- ed to the patients would vary during preparation, scanning, and recovery, those periods were divided into three phases: 1) preparation phase, period starting from application of monitors for recording ECG, NIBP, and SpO2 before the start of MRI; 2) scanning phase, period of MR image acquisition; and 3) re- covery phase, period from the end of MRI to recovery of the pa- tient. Recovery time was defined as the duration of the recovery phase, while scanning time was defined as the period from the start of MR image acquisition to its completion.
Propofol Ce was simulated by inputting the propofol admin- istration profile of each patient into the pediatric compartmen- tal model proposed by Choi, et al.,13 using a simulation pro- gram (http://www.pkpdtools.com). The pharmacodynamic model for assessment of adequate sedation and recovery was developed using the population approach. The relationships between propofol Ce and the probabilities of sedation for the preparation and scanning phases (not sedated=0; sedated=1, equation 1) and recovery for the recovery phase (sedated=0; re- covered=1, equation 2) were analyzed using the following sig- moidal Emax models:
P = Ceλ
Ce50λ+Ceλ (1)
where P is the probability of the patients being “sedated”; Ce50 Table 1. The University of Michigan Sedation Scale
Value State of the patient
0 Awake and alert
1 Minimally sedated: tired/sleepy; appropriate response to verbal conversation and/or sound.
2 Moderately sedated: somnolent/sleeping; easily aroused with light tactile stimulation or a simple verbal command.
3 Deeply sedated: deep sleep; aroused only with significant physical stimulation.
4 Unarousable
is the value of Ce associated with a 50% probability of the pa- tients being “sedated”; and λ is the steepness of the concentra- tion-versus-response curve.
P=1− Ceλ
Ce50λ+Ceλ (2) where P is the probability of the patients having “recovered”;
Ce50 is the value of Ce associated with a 50% probability of the patients having “recovered”; and λ is the steepness of the con- centration-versus-response curve. The likelihood of the ob- served response, R (sedation in equation 1 and recovery in equ- ation 2), was described by the following equation:
Likelihood=R×P+(1-R)×(1-P)
Model parameters were estimated using the option “Likeli- hood Laplace Method=conditional” in the Nonlinear Mixed- Effects Modelling (NONMEM) software (version VII; Globo- Max, Hanover, MD, USA). Random inter-individual variabilities of Ce50 and λ were modelled using a log-normal model or, if necessary, fixed to zero. Propofol Ce associated with a 95%
probability of sedation or recovery (Ce95) was estimated from the parameters of our pharmacodynamics model for the rela- tionship between propofol Ce and the probabilities of seda- tion and recovery. For each analysis, NONMEM computes the minimum value of the objective function, a statistic propor- tional to twice the negative log likelihood of the data. A non- parametric bootstrap procedure was performed for internal validation using the Perl-speaks-NONMEM (PsN) software (version 3.6.2; https://uupharmacometrics.github.io/PsN), and the original data set was randomly sampled to generate 2000 bootstrap replicates. The 95% confidence intervals (CIs) of the nonparametric bootstrap replicates were determined and compared with the final values of the model parameters. De- scriptive statistical analyses were performed with SPSS (IBM SPSS Statistics, version 23; IBM Corp., Armonk, NY, USA).
RESULTS
All 50 of the enrolled patients completed the study without dropping out. The most common indications for MRI includ- ed developmental delay, myopathy, and headache. The de- mographic and clinical characteristics of the enrolled patients are presented in Table 2. While 13 patients (26%) underwent MRI with a single dose of propofol, 37 patients (74%) required additional administration after the first bolus. Table 3 lists the values of the parameters and bootstrap estimates of the phar- macodynamic models for sedation and recovery. As indicated by the narrow 95% CIs and <50% relative standard errors, all parameters were estimated with adequate precision, and the probabilities of sedation and recovery were adequately de- scribed with a sigmoidal Emax model using the propofol Ce.
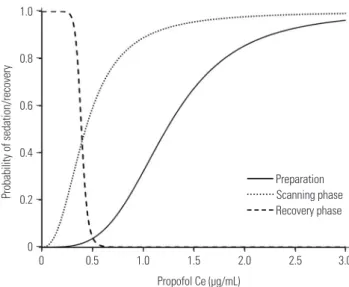
There was no covariate, such as sex, age, body weight or devel- opmental delay, included to improve the performance of the model for each phase based on the likelihood ratio test. The simulated Ce95 values for sedation during preparation and scanning phase and recovery during recovery phase were 2.77, 1.43, and 0.31 μg/mL, respectively (Fig. 1).
Three patients (6%) experienced oxygen desaturation (SpO2, 74−90%) during the scanning phase, which was resolved im- mediately by administering jaw thrust and chin lift maneuvers.
The estimated Ce at which oxygen desaturation occurred in these patients was 2.91−3.09 μg/mL. Hypotension and brady- Table 2. Demographic and Clinical Characteristics of the 50 Pediatric Patients Scheduled for Elective Brain MRI under Sedation
Clinical variables Data values
Age (month) 6.6±3.0
Weight (kg) 21.4±9.9
Height (cm) 113.9±18.7
Sex (M/F) 25/25
Scanning time (min) 29.9±12.4
Recovery time (min) 10.7±11.0
Number of patients requiring
additional propofol administration (0/1/2/3) 13/15/19/3
Total propofol dosage (mg/kg) 3.4±1.1
Values are presented as mean±SD or number of patients.
Table 3. Findings of the Population Pharmacodynamic Models for Sedation and Recovery with Propofol
Parameter Population mean value (%RSE) Inter-individual variability (%CV) Median (2.5–97.5%) Sedation
Ce50(1) (μg/mL) 1.23 (18.41) 39.24 1.24 (1.02–1.21)
Ce50(2) (μg/mL) 0.43 (10.96) 35.92 0.42 (0.12–0.34)
Ce50(3) (μg/mL) 0.39 (5.00) 42.31 0.38 (0.21–0.47)
λ(1) 3.63 (25.32) - 3.72 (3.50–3.81)
λ(2) 2.45 (6.73) - 2.48 (2.31–2.58)
λ(3) 12.70 (12.76) - 13.90 (8.9–18.1)
Ce50(m), propofol Ce associated with a 50% probability of being at phase “m”; λ(m), steepness of the concentration-versus-response curve at phase “m”; phase 1
(preparation), period starting from the application of monitors including electrocardiography, non-invasive blood pressure, and SpO2 prior to the start of MRI;
phase 2 (scanning), period of MR image acquisition; phase 3 (recovery), period from the end of MRI to recovery of the patient. Ce, effect-site concentration; RSE, relative standard error; CV, coefficient of variation; MRI, magnetic resonance imaging.
cardia were transiently observed in 16 (32%) and 12 (24%) pa- tients and were resolved without special treatment. The esti- mated Ce values at which hypotension and bradycardia oc- curred were 2.05±0.63 and 2.41±0.89 μg/mL, respectively. Fig.
2 and Supplementary Table 1 (only online) present an example of the simulated dosing strategy for achieving Ce95 values of 2.77 μg/mL (Ce95 required for sedation during the preparation phase) and 1.43 μg/mL (Ce95 required for sedation during the scanning phase) in a patient (body weight: 10, 15, 20, 25, and 30 kg) on the basis of the parameters of our pharmacodynam- ic model.
DISCUSSION
In the present study, we simulated the propofol Ce using the propofol administration profile of each patient and established the pharmacodynamic relationships between propofol Ce and the probabilities of sedation and recovery for MRI in pe- diatric patients. We used a non-linear sigmoidal Emax model for analysis14 and estimated not only the Ce50 value but also the steepness of the concentration-effect relationship (γ). We also simulated the propofol Ce values at which sedation-relat- ed side effects were observed.
Propofol is considered to be the best intravenous drug for pediatric sedation.3,4,15,16 It offers several advantages over pen- tobarbital, midazolam, and fentanyl,7,8 including faster induc- tion, shorter emergence, shorter duration of stay in the post-
anesthesia care unit (PACU), and fewer interruptions during MRI.17,18 However, its narrow therapeutic window and the vul- nerability of patients to its sedative effects might quickly lead to unintended deep anesthesia with loss of protective reflexes upon even small increases in dosage.19,20 An appropriate low dosage of propofol that ensures an adequate depth of sleep for the successful completion MRI would probably help mini- mize these adverse events. When the Ce of propofol for appro- priate sedation is unknown, there is no alternative for the dos- ing strategy, other than depending entirely on the experience of the clinician. This means that, with the aid of estimated Ce values of a drug for response, it is possible to predict the re- sponsiveness of patients and the side effects of the drug in ad- vance by simulating Ce values with the drug administration profiles, regardless of whether the drug is administered through bolus or continuous infusion.
In the present study, anesthesia was induced with 2.0 mg/
kg propofol, which has been considered as the conventional dosage in previous studies.15,21 There were no instances of air- way compromise or respiratory depression during the prepa- ration phase, although nine patients (18%) required addition- al administration of 1.0 mg/kg propofol because of inadequate sedation. In a previous study, an induction dose of 2.69 mg/kg propofol was found to be adequate for MRI in patients with ce- rebral palsy; however, 25% of the patients in that study experi- enced oxygen desaturation with partial airway obstruction im- mediately after the bolus dose.22 According to our findings, the simulated mean Ce95 of propofol for sedation during the 1.0
0.8
0.6
0.4
0.2
0
Probability of sedation/recovery
0 0.5 1.0 1.5 2.0 2.5 3.0
Propofol Ce (μg/mL)
Preparation Scanning phase Recovery phase
Fig. 1. Probability curves for propofol Ce versus sedation (preparation and scanning phase) and recovery (recovery phase). The simulated Ce95 values for sedation in preparation and scanning phase and recov- ery in recovery phase are 2.77, 1.43, and 0.31 μg/mL, respectively. Prep- aration phase, period starting from application of monitors for recoding electrocardiography readings, non-invasive blood pressure, and arteri- al oxygen saturation prior to the start of MRI; scanning phase, period of MR image acquisition; recovery phase, period from the end of MRI to the recovery of the patient. Ce, effect-site concentration; MRI, magnetic resonance imaging.
3.5 3.0 2.5 2.0 1.5 1.0 0.5 0
Propofol sffevt-site concentration (μg/ml)
0 10 20 30 40 50 60 70 80
Time (min) Target propofol Ce Actual propofol Ce
A B C
Fig. 2. Propofol Ce required for 95% probability of sedation during the preparation (2.77 μg/mL) and scanning phase (1.43 μg/mL), respectively.
Blue line represents target propofol Ce for sedation and red line repre- sents actual propofol Ce achieving target propofol Ce. A: preparation phase, period starting from application of monitors for recording elec- trocardiography readings, non-invasive blood pressure, and arterial ox- ygen saturation prior to the start of MRI. B: scanning phase, period of MR image acquisition. C: recovery phase, period from the end of MRI to the recovery of the patient. Ce, effect-site concentration; MRI, magnetic resonance imaging.
preparation phase prior to the start of MRI was 2.77 μg/mL.
Considering these results, an initial dosage of 2.4−2.5 mg/kg propofol would be appropriate for achieving a Ce of approxi- mately 2.77 μg/mL, which could induce sedation with 95%
probability while minimizing the risk of oxygen desaturation.
During the scanning phase, patients require deep sedation for the successful completion of MRI without any undesirable pa- tient movement, discomfort, pain, or anxiety.23,24 Therefore, in the present study, the state of adequate sedation was defined when patients exhibited UMSS scores ≥3, indicating deep se- dation. However, the concentrations of propofol required for scanning phase (Ce50, 0.43 μg/mL; Ce95, 1.43 μg/mL) were lower than those required for the preparation phase, and those were lower than we had expected. We had the patients wear earplugs for protection against the operating noise of the MR scanner while applying other monitors. Although it has not been proven whether earplugs shut out noise effectively, they might help reduce the required propofol concentration during MRI.
It might be presumed that the propofol concentration re- quired for recovery would be much lower than that required for sedation during the scanning phase. However, according to our results, the Ce50 for recovery (0.39 μg/mL) was a little lower than that for sedation during scanning (0.43 μg/mL). This might be attributable to the stimuli encountered after the scanning pro- cedure: stimuli provided by the removal of earplugs and de- tachment of monitors after the completion of MRI would be more intense than initially expected. The value of λ, which rep- resents the steepness of the dose-response curve, in the recov- ery phase was greater than that in the scanning phase. This find- ing suggests abrupt recovery of patients during the recovery phase, which might have also been caused by the aforemen- tioned physical stimuli encountered at the end of scanning.
Hypotension, bradycardia, and arterial oxygen desaturation occur more commonly with propofol than with other seda- tives.7 Oxygen desaturation, one of the most disastrous side ef- fects of sedation with propofol, was observed in three patients at 2−5 min after additional administration of propofol during the scanning phase. Given that these patients readily recovered upon administration of the jaw thrust and chin lift maneuvers, the oxygen desaturation was probably caused by airway ob- struction rather than hypoventilation. Propofol induces hypox- emia more readily in pediatric patients than in adults because of their narrower airways and lower functional residual ca- pacity.25 In the present study, the simulated propofol Ce that caused oxygen desaturation, which estimated from pharma- cokinetic parameters and the blood-brain equilibration rate constant (ke0) of the Choi model13 was 2.9−3.1 μg/mL. The dos- age (0.5−1 mg/kg) mentioned in our study should be titrated strictly, especially for additional administration of propofol dur- ing low-intensity stimulation phases, such as scanning, in or- der to ensure a low probability of oxygen desaturation. Addi- tionally, airway patency should be monitored more vigorously immediately after the peak time of propofol Ce after addition-
al administration. Otherwise, continuous infusion of low dose propofol based on simulation with our pharmacodynamic mod- el could be more advantageous than intermittent bolus admin- istration of propofol as shown in Supplementary Table 1 (only online), because bolus administration of propofol might often be unnecessarily higher than the dosage required for sedation in patients during scanning phase. In the present study, hypo- tension and bradycardia were observed at propofol Ce values of 2.05±0.63 and 2.41±0.89 μg/mL in 32% and 24% of the pa- tients, respectively, a few minutes after additional administra- tion of propofol. Hypotension and bradycardia occurred at low- er values of propofol Ce than did oxygen desaturation; however, these effects were transient and resolved spontaneously. In our experience, these changes were benign and not associated with any adverse events.
There are a few limitations to the present study. We did not evaluate the plasma propofol concentrations. We also presumed the simulated propofol Ce values derived from the Choi mod- el to be applicable to the enrolled study population. Although a perfect pharmacokinetics model for pediatrics has yet to be established, the Choi model, which has been recently devel- oped and externally validated in children, is considered reli- able and appropriate for pharmacodynamic modelling. This unique model includes pharmacokinetic parameters as well as the ke0 of propofol obtained in a single population of chil- dren.13,26,27 Another limitation of the present study is that our pharmacodynamic model was developed using data acquired without premedication or analgesics. Therefore, in order to avoid oversedation, propofol Ce should be reduced when other drugs with potentially synergistic effects on sedation are con- currently administered.28,29 However, propofol alone is close to an ideal sedative for non-painful procedures, such as MRI or nuclear imaging. Moreover, the use of multidrug sedation regimens is not clinically recommended because of their in- creased risk of adverse respiratory events.30
In conclusion, this clinical investigation is the first to report a pharmacodynamic model that can help establish the guide- lines for optimal propofol sedation with minimal risk of oxygen desaturation during MRI. The required propofol Ce50 for ap- plying monitors during the preparation phase before the start of MRI is higher than the propofol Ce50 required during the scanning phase. During low-intensity stimulation phases, such as scanning, propofol bolus dose should be strictly titrated not to exceed the propofol Ce that lead to oxygen desaturation be- cause of relatively low propofol Ce (Ce95, 1.43 μg/mL) required for sedation in most patients. Also, despite the low probability of oxygen desaturation, airway patency should be monitored vigorously immediately after additional administration of pro- pofol during the scanning phase. Our pharmacodynamic mod- el representing the relationships between propofol Ce and the probabilities of sedation and recovery could help determine the dosages and infusion rates of propofol for all methods of de- livery.
ACKNOWLEDGEMENTS
This work was performed in the Department of Anesthesia and Pain Medicine, Gangnam Severance Hospital, Seoul, Korea.
REFERENCES
1. Mark A. Brown RCS. Magnetic resonance imaging principles and applications. In: Joseph KTL, Stuart SS, Robert JS, Jay PH, editors.
Computed body tomography with MRI correlation. 4th ed. Phila- delphia: Lippincott Williams & Wilkins; 2006. p.29-93.
2. Hasan RA, Shayevitz JR, Patel V. Deep sedation with propofol for children undergoing ambulatory magnetic resonance imaging of the brain: experience from a pediatric intensive care unit. Pediatr Crit Care Med 2003;4:454-8.
3. Serafini G, Zadra N. Anaesthesia for MRI in the paediatric patient.
Curr Opin Anaesthesiol 2008;21:499-503.
4. Sury MR, Smith JH. Deep sedation and minimal anesthesia. Pae- diatr Anaesth 2008;18:18-24.
5. Vangerven M, Van Hemelrijck J, Wouters P, Vandermeersch E, Van Aken H. Light anaesthesia with propofol for paediatric MRI.
Anaesthesia 1992;47:706-7.
6. Cravero JP, Beach ML, Blike GT, Gallagher SM, Hertzog JH; Pedi- atric Sedation Research Consortium. The incidence and nature of adverse events during pediatric sedation/anesthesia with propo- fol for procedures outside the operating room: a report from the Pediatric Sedation Research Consortium. Anesth Analg 2009;108:
795-804.
7. Mallory MD, Baxter AL, Kost SI; Pediatric Sedation Research Con- sortium. Propofol vs pentobarbital for sedation of children under- going magnetic resonance imaging: results from the Pediatric Se- dation Research Consortium. Paediatr Anaesth 2009;19:601-11.
8. Pershad J, Wan J, Anghelescu DL. Comparison of propofol with pentobarbital/midazolam/fentanyl sedation for magnetic reso- nance imaging of the brain in children. Pediatrics 2007;120:e629-36.
9. Machata AM, Willschke H, Kabon B, Kettner SC, Marhofer P. Pro- pofol-based sedation regimen for infants and children undergoing ambulatory magnetic resonance imaging. Br J Anaesth 2008;101:
239-43.
10. Kitt E, Friderici J, Kleppel R, Canarie M. Procedural sedation for MRI in children with ADHD. Paediatr Anaesth 2015;25:1026-32.
11. American Society of Anesthesiologists Task Force on S, Analgesia by N-A. Practice guidelines for sedation and analgesia by non-an- esthesiologists. Anesthesiology 2002;96:1004-17.
12. Aldrete JA, Kroulik D. A postanesthetic recovery score. Anesth Analg 1970;49:924-34.
13. Choi BM, Lee HG, Byon HJ, Lee SH, Lee EK, Kim HS, et al. Popu- lation pharmacokinetic and pharmacodynamic model of propofol externally validated in children. J Pharmacokinet Pharmacodyn 2015;42:163-77.
14. Lu W, Ramsay JG, Bailey JM. Reliability of pharmacodynamic analysis by logistic regression: mixed-effects modeling. Anesthe-
siology 2003;99:1255-62.
15. Srinivasan M, Turmelle M, Depalma LM, Mao J, Carlson DW. Pro- cedural sedation for diagnostic imaging in children by pediatric hospitalists using propofol: analysis of the nature, frequency, and predictors of adverse events and interventions. J Pediatr 2012;160:
801-6.e1.
16. Schulte-Uentrop L, Goepfert MS. Anaesthesia or sedation for MRI in children. Curr Opin Anaesthesiol 2010;23:513-7.
17. Koroglu A, Teksan H, Sagir O, Yucel A, Toprak HI, Ersoy OM. A comparison of the sedative, hemodynamic, and respiratory effects of dexmedetomidine and propofol in children undergoing mag- netic resonance imaging. Anesth Analg 2006;103:63-7.
18. Gutmann A, Pessenbacher K, Gschanes A, Eggenreich U, Wargenau M, Toller W. Propofol anesthesia in spontaneously breathing chil- dren undergoing magnetic resonance imaging: comparison of two propofol emulsions. Paediatr Anaesth 2006;16:266-74.
19. Krauss B, Green SM. Sedation and analgesia for procedures in chil- dren. N Engl J Med 2000;342:938-45.
20. Koo BN, Shin S, Kim SY, Kang YR, Jeong KH, Han DW. Pharmaco- dynamic estimate of propofol-induced sedation and airway ob- struction effects in obstructive sleep apnea-hypopnea syndrome.
Yonsei Med J 2015;56:1408-14.
21. Milius EM, Papademetrious TR, Heitlinger LA. Retrospective re- view of propofol dosing for procedural sedation in pediatric pa- tients. J Pediatr Pharmacol Ther 2012;17:246-51.
22. Kim EJ, Jo YY, Kil HK. Optimal sedative dose of propofol to start MRI in children with cerebral palsy. Korean J Anesthesiol 2011;61:
216-9.
23. Arthurs OJ, Sury M. Anaesthesia or sedation for paediatric MRI:
advantages and disadvantages. Curr Opin Anaesthesiol 2013;26:
489-94.
24. Osborn IP. Magnetic resonance imaging anesthesia: new challeng- es and techniques. Curr Opin Anaesthesiol 2002;15:443-8.
25. Gozal D, Mason KP. Pediatric sedation: a global challenge. Int J Pe- diatr 2010;2010:701257.
26. Rigouzzo A, Girault L, Louvet N, Servin F, De-Smet T, Piat V, et al.
The relationship between bispectral index and propofol during target-controlled infusion anesthesia: a comparative study be- tween children and young adults. Anesth Analg 2008;106:1109-16.
27. Constant I, Rigouzzo A. Which model for propofol TCI in children.
Paediatr Anaesth 2010;20:233-9.
28. McClune S, McKay AC, Wright PM, Patterson CC, Clarke RS. Syn- ergistic interaction between midazolam and propofol. Br J Anaesth 1992;69:240-5.
29. Olmos M, Ballester JA, Vidarte MA, Elizalde JL, Escobar A. The combined effect of age and premedication on the propofol require- ments for induction by target-controlled infusion. Anesth Analg 2000;90:1157-61.
30. Sanborn PA, Michna E, Zurakowski D, Burrows PE, Fontaine PJ, Connor L, et al. Adverse cardiovascular and respiratory events dur- ing sedation of pediatric patients for imaging examinations. Radi- ology 2005;237:288-94.