• 검색 결과가 없습니다.

Association of Meat Intake with Overweight and Obesity among School-aged Children and Adolescents

N/A
N/A
Protected

Academic year: 2021

Share "Association of Meat Intake with Overweight and Obesity among School-aged Children and Adolescents"

Copied!
10
0
0

로드 중.... (전체 텍스트 보기)

전체 글

(1)

Association of Meat Intake with Overweight and

Obesity among School-aged Children and Adolescents

Sun Mi Shin*

Department of Nursing, Joongbu University, Geumsan, Korea

Background: This study aimed to investigate the association of overweight and obesity with red and white meat intake among children and adolescents using secondary survey data (n=16,261) from in-school Student Health Examination conducted in 2006 and 2007.

Methods: Descriptive statistics was conducted to investigate the frequency of meat intake per week. The body mass index (BMI) grades for obesity in boys and girls were classified using the standards from the 2007 Korean National Growth Charts. The association of meat intake with overweight and obesity was analyzed using Chi- square test and multiple logistic regression.

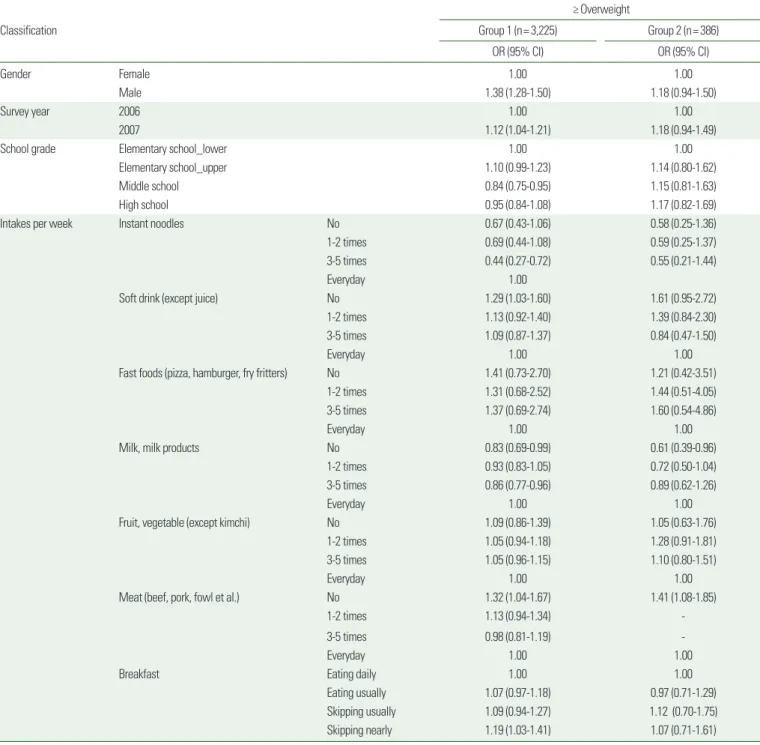
Results: The proportion of subjects with no intake/week vs. daily meat intake/week was 5.9% and 5.5%, re- spectively. No intake of meat was more frequent in those who were female and in middle school, whereas daily meat intake was more frequent in those who were male and in high school. The proportions of overweight and obesity in the no meat intake/week group and daily meat intake/week group were 12.3% and 11.1% vs. 8.1%

and 9.9%, respectively. After adjusting for confounding variables, including age; consumption of instant noo- dles, soft drinks and fast foods, dairy products, and fruits and vegetables; and skipping breakfast, the odds ratios of overweight and obesity in the no meat intake/week group were 1.41 times higher (95% confidence interval, 1.04-1.85) than those in the daily meat intake/week group.

Conclusion: It is important to consider correcting the perception about meat intake and obesity and avoid re- stricting meat intake to prevent overweight and obesity among children and adolescents.

Key words: School-aged, Children, Adolescents, Meat, Overweight, Obesity

Received August 24, 2016 Reviewed September 24, 2016 Accepted November 12, 2016

* Corresponding author Sun Mi Shin

http://orcid.org/0000-0002-5519-2412 Department of Nursing, Joongbu University, 201 Daehak-ro, Chubu- myeon, Geumsan-gun, Chungnam 32713, Korea

Tel: +82-41-750-6255 Fax: +82-41-750-6416

E-mail: [email protected]

INTRODUCTION

Obesity in children and adolescents is strongly associated with the incidence of cardiovascular diseases, diabetes, and cancer in the adulthood and results in a correspondingly high risk of mortality;

therefore, a high rate of obesity in adolescents is one of the global health issues of this era.

1

Diet in children and the adolescent popu- lation has direct effects on both physical growth and mental matu- ration. Moreover, eating habits established during the adolescent stage are usually persistent throughout adult and late stages of life, and therefore, it has a decisive long-term effect on the health condi-

tion of an individual.

1,2

Selection of appropriate diet for children and adolescents to prevent obesity and maintain normal weight is one of the key research questions. Furthermore, improper under- standing of dietary habits according to age and gender makes it dif- ficult to set goals for a change in diet-related actions or habits.

3

Currently, known obesity risk factors include not only genetic factors and reduced physical activity but also excessive intake of high-caloric food, including sugars, meat with saturated fat, and complex carbohydrate-based food. Furthermore, to prevent and manage obesity, recommending the consumption of vegetables and fruits that contain abundant dietary fibers over meat has been a so-

Copyright © 2017 Korean Society for the Study of Obesity

This is an Open Access article distributed under the terms of the Creative Commons Attribution Non-Commercial License (http://creativecommons.org/licenses/by-nc/4.0/) which per- mits unrestricted non-commercial use, distribution, and reproduction in any medium, provided the original work is properly cited.

2017-03-16 https://crossmark-cdn.crossref.org/widget/v2.0/logos/CROSSMARK_Color_square.svg

(2)

cial convention. Previous studies showed a quantitative propor- tional relationship between meat intake and increased weights since meat has high-fat content and relatively high calories compared to vegetables.

4-6

However, results from a study showed that high pro- tein diet has latent benefits of obesity control by providing consis- tent satiety and assisting in body energy production.

7

Moreover, previous intervention studies in overweight and obese subjects have shown that weight loss was greater when following a high pro- tein diet than a high carbohydrate diet.

8-13

In these previous studies, the effects of meat consumption on obesity were not consistent.

Furthermore, most studies that assessed the association between obesity and meat intake were international studies, and despite their high importance, domestic studies based on a large popula- tion are rarely carried out in Korea. Even fewer studies have been performed to assess the association between diet and overweight/

obesity in children and adolescents by year in school. Paradoxically, the interest in the association between dietary intake of children and adolescents and overweight/obesity remains very high.

The purpose of this study was to investigate the association be- tween red/white meat intake and overweight/obesity in school- aged children and adolescents to provide foundational evidence for both educations on desirable eating habits for school-aged adoles- cent population and policies on school lunches. The following were the specific purposes of the study: first, to identify the fre- quency of the intake of red and white meat (including beef, pork, chicken, etc.) in a school-aged adolescent population; second, to assess the distribution of overweight/obese subjects according to their meat intake level; and third, to identify the effects of meat in- take on overweight/obesity.

METHODS Materials and subjects

This study was a cross-sectional descriptive study to assess the association between the frequency of weekly meat intake and over- weight/obesity in elementary, middle, and high school students.

The subjects of the study are 16,819 school-aged students that had in-school Student Health Examinations performed by the Seoul School Health Promotion Center in 2006 and 2007 (8,188 stu- dents in 2006 and 8,631 students in 2007). Among them, 16,797

(99.9%) responded to questions related to dietary intake and were included in the finalized study cohort.

Data collection and ethical considerations

Secondary data from the Student Health Examination and sur- vey performed by the Seoul School Health Promotion Center in 2006 and 2007 to assess the health conditions of the school-aged population were used in this study. Height and weight were mea- sured by a standard method, using an identical tool and trained ex- aminer. The survey was performed to assess dietary pattern, physi- cal activities, and mental state. Younger elementary school children were asked to complete the survey under parental guidance.

For ethical considerations, all subjects were notified of the pur- pose of the study. The subjects were asked to indicate with a check mark on a form of their agreement to participate in the study, and written informed consent was obtained. Furthermore, data for per- sonal identification (i.e., birth date, school name, and name) were completely removed from all data analyses, and all statistical analy- ses involved group level data rather than individual data. The au- thor requested by the Seoul School Health Promotion Center, the data analysis center of this dataset, to analyze the data obtained consent of the Center for possible future academic publications on the contents required in the development of school health policies.

Measurement variables

Variables used in this study from the original dataset were catego- ries and indices that were assessed in the elementary, middle, and high school students, including demographic variables (gender, as- sessment year, and school year) and dietary intake variables (intake frequency of meat, instant noodles, soft drinks, fast food, milk and dairy products, and fruits and vegetables). In addition, breakfast habit, which is associated with overall dietary habits, was used as a confounding variable.

Obesity level were assessed by body mass index (BMI) (kg/m

2

), which was measured using the actual height and weight measure- ments among testing variables. According to the 2007 Korean Na- tional Growth charts of BMI based on age and gender of the Kore- an Society of Pediatrics

14

,<5% was considered underweight, ≥5%

but<85% were normal weight, ≥85% but<95% were overweight,

and finally >95%, or BMI >25, were considered obese.

(3)

Among dietary intake variables, meat intake habits—the key fac- tor in this study—were assessed by asking the question “In general, how many times do you consume meat (beef, pork, chicken, etc.) in a week?”; the subjects were asked to give a single multiple choice answer with following options: ① None, ② Daily, ③ 1-2 times, and ④ 3-5 times. Subjects who answered “① None” were consid- ered to have no meat intake and “② Daily” were considered to have daily meat intake.

Aside from meat intake, other dietary intake variables were cate- gorized into five groups: instant noodles; soft drinks (excluding fruit juice); fast food (pizza, hamburger, fried food); milk and dairy products; or fruits and vegetables. The same question of “In gener- al, how many times do you consume these foods in a week?” was asked of the aforementioned food groups, and the subjects were once again asked to give a single multiple-choice answer with fol- lowing options: ① None, ② Daily, ③ 1-2 times, and ④ 3-5 times.

Moreover, for a confounding variable associated with a dietary in- take that needs to be controlled, the survey question asked “In gen- eral, do you eat breakfast?”; the subjects were asked to give a single multiple-choice option from following options: ① Eating daily, ② Eating usually, ③ Skipping usually, and ④ Skipping nearly. Other obesity-associated confounding factors such as physical activities, mental health, and hobbies were excluded from the analysis as the survey questions were not identical among elementary, middle and high schools or not included in the surveys for certain schools.

Analysis methods

Descriptive statistics and the Chi-square test were used to assess the percentage of subjects with no meat intake and daily meat in- take, distribution of underweight, overweight, and obesity by the frequency of meat intake, and percentage of subjects with no meat intake and daily meat intake according to obesity levels. Further- more, to understand the effects of the frequency of meat intake on overweight and obesity and to examine the odds ratios (ORs) of overweight and obesity, multiple logistic regression was performed with the general characteristics, dietary intake variables, and break- fast habits as confounding variables.

In all analyses, the missing values for each variable were excluded from the results, and the results were considered statistically signifi- cant at a P<0.05. All statistical analyses were performed using SAS

software (version 9.4; SAS Institute Inc., Cary, NC, USA).

RESULTS

Among 16,261 subjects in the study, 8,408 (51.7%) were male and 7,853 (48.3%) were female. Of the entire cohort, 5.9% had no weekly meat intake and 5.5% had a daily meat intake. When divid- ed by gender, male and female subjects showed distributions of 5.5% and 6.3% for no meat intake and 6.3% and 4.7% for daily meat intake, respectively, indicating a higher frequency of daily in- take in males than in females (P<0.001). Moreover, the meat in- take frequencies of male and female subjects for each year were compared. In 2006, the percentages of male and female subjects with no meat intake were 5.6% and 6.1% and with daily meat in- take were 6.5% and 4.4%, respectively, showing a significant differ- ence between the gender (P<0.001). Similarly, in 2007, the per- centages of male and female subjects with no meat intake were 5.5% and 6.4% and with daily meat intake were 6.0% and 5.0%, re- spectively, indicating a higher frequency of no intake in females and daily intake in males for both years (P=0.016) (Table 1).

The cohort was composed of 8,122 (50.0%) elementary school students, 4,009 (24.6%) middle school students, and 4,130 (25.4%) high school students. The frequency of no meat intake among subjects was higher in the middle school (7.1%) than in the lower year (5.9%) or upper year (5.5%) elementary school and high school (5.0%) cohort. The frequency of daily meat intake among subjects was highest in the high school (8.3%) than in the lower year (3.2%) or upper year (4.0%) elementary school and middle school (6.6%) cohort (P<0.001). Furthermore, among lower year elementary school students (grades 1st, 2nd, and 3rd), the percentages of male and female subjects with no meat intake were 5.8% and 6.1% and with daily meat intake were 3.7% and 2.6%, respectively (P=0.03); whereas, among the upper year ele- mentary school students (grades 4th, 5th, and 6th), the percentages of male and female subjects with no meat intake were 5.3% and 5.8% and with daily meat intake were 4.6% and 3.3%, respectively (P=0.05), showing differences between gender. For middle school students, the percentages of male and female subjects with no meat intake were 6.7% and 7.5% and with daily meat intake were 8.0%

and 5.1%, respectively, demonstrating significant differences be-

(4)

tween gender (P<0.001). Lastly, for high school students, the per- centages of male and female subjects with no meat intake were 4.2% and 5.8% and with daily meat intake were 9.0% and 7.6%, re- spectively; yet again, the results demonstrated gender-based signifi- cant differences (P=0.01) (Table 1).

In subjects with no meat intake vs. with daily meat intake, the fre- quencies of underweight, overweight, and obesity were 3.7% vs.

5.0%, 12.3% vs. 8.1%, and 11.1% vs. 9.9%, respectively, indicating a higher frequency of underweight and lower frequencies of over-

weight and obesity in the subjects with daily meat intake (P<

0.001). Furthermore, when the subjects were categorized into two groups based on weight (less than overweight or overweight/obesi- ty), the frequencies were 76.6% and 23.4% in the subjects with no meat intake while the frequencies were 82.0% and 18.0% in the subjects with daily meat intake, showing a lower frequency of over- weight subjects in the daily meat intake group (P<0.001) (Table 2).

Among 1,857 subjects with either no meat intake or daily meat intake, 386 were overweight or obese (58.0% had no meat intake, Table 1. Frequency of meat intake per week by general characteristics

Classification Subjects No intake 1-2 times 3-5 times Daily times χ

2

P

Total 16,261 (100) 958 (5.9) 9,967 (61.3) 4,437 (27.3) 899 (5.5)

Male 8,408 (51.7) 465 (5.5) 5,044 (60.0) 2,371 (28.2 ) 528 (6.3) 31.7 < 0.001

Female 7,853 (48.3) 493 (6.3) 4,923 (62.7) 2,066 (26.3) 371 (4.7)

Year 2006 7,796 (47.9) 456 (5.9) 4,881 (62.6) 2,029 (26.0) 430 (5.5) 12.9 0.005

Year 2007 8,465 (52.1) 502 (5.9) 5,086 (60.1) 2,408 (28.5) 469 (5.5)

Elementary school_lower 4,057 (25.0) 241 (5.9) 2,717 (67.0) 969 (23.9) 130 (3.2) 396.3 < 0.001

Elementary school_upper 4,065 (25.0) 225 (5.5) 2,778 (68.3) 900 (22.1) 162 (4.0)

Middle school 4,009 (24.6) 284 (7.1) 2,321 (57.9) 1,138 (28.4) 266 (6.6)

High school 4,130 (25.4) 208 (5.0) 2,151 (52.1) 1,430 (34.6) 341 (8.3)

Year 2006 M 4,122 (52.9) 231 (5.6) 2,505 (60.8) 1,117 (27.1) 269 (6.5) 25.7 < 0.001

F 3,674 (47.1) 225 (6.1) 2,376 (64.7) 912 (24.8) 161 (4.4)

Year 2007 M 4,286 (50.6) 234 (5.5) 2,539 (59.2) 1,254 (29.3) 259 (6.0) 10.2 0.016

F 4,179 (49.4) 268 (6.4) 2,547 (61.0) 1,154 (27.6) 210 (5.0)

Elementary school_lower M 2,137 (52.7) 124 (5.8) 1,398 (65.4) 535 (25.0) 80 (3.7) 8.4 0.030

F 1,920 (47.3) 117 (6.1) 1,319 (68.7) 434 (22.6) 50 (2.6)

Elementary school_upper M 2,164 (53.2) 115 (5.3) 1,450 (67.0) 500 (23.1) 99 (4.6) 7.6 0.050

F 1,901 (46.8) 110 (5.8) 1,328 (69.9) 400 (21.0) 63 (3.3)

Middle school M 2,101 (52.4) 141 (6.7) 1,179 (56.1) 612 (29.1) 169 (8.0) 17.3 < 0.001

F 1,908 (47.6) 143 (7.5) 1,142 (59.9) 526 (27.6) 97 (5.1)

High school M 2,006 (48.6) 85 (4.2) 1,017 (50.7) 724 (36.1) 180 (9.0) 11.2 0.01

F 2,124 (51.4) 123 (5.8) 1,134 (53.4) 706 (33.2) 161 (7.6)

Data shown are number (percent) by Chi-square.

Elementary school_lower means lower year elementary school students (grades 1st, 2nd, and 3rd).

Elementary school_upper means upper year elementary school students (grades 4th, 5th, and 6th).

M, male; F, female.

Table 2. Proportion of underweight, normal, overweight, and obesity by frequency of meat intake

Classification Subjects No intake 1-2 intakes 3-5 intakes Daily intakes χ

2

P

Total 16,261 (100) 958 (100) 9,967 (100) 4,437 (100) 899 (100)

Underweight 664 (4.1) 35 (3.7) 399 (4.0) 185 (4.2) 45 (5.0) 32.4 < 0.001

Normal 12,372 (76.1) 699 (73.0) 7,518 (75.4) 3,463 (78.1) 692 (77.0)

Overweight 1,543 (9.5) 118 (12.3) 998 (10.0) 354 (8.0) 73 (8.1)

Obesity 1,682 (10.3) 106 (11.1) 1,052 (10.6) 435 (9.8) 89 (9.9)

< Overweight 13,036 (80.2) 734 (76.6) 7,917 (79.4) 3,648 (82.2) 737 (82.0) 24.6 < 0.001

≥ Overweight 3,225 (19.8) 224 (23.4) 2,050 (20.6) 789 (17.8) 162 (18.0)

Data shown are number (percent) by Chi-square.

(5)

and 42.0% had daily meat intake), showing that the percentage of overweight or obese is higher among the subjects with no meat in- take (P=0.004) (Table 3).

The effects of meat intake on overweight or obesity were as- sessed with OR. Variables such as gender, survey year, dietary hab- its, and breakfast intake were included as confounding variables.

Furthermore, the author assessed two model groups by dividing the subjects differently. Group 1 divided the subjects by meat in- take per week (i.e., no meat intake, 1-2 times/week, 3-5 times/

week, or daily intake). Group 2 only included those with no meat intake or daily meat intake.

The results showed that after controlling for confounding vari- ables, the OR of overweight and obesity was higher in subjects with no meat intake in Group 1 (1.32; 95% CI, 1.04-1.67) and subjects with no meat intake in Group 2 (1.41; 95% CI, 1.08-1.85).

Other variables with effects on overweight or obesity were as fol- lows: males over females with OR 1.38 (95% CI, 1.28-1.50), mid- dle school students over lower year elementary school students with OR 0.84 (95% CI, 0.75-0.95) in Group 1; and no milk intake over daily milk intake with OR 0.61 (95% CI, 0.39-0.96) in Group 2 (Table 4).

DISCUSSION

Known factors associated with weight gain are Western dietary habits

15-17

and a lifestyle lacking in physical activities.

18,19

Further- more, changes such as the replacement of healthy traditional Korean meals with fast food are causing weight gain.

20

As they age, children tend to have a reduced consumption of fruits, vegetables, and milk and an increased consumption of soft drinks.

21,22

Most children are not following the standard guideline of desirable dietary habit.

20,23

Nutritional intake, and more specifically, dietary habits, is a key factor of weight control in school-aged children and the adolescent population. However, very few studies have assessed the associa- tion between meat intake and obesity at any age group, and even fewer for children and adolescent population. An improper under- standing of dietary habits according to age and gender is a limiting factor of various interventions for health promotion and obesity controlling strategies. Therefore, the association between dietary habits and obesity is an interesting topic for researchers.

3

This study utilized the secondary survey data on 16,261 students, who had in- school Student Health Examinations and surveys performed by the Seoul School Health Promotion Center in 2006 and 2007, assessed the frequency of weekly meat intake, and assessed the association between meat intake and overweight/obesity.

The results showed that 5.9% of the subjects had no meat intake per week, and 5.5% had daily meat intake per week. Distribution by gender showed no meat intake in 5.5% and 6.3% of male and fe- male subjects, respectively; whereas, daily meat intake was 6.3% and 4.7% of male and female subjects, respectively. The frequencies were higher for daily intake in males and no intake in females (P<

0.001). Compared to a previous study in Spain, the frequencies of no meat intake per week for students in grades 8th and 10th and grade 12th were 4.1% and 2.6% in males and 4.6% and 4.2% in fe- males, respectively; whereas the frequencies of daily meat intake per week for students in grades 8th and 10th and grade 12th were 4.9%

and 5.7% in males and 3.9% and 5.6% in females, respectively.

23

In this study, the frequencies of no meat intake were higher in male middle school students than high school students (6.7% vs. 4.2%) and in female middle school students than high school students (7.5% vs. 5.8%). Similarly, the frequencies of daily meat intake were also higher in this study than in the Spanish study in male middle Table 3. The proportion of meat intake by obesity index

Obesity index Subjects No intake Daily intakes χ

2

P

Total 1,857 (100) 958 (51.6) 899 (48.4)

Underweight 80 (100) 35 (43.8) 45 (56.3) 11.5 0.009

Normal 1,391 (100) 699 (50.3) 692 (49.8)

Overweight 191 (100) 118 (61.8) 73 (38.2)

Obesity 195 (100) 106 (54.4) 89 (45.6)

< Overweight 1,471 (100) 734 (49.9) 737 (50.1) 8.1 0.004

≥ Overweight 386 (100) 224 (58.0) 162 (42.0)

Data shown are number (percent) by Chi-square.

(6)

Table 4. Odds ratios of meat intake for overweight and above by multiple logistic regression Classification

≥ Overweight

Group 1 (n= 3,225) Group 2 (n= 386)

OR (95% CI) OR (95% CI)

Gender Female 1.00 1.00

Male 1.38 (1.28-1.50) 1.18 (0.94-1.50)

Survey year 2006 1.00 1.00

2007 1.12 (1.04-1.21) 1.18 (0.94-1.49)

School grade Elementary school_lower 1.00 1.00

Elementary school_upper 1.10 (0.99-1.23) 1.14 (0.80-1.62)

Middle school 0.84 (0.75-0.95) 1.15 (0.81-1.63)

High school 0.95 (0.84-1.08) 1.17 (0.82-1.69)

Intakes per week Instant noodles No 0.67 (0.43-1.06) 0.58 (0.25-1.36)

1-2 times 0.69 (0.44-1.08) 0.59 (0.25-1.37)

3-5 times 0.44 (0.27-0.72) 0.55 (0.21-1.44)

Everyday 1.00

Soft drink (except juice) No 1.29 (1.03-1.60) 1.61 (0.95-2.72)

1-2 times 1.13 (0.92-1.40) 1.39 (0.84-2.30)

3-5 times 1.09 (0.87-1.37) 0.84 (0.47-1.50)

Everyday 1.00 1.00

Fast foods (pizza, hamburger, fry fritters) No 1.41 (0.73-2.70) 1.21 (0.42-3.51)

1-2 times 1.31 (0.68-2.52) 1.44 (0.51-4.05)

3-5 times 1.37 (0.69-2.74) 1.60 (0.54-4.86)

Everyday 1.00 1.00

Milk, milk products No 0.83 (0.69-0.99) 0.61 (0.39-0.96)

1-2 times 0.93 (0.83-1.05) 0.72 (0.50-1.04)

3-5 times 0.86 (0.77-0.96) 0.89 (0.62-1.26)

Everyday 1.00 1.00

Fruit, vegetable (except kimchi) No 1.09 (0.86-1.39) 1.05 (0.63-1.76)

1-2 times 1.05 (0.94-1.18) 1.28 (0.91-1.81)

3-5 times 1.05 (0.96-1.15) 1.10 (0.80-1.51)

Everyday 1.00 1.00

Meat (beef, pork, fowl et al.) No 1.32 (1.04-1.67) 1.41 (1.08-1.85)

1-2 times 1.13 (0.94-1.34) -

3-5 times 0.98 (0.81-1.19) -

Everyday 1.00 1.00

Breakfast Eating daily 1.00 1.00

Eating usually 1.07 (0.97-1.18) 0.97 (0.71-1.29)

Skipping usually 1.09 (0.94-1.27) 1.12 (0.70-1.75)

Skipping nearly 1.19 (1.03-1.41) 1.07 (0.71-1.61)

Data shown are odds ratio (95% CI) adjusted for gender, survey year, school grade, food intakes/week and breakfast by multiple logistic regression.

Group 1 included all subjects.

Group 2 included only no meat intake and daily meat intake per week.

Elementary school_lower means lower year elementary school students (grades 1st, 2nd, and 3rd).

Elementary school_upper means upper year elementary school students (grades 4th, 5th, and 6th).

OR, odds ratio; CI, confidence interval.

and high school students (8.0% and 9.0%, respectively) and female middle and high school students (5.1% and 7.6%, respectively).

This study also assessed the meat intake according to school age

(i.e., elementary, middle, and high school students). The frequency

of no meat intake was highest in middle school students (7.1%)

and daily meat intake was highest in high school students (8.3%)

(7)

(P<0.001). In a study involving Chinese adolescents, the research- ers showed that the highest frequencies of meat intake occurred at the age of first sperm production for males and menarche (first menstrual period) for females.

1

In other words, Chinese adoles- cents had the highest frequency of meat intake corresponding to the age of middle school students in Korea. On the contrary, the frequency of meat intake was the highest in high school and lowest in middle school age in this study. These results are reflecting the current situation in Korea where middle school students who have a relatively lower academic burden and increased interest in their appearance tend to limit their meat intake to lose weight to become more physically attractive, while high school students who have a heavier academic burden cannot limit their meat intake in order to maintain their health and energy to study.

In this study, the percentages of overweight (12.3%) and obese (11.1%) subjects were higher in those with no meat intake than with daily meat intake (8.1% overweight and 9.9% obese) (P<0.001).

Moreover, when considering the 386 subjects of overweight or obese among the 1,857 subjects with either no meat intake or daily meat intake as 100%, 58.0% had no meat intake while 42.0% had daily meat intake. Again, these results indicate higher percentages of obesity in the subjects with no meat intake (P<0.01).

Previous studies are also in agreement with author’s findings that the frequencies of overweight and obesity are higher in subjects with no meat intake

7,24

, and they provided a logical explanation of this observation, suggesting that the high protein content in meat provides prolonged satiety and relatively increased calories con- sumption compared to a vegetarian diet, eventually leading to la- tent benefits of suppressing obesity.

25

Moreover, several interven- tion studies on obesity management have shown better weight loss when following a high protein diet.

8-13

Meanwhile, some of the previous studies have shown that total meat consumption was associated with weight gain even after con- trolling for factors such as smoking, and gender.

4,5,26

Moreover, there are suggestions that when assessing the association between weight and meat intake, meat by itself should not be considered a factor because the effects of protein on weight are coming not only from meat consumption but also from other diet sources including dairy products and vegetables.

27-29

In Group 1, the OR of over- weight/obesity was 1.32 (95% CI, 1.04-1.67) for subjects with no

meat intake over daily meat intake. In Group 2, the OR of over- weight/obesity was 1.41 (95% CI, 1.08-1.85) for subjects with no meat intake over daily meat intake. Therefore, even after controlling for potential confounding variables, the results showed that meat consumption resulted in lower obesity percentages, directly rebut- ting previous results saying that meat consumption results in weight gain and supporting other previous results showing higher frequen- cy of overweight/obesity in the subjects with no meat intake.

Vegetables and fruits have similar nutritional characteristics, and people who consume lots of fruits tend to consume lots of vegeta- bles as well.

26

Individuals who consume a large amount of fruits and vegetables tend to have a lower consumption of meat (more specifically, processed meat associated with weight gain), saturated fat, and processed carbohydrates.

26,29

A few studies have shown that although fruit and vegetable consumption did not result in a weight gain, the effects of fruit and vegetable consumption on weight loss were not uniform among different studies. It has been claimed that since vegetables can be cooked and replace meat as a meal, they should be considered different from fruits, which are normally un- cooked and typically consumed as a part of dessert.

26

In this study, there was no significant association between the consumption of vegetables or fruits and overweight/obesity.

A previous study that evaluated the association between milk and dairy products and obesity showed either no effect or inverse pro- portional relationship

30

due to low body fat content.

31,32

However, along with concerns of lactose intolerance, allergic response, and bovine growth hormones and antibiotic use, the debate about the effect of dairy product on weight gain according to the amount and types of dairy product consumed continues. In particular, a previ- ous study has shown that the energy provided by milk and dairy products resulted in increased fat content and abdominal fat in male adolescents.

3

Similarly, in this study, the OR of overweight/obesity was 0.83 (95% CI, 0.69-0.99) in Group 1 and 0.61 (95% CI, 0.39- 0.96) in Group 2 for the subjects with no dairy product intake while using the subjects with a daily intake of dairy products as the reference group. Therefore, in future studies, the association of dif- ferent types of dairy products with obesity should be investigated.

Among other potential confounding factors, the OR of over-

weight/obesity was 1.38 (95% CI, 1.28-1.50) for males over fe-

males. This result agrees with a previous study showing a higher

(8)

frequency of obesity in males.

33

The OR was 0.84 (95% CI, 0.75- 0.95) for middle school students over lower year elementary school students (grades 1st, 2nd, and 3rd). Moreover, the OR was 0.44 (95% CI, 0.27-0.72) for subjects with instant noodle intake of 3–5 times a week over daily instant noodle intake, and the OR was 1.19 (95% CI, 1.03-1.41) for the subjects with a nearly skipping break- fast over daily breakfast consumption. Meanwhile, factors such as soft drink or fast food had no association with overweight/obesity.

The frequency of meat consumption in school-aged population was investigated and showed that even after controlling for poten- tial confounding factors, the OR of overweight/obesity was lower for the subjects with meat intake compared to those with no meat intake. Therefore, previous studies suggesting limited meat con- sumption for weight control are not entirely true. The author sug- gests the following steps based on this study results.

First, the wrong health belief held by the public about meat and obesity—in other words, vegetables and fruits have low calories and high fibers and therefore will prevent weight gain, while meat has high saturated fat and high calories and therefore will result in weight gain

25

—should be reconsidered. Moreover, through school health promotion/education, it needs to advertise to the students and their parents that balanced consumption of meat will not cause obesity.

Second, the school lunch system of the survey years of this study was already established, and even though the lunches were de- signed to contain meat for a balanced diet, some subjects had no meat intake. Therefore, at each school, they should monitor wheth- er or not meat is provided for student lunches and also whether or not the student actually consumes the meat.

More specifically, there are ongoing active discussions on provid- ing breakfast at school and an increased incidence of school-based food programs for students due to an increased number of both par- ents working and consequent after-school programs. Therefore, a researcher has to investigate and ensure if adolescents in their growth stage are consuming enough meat as a part of a balanced diet.

The key strengths of the study are a relatively larger-sized sample cohort and lower recall bias, using actual measurements of weight and height. Despite these strengths, a few limitations of this study should be considered.

First, the subjects of this study were not sampled by a random sampling, and it is difficult to generalize the findings of this study to

entire school-aged population. Therefore, future studies should uti- lize data from a sample survey that can represent a parameter and re- validate the association between meat intake and overweight/obesity.

Second, the survey question included the examples of meat as

“beef, pork, chicken, and etc.” and of fast food as “hamburgers, piz- za, fried food, and etc.” It can be inferred that processed meat was included as a part of fast food at responses. However, fish was not mentioned specifically, and it is hard to infer the category for the placement of fish from the responses of different individuals.

Therefore, future studies should provide a clearer definition of meat to obtain greater reliability for the measurement of meat in- take frequency.

Third, the interpretation of results from the dietary habit survey that puts different types of food that cannot be supplements of each other into a single group is most likely to be ambiguous. In other words, milk and dairy products, depending on their type, have dif- ferent sugar and fat content, and fruits and vegetables are food groups that cannot be supplements of each other regarding food function and calories. Therefore, these different types of food should be divided into different groups before performing the analysis.

Despite the limitations stated above, the author believe the data from this study assessing the association between meat intake and overweight/obesity in school-aged children will serve as funda- mental data for establishing school lunch policies or school health promotion/education. Furthermore, this author has also provided partial evidence to support the need for a change in the social belief of the relationship between meat consumption and obesity.

CONFLICTS OF INTEREST

The author declares no conflict of interest.

ACKNOWLEDGMENTS

I sincerely appreciate the kind assistance of the former medical

provincial fourth grade official, Hee Woo Lee, M.D., Ph.D., who al-

lowed me to use the data of the Seoul School Health Promotion

Center, which made this study possible.

(9)

REFERENCES

1. Yang M, Xue H, Duan R, Liu Y, Cheng G. Cross-sectional as- sociation between food rich in protein and pubertal develop- ment among children and adolescents in Chengdu City. Wei Sheng Yan Jiu 2015;44:43-8.

2. Coulson NS, Eiser C, Eiser JR. Nutrition education in the na- tional curriculum. Health Educ J 1998;57:81-8.

3. Naeeni MM, Jafari S, Fouladgar M, Heidari K, Farajzadegan Z, Fakhri M, et al. Nutritional knowledge, practice, and dietary habits among school children and adolescents. Int J Prev Med 2014;5(Suppl 2):171-8.

4. Bes-Rastrollo M, Sánchez-Villegas A, Gómez-Gracia E, Mar- tínez JA, Pajares RM, Martínez-González MA. Predictors of weight gain in a Mediterranean cohort: the Seguimiento Uni- versidad de Navarra Study. Am J Clin Nutr 2006;83:362-70.

5. Rosell M, Appleby P, Spencer E, Key T. Weight gain over 5 years in 21,966 meat-eating, fish-eating, vegetarian, and vegan men and women in EPIC-Oxford. Int J Obes (Lond) 2006;

30:1389-96.

6. Schulz M, Kroke A, Liese AD, Hoffmann K, Bergmann MM, Boeing H. Food groups as predictors for short-term weight changes in men and women of the EPIC-Potsdam cohort. J Nutr 2002;132:1335-40.

7. Paddon-Jones D, Westman E, Mattes RD, Wolfe RR, Astrup A, Westerterp-Plantenga M. Protein, weight management, and sa- tiety. Am J Clin Nutr 2008;87:1558S-61S.

8. Due A, Toubro S, Skov AR, Astrup A. Effect of normal-fat di- ets, either medium or high in protein, on body weight in over- weight subjects: a randomised 1-year trial. Int J Obes Relat Metab Disord 2004;28:1283-90.

9. Foster GD, Wyatt HR, Hill JO, McGuckin BG, Brill C, Mo- hammed BS, et al. A randomized trial of a low-carbohydrate diet for obesity. N Engl J Med 2003;348:2082-90.

10. Lasker DA, Evans EM, Layman DK. Moderate carbohydrate, moderate protein weight loss diet reduces cardiovascular dis- ease risk compared to high carbohydrate, low protein diet in obese adults: a randomized clinical trial. Nutr Metab (Lond) 2008;5:30.

11. Layman DK, Evans EM, Erickson D, Seyler J, Weber J, Bag-

shaw D, et al. A moderate-protein diet produces sustained weight loss and long-term changes in body composition and blood lipids in obese adults. J Nutr 2009;139:514-21.

12. Treyzon L, Chen S, Hong K, Yan E, Carpenter CL, Thames G, et al. A controlled trial of protein enrichment of meal replace- ments for weight reduction with retention of lean body mass.

Nutr J 2008;7:23.

13. Weigle DS, Breen PA, Matthys CC, Callahan HS, Meeuws KE, Burden VR, et al. A high-protein diet induces sustained reduc- tions in appetite, ad libitum caloric intake, and body weight despite compensatory changes in diurnal plasma leptin and ghrelin concentrations. Am J Clin Nutr 2005;82:41-8.

14. Ministry of Education. Manual of school health examination standard survey, 2009-2011. Seoul: Ministry of Education;

2009. p. 20-2.

15. Fung TT, Schulze M, Manson JE, Willett WC, Hu FB. Dietary patterns, meat intake, and the risk of type 2 diabetes in wom- en. Arch Intern Med 2004;164:2235-40.

16. Quatromoni PA, Copenhafer DL, D’Agostino RB, Millen BE.

Dietary patterns predict the development of overweight in women: The Framingham Nutrition Studies. J Am Diet Assoc 2002;102:1239-46.

17. Schulze MB, Fung TT, Manson JE, Willett WC, Hu FB. Di- etary patterns and changes in body weight in women. Obesity (Silver Spring) 2006;14:1444-53.

18. Héroux M, Janssen I, Lam M, Lee DC, Hebert JR, Sui X, et al.

Dietary patterns and the risk of mortality: impact of cardiore- spiratory fitness. Int J Epidemiol 2010;39:197-209.

19. Kesse-Guyot E, Bertrais S, Péneau S, Estaquio C, Dauchet L, Vergnaud AC, et al. Dietary patterns and their sociodemo- graphic and behavioural correlates in French middle-aged adults from the SU.VI.MAX cohort. Eur J Clin Nutr 2009;63:521-8.

20. Story M, Neumark-Sztainer D, French S. Individual and envi- ronmental influences on adolescent eating behaviors. J Am Diet Assoc 2002;102(Suppl 3):S40-51.

21. Lien N, Lytle LA, Klepp KI. Stability in consumption of fruit, vegetables, and sugary foods in a cohort from age 14 to age 21.

Prev Med 2001;33:217-26.

22. Lytle LA, Seifert S, Greenstein J, McGovern P. How do chil-

dren’s eating patterns and food choices change over time? re-

(10)

sults from a cohort study. Am J Health Promot 2000;14:222-8.

23. Arechavala T, Continente X, Pérez-Giménez A, Bartoll X, Sàn- chez-Martínez F, López MJ. Food consumption frequency and excess body weight in adolescents in the context of financial crisis in Barcelona (Spain). Gac Sanit 2016;30:457-63.

24. Halkjaer J, Sørensen TI, Tjønneland A, Togo P, Holst C, Heit- mann BL. Food and drinking patterns as predictors of 6-year BMI-adjusted changes in waist circumference. Br J Nutr 2004;

92:735-48.

25. Parker DR, Gonzalez S, Derby CA, Gans KM, Lasater TM, Carleton RA. Dietary factors in relation to weight change among men and women from two southeastern New England communities. Int J Obes Relat Metab Disord 1997;21:103-9.

26. Vergnaud AC, Norat T, Romaguera D, Mouw T, May AM, Travier N, et al. Meat consumption and prospective weight change in participants of the EPIC-PANACEA study. Am J Clin Nutr 2010;92:398-407.

27. Buijsse B, Feskens EJ, Schulze MB, Forouhi NG, Wareham NJ, Sharp S, et al. Fruit and vegetable intakes and subsequent changes in body weight in European populations: results from the project on Diet, Obesity, and Genes (DiOGenes). Am J Clin Nutr 2009;90:202-9.

28. Mirmiran P, Esmaillzadeh A, Azizi F. Dairy consumption and

body mass index: an inverse relationship. Int J Obes (Lond) 2005;29:115-21.

29. Liu S, Willett WC, Manson JE, Hu FB, Rosner B, Colditz G.

Relation between changes in intakes of dietary fiber and grain products and changes in weight and development of obesity among middle-aged women. Am J Clin Nutr 2003;78:920-7.

30. Dror DK, Allen LH. Dairy product intake in children and ado- lescents in developed countries: trends, nutritional contribu- tion, and a review of association with health outcomes. Nutr Rev 2014;72:68-81.

31. Moreno LA, Bel-Serrat S, Santaliestra-Pasías A, Bueno G.

Dairy products, yogurt consumption, and cardiometabolic risk in children and adolescents. Nutr Rev 2015;73 Suppl 1:8-14.

32. ESPGHAN Committee on Nutrition, Agostoni C, Braegger C, Decsi T, Kolacek S, Koletzko B, et al. Role of dietary factors and food habits in the development of childhood obesity: a commentary by the ESPGHAN Committee on Nutrition. J Pediatr Gastroenterol Nutr 2011;52:662-9.

33. Zaborskis A, Lagunaite R, Busha R, Lubiene J. Trend in eating

habits among Lithuanian school-aged children in context of

social inequality: three cross-sectional surveys 2002, 2006 and

2010. BMC Public Health 2012;12:52.

수치

Table 2. Proportion of underweight, normal, overweight, and obesity by frequency of meat intake
Table 4. Odds ratios of meat intake for overweight and above by multiple logistic regression Classification ≥ Overweight Group 1 (n= 3,225) Group 2 (n= 386) OR (95% CI)  OR (95% CI) Gender  Female 1.00 1.00 Male 1.38 (1.28-1.50)  1.18 (0.94-1.50) Survey ye

참조

관련 문서

The purpose of this study is to analyze the interest and self-confidence of middle school students in learning English grammar and to examine the

This study was conducted on elementary school children aged 11 to 13 from displaced North Korean (NK) families to compare their growth and nutritional status with those

Among teachers who responded to our questionnaires, 16.6% of elementary teachers, 26.7% of middle school teachers and 24.6% of high school teachers knew that replantation

Therefore, this study investigated the interest, satisfaction and participation in STEAM of middle school students centering on programs where music education

The purpose of this study is to analyze basic physical strength so that youth Taekwondo Poomsae players in middle school and high school can

Based on the results of this study, some implications for classes using online reading programs for elementary school students' English reading were

In this study, a family of middle school students the health, self-resilience, recreation and leisure satisfaction and satisfaction with school life were

The purpose of this study was to investigate the lower extremity muscle strength and student health of male middle school students. Twenty middle school