ABSTRACT
Background: There is limited information describing the presenting characteristics and dynamic clinical changes in severe acute respiratory syndrome coronavirus 2 (SARS-CoV-2) infection diagnosed in the early phase of illness. This study is a case series of patients with coronavirus disease 2019 (COVID-19) admitted to 11 hospitals in Korea.
Methods: Patients with confirmed SARS-CoV-2 infection by positive polymerase chain reaction (PCR) testing of respiratory specimens by active surveillance that were finally discharged between February 20 and April 30, 2020 were included. Patients were classified into mild and non-mild groups on initial admission according to oxygen demand and Sequential Organ Failure Assessment score, and the mild group was followed up and subgrouped into non-aggravation and aggravation groups.
Results: A total of 161 patients with SARS-CoV2 infection were enrolled. Among the mild group of 136 patients, 11.7% of patients experienced clinical aggravation during hospitalization, but there was no initial clinical parameter on admission predicting their aggravation. Fever (odds ratio [OR], 4.56), thrombocytopenia (OR, 12.87), fever (OR, 27.22) and lactate dehydrogenase (LDH) > 300 U/L (OR, 18.35), and CRP > 1 mg/dL (OR, 11.31) significantly indicated aggravation in the 1st, 2nd, 3rd, and 4th 5-day periods, respectively.
PCR positivity lasted for a median of 22 days and 32 days after the onset of illness in the non- aggravation and aggravation groups, respectively.
Conclusion: Old age was associated with early severe presentation. Clinical aggravation
Original Article
Received: Jul 10, 2020 Accepted: Aug 4, 2020 Address for Correspondence:
Sang-Won Park, MD, PhD
Department of Internal Medicine, Seoul Metropolitan Government-Seoul National University Boramae Medical Center, Seoul National University College of Medicine, 20 Boramae-ro 5-gil, Dongjak-gu, Seoul 07061, Korea.
E-mail: [email protected] Baek-Nam Kim, MD, PhD
Department of Internal Medicine, Inje University Sanggye Paik Hospital, 1342 Dongil- ro, Nowon-gu, Seoul 01757, Korea.
E-mail: [email protected]
© 2020 The Korean Academy of Medical Sciences.
This is an Open Access article distributed under the terms of the Creative Commons Attribution Non-Commercial License (https://
creativecommons.org/licenses/by-nc/4.0/) which permits unrestricted non-commercial use, distribution, and reproduction in any medium, provided the original work is properly cited.
ORCID iDs Hyeon Jeong Suh
https://orcid.org/0000-0001-7289-9586 Deok Hee Kim
https://orcid.org/0000-0001-7593-7461 Eun Young Heo
https://orcid.org/0000-0003-3803-4903 Hyun Woo Lee
https://orcid.org/0000-0003-4379-0260 Jung-Kyu Lee
https://orcid.org/0000-0001-5060-7255
Hyeon Jeong Suh ,1,2 Deok Hee Kim ,3 Eun Young Heo ,1,2 Hyun Woo Lee ,1,2 Jung-Kyu Lee ,1,2 Chang-Seop Lee ,4 Mijeong Kim ,5 Yong Duk Jeon ,6 Jin-Won Chung ,7 Young Keun Kim ,8 Pyo Jin Shin ,9 Mi Suk Lee ,10
Jin Suk Kang ,11 Myung Jin Lee ,12 Baek-Nam Kim ,12 and Sang-Won Park 1,2
1Department of Internal Medicine, Seoul National University College of Medicine, Seoul, Korea
2 Department of Internal Medicine, Seoul Metropolitan Government-Seoul National University Boramae Medical Center, Seoul, Korea
3Department of Internal Medicine, Gyeonggi Provincial Medical Center Paju Hospital, Paju, Korea
4Department of Internal Medicine, Jeonbuk National University Medical School, Jeonju, Korea
5Department of Internal Medicine, Gyeonggi Provincial Medical Center Suwon Hospital, Suwon, Korea
6Department of Internal Medicine, Kangwon National University School of Medicine, Chuncheon, Korea
7Department of Internal Medicine, Chung-Ang University Hospital, Seoul, Korea
8Department of Internal Medicine, Yonsei University Wonju College of Medicine, Wonju, Korea
9Department of Internal Medicine, Gangwon-do Wonju Medical Center, Wonju, Korea
10Department of Internal Medicine, Kyung Hee University Hospital, Seoul, Korea
11Department of Internal Medicine, Inje University Busan Paik Hospital, Busan, Korea
12Department of Internal Medicine, Inje University Sanggye Paik Hospital, Seoul, Korea
Clinical Characteristics of COVID-19:
Clinical Dynamics of Mild Severe Acute Respiratory Syndrome Coronavirus
2 Infection Detected by Early Active Surveillance
Infectious Diseases,
Microbiology & Parasitology
Chang-Seop Lee
https://orcid.org/0000-0002-2897-2202 Mijeong Kim
https://orcid.org/0000-0002-4456-206X Yong Duk Jeon
https://orcid.org/0000-0002-4588-4781 Jin-Won Chung
https://orcid.org/0000-0003-4811-6056 Young Keun Kim
https://orcid.org/0000-0002-2120-6265 Pyo Jin Shin
https://orcid.org/0000-0003-4692-8878 Mi Suk Lee
https://orcid.org/0000-0001-8951-5032 Jin Suk Kang
https://orcid.org/0000-0002-4137-5453 Myung Jin Lee
https://orcid.org/0000-0001-8172-8025 Baek-Nam Kim
https://orcid.org/0000-0001-5551-2132 Sang-Won Park
https://orcid.org/0000-0002-0550-1897 Funding
This study was supported by grant no. 04- 2020-0210 from the SNUH Research Fund (SWP).
Disclosure
The authors have no potential conflicts of interest to disclose.
Author Contributions
Conceptualization: Suh HJ, Lee HW, Lee JK, Lee CS, Kim M, Kim YK, Kim BN, Park SW.
Data curation: Suh HJ, Kim DH, Heo EY, Lee HW, Lee JK, Lee CS, Kim M, Jeon YD, Chung JW, Jin SP, Lee MS, Kang JS, Lee MJ, Kim BN.
Formal analysis: Suh HJ. Funding acquisition:
Park SW. Methodology: Heo EY, Lee CS, Kim BN, Park SW. Project administration: Kim BN, Park SW. Resources: Kim DH, Jeon YD, Chung JW, Kim YK, Jin SP, Lee MS, Kang JS, Lee MJ, Kim BN. Supervision: Kim BN, Park SW. Writing - original draft: Suh HJ. Writing - review &
editing: Suh HJ, Kim BN, Park SW.
among asymptomatic or mild patients could not be predicted initially but was heralded by fever and several laboratory markers during the clinical course.
Keywords: COVID-19; SARS-CoV-2; Korea; Mild; Active Surveillance
INTRODUCTION
A newly emerging infectious disease, coronavirus disease 2019 (COVID-19), caused by severe acute respiratory syndrome coronavirus 2 (SARS-CoV-2) infection, was declared a Public Health Emergency of International Concern on 30 January and characterized as a pandemic on 11 March by the World Health Organization.1 The clinical spectrum of SARS-CoV-2 infection ranged from asymptomatic to rapidly fatal, requiring mechanical ventilation. According to initial data from China, 81% of patients with SARS-CoV-2 infection had mild or moderate disease, 14% had severe disease, and 5% had critical illness.2,3 The questions regarding who initially presents as severe and which patients among those with asymptomatic or mild presentation become severe or require oxygen therapy are important to clinicians. Answers to these questions will help clinicians prepare for the clinical course and necessary resources such as intensive care or transfer to appropriate facilities. However, studies describing the dynamic change in clinical and laboratory variables among patients initially presenting asymptomatic or mild were rare, and these data are essential for clinicians caring for patients to assess and predict the status at a certain time point.
As COVID-19 is causing a worldwide pandemic, many studies regarding regional clinical features have been reported. The preparedness and strategies for the pandemic are different among countries, and the clinical characteristics of patients admitted to medical facilities seem to vary in different cohorts.2,4-6 Since the first case of COVID-19,7 Korea had a strategy of high volume diagnostic testing and early isolation accompanied by contact investigation,8,9 and the isolation was lifted after two consecutive negative polymerase chain reaction (PCR) assays from respiratory specimens,10 The results of this study might lead clinicians to observe the dynamic change in clinical manifestations from the early phase of SARS-CoV-2 infection.
In this study, we presented the temporal dynamic changes of clinical and laboratory variables in patients with asymptomatic or mild SARS-CoV-2 infection detected by early active surveillance. The results may help clinicians better understand the clinical course of COVID-19 and prepare for critical care.
METHODS
Study setting
This retrospective analysis was conducted on a multicenter database of all patients aged ≥ 18 years old with SARS-CoV-2 infection admitted to the isolation wards of 11 hospitals in Korea and finally discharged between February 20, 2020 and April 30, 2020. The 11 hospitals included Boramae Medical Center, Jeonbuk National University Hospital, Chung-Ang University Hospital, Gangwon- do Wonju Medical Center, Gyeonggi Provincial Medical Center Paju Hospital and Suwon Hospital, Inje University Pusan Paik Hospital, Inje University Sanggye Paik Hospital, Kangwon National University Hospital, Kyunghee University Hospital and Wonju Severance Christian Hospital.
There was no limitation of clinical severity for admission to the study hospitals.
Patients
Patients were defined as having SARS-CoV-2 infection if they had a positive real-time reverse transcription PCR result (rRT-PCR) targeting amplification of the E gene, RdRP gene and N gene. Both nasopharyngeal and throat swabs were obtained and mixed for upper respiratory specimens, and sputum or transtracheal aspirates were collected for lower respiratory specimens. After sample collection, RNA extraction and rRT-PCR procedures were performed according to the manufacturer's instructions. Test kits from 6 domestic commercial manufacturers (Green Cross, Yongin, Korea; Seegene, Seoul, Korea; Kogene, Seoul, Korea; Seoul Clinical Laboratories, Yongin, Korea; SD biosensor, Suwon, Korea; and Institute of Health and Environment, Chuncheon, Korea) were used. Negative conversion of SARS-CoV-2 infectivity was determined with two consecutive rRT-PCR negative results according to the Korea Centers for Disease Control and Prevention (KCDC) guidelines; thus, the patients were discharged from isolation. For patients who tested positive for SARS-CoV-2, follow-up respiratory samples were collected according to the KCDC guidelines.10 Otherwise, the interval of follow-up testing was determined by the clinicians in charge.
Data collection
Using a standardized case report form, we documented demographics, clinical and laboratory variables, underlying comorbidities, and final outcomes. We recorded daily changes in the dynamic variables, including the Sequential Organ Failure Assessment (SOFA) score. Therapeutic interventions, including oxygen therapies, mechanical ventilation and antiviral agents, were also recorded. The worst values of the variables during 24 hours of the initial admission or of a daily basis were used. We also assessed the time to SARS-CoV-2 RNA clearance in upper and lower respiratory specimens. Serial changes in laboratory blood tests were followed up for common variables, such as hemoglobin, white blood cell (WBC) count, platelet count, erythrocyte sedimentation rate (ESR), aspartate aminotransferase (AST), alanine aminotransferase (ALT), bilirubin, international normalized ratio (INR) of prothrombin time (PT), and serum creatinine.
Definitions
Regarding underlying comorbidities, hypertension, diabetes mellitus, chronic obstructive pulmonary disease (COPD) or bronchial asthma had a status of current medication or needing urgent maintenance medication. Chronic heart diseases included ischemic heart diseases, valvular heart diseases, congestive heart failure or arrhythmia on current medication. Chronic liver diseases included liver cirrhosis, chronic viral hepatitis, alcoholic liver disease or steatohepatitis. Febrile sense was subjectively expressed by patients, and fever was defined as an axillary temperature of 37.5°C or higher. In asymptomatic patients, the date of onset of illness was set as the date of initial diagnosis for SARS-CoV-2 infection.
Patients were initially classified into the mild group and non-mild group by evaluating disease severity during the first 24 hours after admission. The mild group was defined as a state with both no oxygen requirement and SOFA score ≤ 1 point. Otherwise, patients were classified as the non-mild group. The mild group was further classified into two subgroups during the clinical course of hospitalization in terms of oxygen requirement and SOFA score (aggravation versus non-aggravation groups) (Fig. 1). Aggravation was defined as a new oxygen requirement or SOFA score change to ≥ 2. The oxygen requirement was defined as the need for continuous oxygen demand for at least 24 hours. The change in cycle threshold (Ct) value of rRT-PCR testing over the hospital course was analyzed, and the Ct value of the RdRP gene among 3 genes was used.
Statistical analysis
Univariate analysis was performed to test for differences between groups using Student's t-test or Mann-Whitney test and the χ2 test or Fisher's exact test, depending on the variable type. A P value < 0.05 was considered statistically significant. Statistical analyses were performed using IBM SPSS Statistics, version 22.0 (IBM Corp., Armonk, NY, USA).
Ethics statement
This study was approved by the Institutional Review Board (IRB) at Boramae Medical Center (No. 10-2020-33), and informed consent was waived by the IRB because of the retrospective nature of the study. All personal identifiers were anonymized for confidentiality before data processing. This study was in compliance with the Helsinki Declaration.
RESULTS
Presenting characteristics of mild versus non-mild patients on admission During the study period of 10 weeks, a total of 161 COVID-19 patients were admitted and finally discharged after two consecutive negative rRT-PCR test results. Among them, 136 patients were in the asymptomatic or mild group (no oxygen requirement and SOFA score ≤ 1), and 25 (15.5%) patients were in the non-mild group (having oxygen requirement or SOFA score
≥ 2) (Fig. 2). The comparison between these two groups showed some differences (Table 1).
The non-mild group was associated with older age (median 57 years vs. 41 years; P < 0.001), comorbidities such as hypertension (36.0% vs. 14.7%; P = 0.011) and diabetes (20.0% vs.
5.9%; P = 0.017), and patients from outbreaks involving two or more infected cases (56.0%
vs. 33.1%; P = 0.029). For clinical manifestations, subjective (48.0% vs. 27.2%) and objective (68.0% vs. 30.1%) fever, cough (68.0% vs. 42.6%), dyspnea (60.0% vs. 4.4%), diarrhea (28.0%
vs. 10.3%), other gastrointestinal symptoms (40.0% vs. 14.0%) and other systemic symptoms (24.0% vs. 2.9%) were significantly associated with the non-mild group. For laboratory findings, lymphopenia, anemia, and elevations of AST, ALT, total bilirubin, LDH, CRP, procalcitonin, ESR, and PT were more frequently observed in the non-mild group. Pneumonic
Mild group
(n = 136) Non-mild group
(n = 25)
Non-aggravation group
(n = 120) Aggravation group
(n = 16)
SOFA ≥ 2 or O2 requirement during hospitalization
SOFA ≥ 2 or O2 requirement
SOFA ≤ 1 and no O2 requirement during hospitalization
SOFA ≤ 1 and no O2 requirement
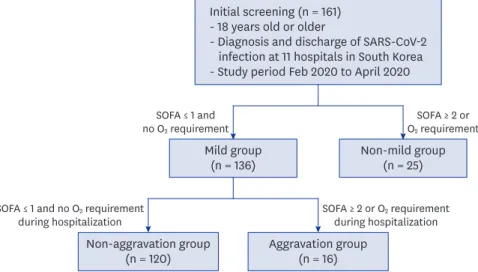
Initial screening (n = 161) - 18 years old or older
- Diagnosis and discharge of SARS-CoV-2 infection at 11 hospitals in South Korea - Study period Feb 2020 to April 2020
Fig. 1. Study design. A total of 161 patients were enrolled, with 136 patients in the mild group and 25 patients in the non-mild group. The mild group was subgrouped into the non-aggravation group of 120 patients and the aggravation group of 16 patients during hospitalization.
SARS-CoV-2 = severe acute respiratory syndrome coronavirus 2, SOFA = Sequential Organ Failure Assessment.
infiltration on simple chest X-ray or computed tomography was more prominent in the non- mild group (92.0% vs. 29.4%). Multivariate analysis showed that age (P = 0.028), dyspnea (P = 0.003) and elevated CRP level (P = 0.004) were significantly associated with initial non-mild presentation (Supplementary Table 1).
One patient died (1/161, 0.6%) (Fig. 1). A 92-year-old man who was diagnosed in a facility outbreak was admitted with thrombocytopenia, pneumonia, and elevated levels of bilirubin, CRP and creatinine. Oxygen requirement occurred on the 3rd hospital day. Considering his comorbidity and old age, the patient and his family did not want invasive therapy, and the patient died on the 10th hospital day under noninvasive supportive care.
Dynamic clinical course of the mild group on admission Basic characteristics of the patients
The 136 patients with asymptomatic or mild presentation were followed until their final discharge. Over a median hospitalization of 19 days (interquartile range [IQR], 15–27), 7 of 136 patients (5.1%) showed a new need for oxygen support (4 of low-flow, 1 of high-flow and 2 of mechanical ventilator), and 9 patients (6.6%) showed isolated aggravation of the SOFA score to ≥ 2 meeting the sepsis criteria. Therefore, 16 of 136 patients (11.7%) experienced episodes of clinical aggravation during their hospital stay (Fig. 2). There was no mortality in this group.
Basic characteristics on admission could not differentiate the non-aggravation group (n = 120) from the aggravation group (n = 16), except fever and myalgia in the univariate analysis, which were more common in the aggravation group (Table 2). The duration of hospitalization was longer in the aggravation group (median, 19 days vs. 29 days; P = 0.006).
Ten patients remained asymptomatic until discharge. Their median age was 30 years (range, 19–72). Except for one patient with a history of hypertension and cerebrovascular disease,
Mild group
No. of patients in O2 requirement group at baseline
No. of patients
in O2
requirement group during clinical course
Oxygen therapy SOFAscore
Ambient air
Ambient air
Low-flow
Low-flow
High-flow
High-flow
Invasive
Invasive
Death
Non-mild group
≥ 2
≥ 2
≤ 1 ≤ 1 ≥ 2 ≤ 1 ≥ 2 ≤ 1 ≥ 2
≤ 1
≥ 2
≤ 1
≥ 2
≤ 1
≥ 2
≤ 1
9 4
120
1 1 13
3 3
1
2 1
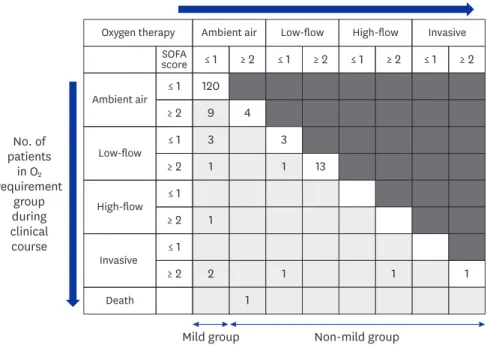
1
1 1
Fig. 2. Severity of patients based on oxygen requirement and SOFA score at baseline and during clinical course. In the initial mild group, a new need for oxygen therapy occurred in 7 patients (4 of low-flow, 1 of high-flow and 2 of mechanical ventilator) during the clinical course.
SOFA = Sequential Organ Failure Assessment.
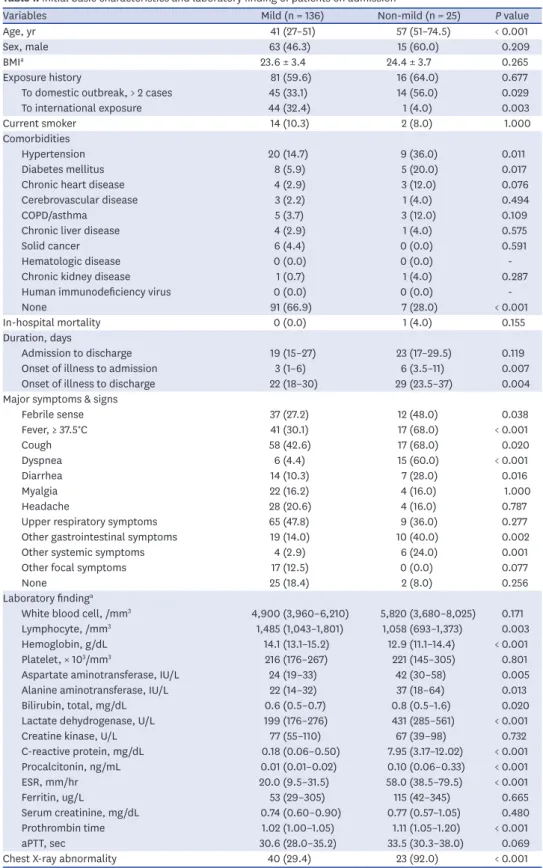
Table 1. Initial basic characteristics and laboratory finding of patients on admission
Variables Mild (n = 136) Non-mild (n = 25) P value
Age, yr 41 (27–51) 57 (51–74.5) < 0.001
Sex, male 63 (46.3) 15 (60.0) 0.209
BMIa 23.6 ± 3.4 24.4 ± 3.7 0.265
Exposure history 81 (59.6) 16 (64.0) 0.677
To domestic outbreak, > 2 cases 45 (33.1) 14 (56.0) 0.029
To international exposure 44 (32.4) 1 (4.0) 0.003
Current smoker 14 (10.3) 2 (8.0) 1.000
Comorbidities
Hypertension 20 (14.7) 9 (36.0) 0.011
Diabetes mellitus 8 (5.9) 5 (20.0) 0.017
Chronic heart disease 4 (2.9) 3 (12.0) 0.076
Cerebrovascular disease 3 (2.2) 1 (4.0) 0.494
COPD/asthma 5 (3.7) 3 (12.0) 0.109
Chronic liver disease 4 (2.9) 1 (4.0) 0.575
Solid cancer 6 (4.4) 0 (0.0) 0.591
Hematologic disease 0 (0.0) 0 (0.0) -
Chronic kidney disease 1 (0.7) 1 (4.0) 0.287
Human immunodeficiency virus 0 (0.0) 0 (0.0) -
None 91 (66.9) 7 (28.0) < 0.001
In-hospital mortality 0 (0.0) 1 (4.0) 0.155
Duration, days
Admission to discharge 19 (15–27) 23 (17–29.5) 0.119
Onset of illness to admission 3 (1–6) 6 (3.5–11) 0.007
Onset of illness to discharge 22 (18–30) 29 (23.5–37) 0.004
Major symptoms & signs
Febrile sense 37 (27.2) 12 (48.0) 0.038
Fever, ≥ 37.5°C 41 (30.1) 17 (68.0) < 0.001
Cough 58 (42.6) 17 (68.0) 0.020
Dyspnea 6 (4.4) 15 (60.0) < 0.001
Diarrhea 14 (10.3) 7 (28.0) 0.016
Myalgia 22 (16.2) 4 (16.0) 1.000
Headache 28 (20.6) 4 (16.0) 0.787
Upper respiratory symptoms 65 (47.8) 9 (36.0) 0.277
Other gastrointestinal symptoms 19 (14.0) 10 (40.0) 0.002
Other systemic symptoms 4 (2.9) 6 (24.0) 0.001
Other focal symptoms 17 (12.5) 0 (0.0) 0.077
None 25 (18.4) 2 (8.0) 0.256
Laboratory findinga
White blood cell, /mm3 4,900 (3,960–6,210) 5,820 (3,680–8,025) 0.171
Lymphocyte, /mm3 1,485 (1,043–1,801) 1,058 (693–1,373) 0.003
Hemoglobin, g/dL 14.1 (13.1–15.2) 12.9 (11.1–14.4) < 0.001
Platelet, × 103/mm3 216 (176–267) 221 (145–305) 0.801
Aspartate aminotransferase, IU/L 24 (19–33) 42 (30–58) 0.005
Alanine aminotransferase, IU/L 22 (14–32) 37 (18–64) 0.013
Bilirubin, total, mg/dL 0.6 (0.5–0.7) 0.8 (0.5–1.6) 0.020
Lactate dehydrogenase, U/L 199 (176–276) 431 (285–561) < 0.001
Creatine kinase, U/L 77 (55–110) 67 (39–98) 0.732
C-reactive protein, mg/dL 0.18 (0.06–0.50) 7.95 (3.17–12.02) < 0.001
Procalcitonin, ng/mL 0.01 (0.01–0.02) 0.10 (0.06–0.33) < 0.001
ESR, mm/hr 20.0 (9.5–31.5) 58.0 (38.5–79.5) < 0.001
Ferritin, ug/L 53 (29–305) 115 (42–345) 0.665
Serum creatinine, mg/dL 0.74 (0.60–0.90) 0.77 (0.57–1.05) 0.480
Prothrombin time 1.02 (1.00–1.05) 1.11 (1.05–1.20) < 0.001
aPTT, sec 30.6 (28.0–35.2) 33.5 (30.3–38.0) 0.069
Chest X-ray abnormality 40 (29.4) 23 (92.0) < 0.001
Data are presented as median (interquartile range), number (%) or mean ± standard deviation.
BMI = body mass index, COPD = chronic obstructive pulmonary diseases, ESR = erythrocyte sedimentation rate, aPTT = activated partial thromboplastin time.
aThere are some missing data in the denominators.
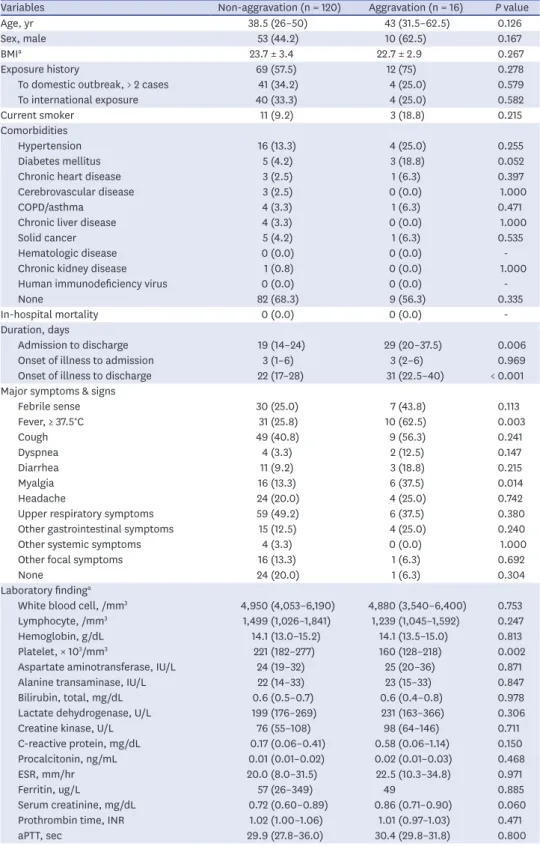
Table 2. Initial basic characteristics and laboratory findings of patients in the mild group
Variables Non-aggravation (n = 120) Aggravation (n = 16) P value
Age, yr 38.5 (26–50) 43 (31.5–62.5) 0.126
Sex, male 53 (44.2) 10 (62.5) 0.167
BMIa 23.7 ± 3.4 22.7 ± 2.9 0.267
Exposure history 69 (57.5) 12 (75) 0.278
To domestic outbreak, > 2 cases 41 (34.2) 4 (25.0) 0.579
To international exposure 40 (33.3) 4 (25.0) 0.582
Current smoker 11 (9.2) 3 (18.8) 0.215
Comorbidities
Hypertension 16 (13.3) 4 (25.0) 0.255
Diabetes mellitus 5 (4.2) 3 (18.8) 0.052
Chronic heart disease 3 (2.5) 1 (6.3) 0.397
Cerebrovascular disease 3 (2.5) 0 (0.0) 1.000
COPD/asthma 4 (3.3) 1 (6.3) 0.471
Chronic liver disease 4 (3.3) 0 (0.0) 1.000
Solid cancer 5 (4.2) 1 (6.3) 0.535
Hematologic disease 0 (0.0) 0 (0.0) -
Chronic kidney disease 1 (0.8) 0 (0.0) 1.000
Human immunodeficiency virus 0 (0.0) 0 (0.0) -
None 82 (68.3) 9 (56.3) 0.335
In-hospital mortality 0 (0.0) 0 (0.0) -
Duration, days
Admission to discharge 19 (14–24) 29 (20–37.5) 0.006
Onset of illness to admission 3 (1–6) 3 (2–6) 0.969
Onset of illness to discharge 22 (17–28) 31 (22.5–40) < 0.001
Major symptoms & signs
Febrile sense 30 (25.0) 7 (43.8) 0.113
Fever, ≥ 37.5°C 31 (25.8) 10 (62.5) 0.003
Cough 49 (40.8) 9 (56.3) 0.241
Dyspnea 4 (3.3) 2 (12.5) 0.147
Diarrhea 11 (9.2) 3 (18.8) 0.215
Myalgia 16 (13.3) 6 (37.5) 0.014
Headache 24 (20.0) 4 (25.0) 0.742
Upper respiratory symptoms 59 (49.2) 6 (37.5) 0.380
Other gastrointestinal symptoms 15 (12.5) 4 (25.0) 0.240
Other systemic symptoms 4 (3.3) 0 (0.0) 1.000
Other focal symptoms 16 (13.3) 1 (6.3) 0.692
None 24 (20.0) 1 (6.3) 0.304
Laboratory findinga
White blood cell, /mm3 4,950 (4,053–6,190) 4,880 (3,540–6,400) 0.753
Lymphocyte, /mm3 1,499 (1,026–1,841) 1,239 (1,045–1,592) 0.247
Hemoglobin, g/dL 14.1 (13.0–15.2) 14.1 (13.5–15.0) 0.813
Platelet, × 103/mm3 221 (182–277) 160 (128–218) 0.002
Aspartate aminotransferase, IU/L 24 (19–32) 25 (20–36) 0.871
Alanine transaminase, IU/L 22 (14–33) 23 (15–33) 0.847
Bilirubin, total, mg/dL 0.6 (0.5–0.7) 0.6 (0.4–0.8) 0.978
Lactate dehydrogenase, U/L 199 (176–269) 231 (163–366) 0.306
Creatine kinase, U/L 76 (55–108) 98 (64–146) 0.711
C-reactive protein, mg/dL 0.17 (0.06–0.41) 0.58 (0.06–1.14) 0.150
Procalcitonin, ng/mL 0.01 (0.01–0.02) 0.02 (0.01–0.03) 0.468
ESR, mm/hr 20.0 (8.0–31.5) 22.5 (10.3–34.8) 0.971
Ferritin, ug/L 57 (26–349) 49 0.885
Serum creatinine, mg/dL 0.72 (0.60–0.89) 0.86 (0.71–0.90) 0.060
Prothrombin time, INR 1.02 (1.00–1.06) 1.01 (0.97–1.03) 0.471
aPTT, sec 29.9 (27.8–36.0) 30.4 (29.8–31.8) 0.800
Chest X-ray abnormality 34 (28.3) 6 (37.5) 0.450
Data are presented as median (interquartile range), number (%) or mean ± standard deviation.
BMI = body mass index, COPD = chronic obstructive pulmonary diseases, ESR = erythrocyte sedimentation rate, aPTT = activated partial thromboplastin time.
aThere are some missing data in the denominators.
the other patients had no underlying disease. The median duration from admission to negative conversion of rRT-PCR testing was 11 days (range, 6–21 days). One patient remained asymptomatic despite the presence of initial pneumonic infiltration on chest X-ray.
Clinical aggravation and oxygen requirement
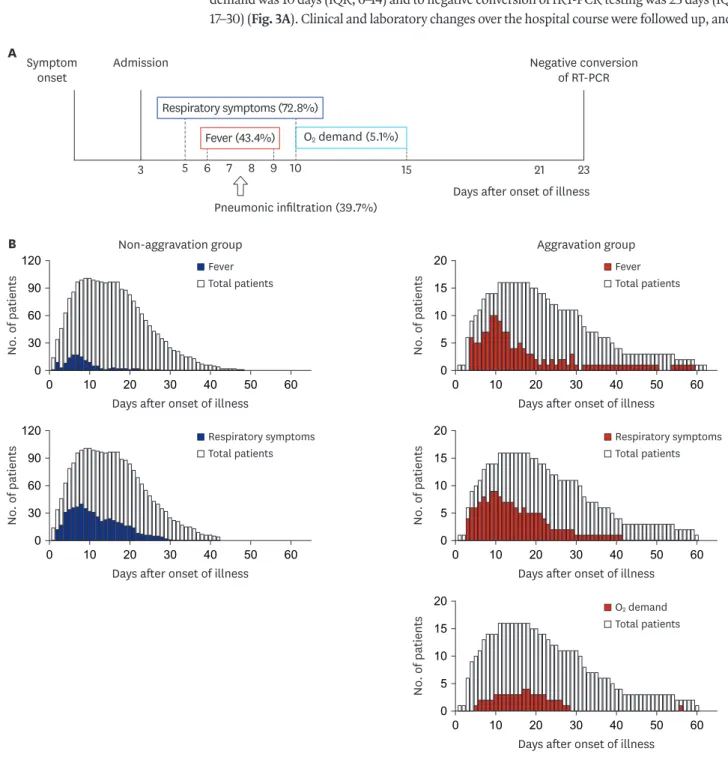
The median time from onset of illness to first hospital admission was 3 days (IQR, 1–6), to oxygen demand was 10 days (IQR, 6–14) and to negative conversion of rRT-PCR testing was 23 days (IQR, 17–30) (Fig. 3A). Clinical and laboratory changes over the hospital course were followed up, and
00 30 60 90 120
10
No. of patients
Days after onset of illness B
20 30 40 50 60
Aggravation group Non-aggravation group
00 5 10 20
10
No. of patients
Days after onset of illness
20 30 40 50 60
15 Fever
Total patients
Fever Total patients
00 30 60 90 120
10
No. of patients
Days after onset of illness
20 30 40 50 60 00
5 10 20
10
No. of patients
Days after onset of illness
20 30 40 50 60
15 Respiratory symptoms
Total patients
Respiratory symptoms Total patients
00 5 10 20
10
No. of patients
Days after onset of illness
20 30 40 50 60
15
O2 demand Total patients
A Symptom
onset Admission
Respiratory symptoms (72.8%)
Pneumonic infiltration (39.7%)
3 5 6 7 8 9 10 15 21 23
Negative conversion of RT-PCR
Days after onset of illness O2 demand (5.1%)
Fever (43.4%)
Fig. 3. Timeline after onset of illness of the initial mild group on admission. (A) Overall clinical course of the mild group. New respiratory symptoms, fever (> 37.5°C) and new oxygen demand occurred at median 5, 6 and 10 days after onset of illness, and the prevalence were 72.8%, 43.4% and 5.1%, respectively. (B) Dynamic changes in respiratory symptoms, fever and oxygen demand in the non-aggravation and aggravation groups. In the aggravation group, the parameters were mostly resolved after 3 weeks of illness onset, and they were related to a longer period of polymerase chain reaction positivity.
RT-PCR = reverse transcription polymerase chain reaction.
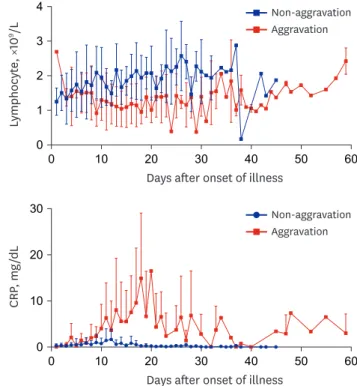
there were significant differences at some time points in fever, lymphocytes, platelets, bilirubin, LDH, CRP and serum creatinine between the non-aggravation and aggravation groups (Figs. 3B, 4 and Supplementary Table 2). Further multivariate analysis on these parameters at 5-day intervals after the onset of illness showed that fever (odds ratio [OR], 4.56; 95% confidence interval [CI], 1.06–19.71; P = 0.042) in the 1st 5-day period, thrombocytopenia (platelet count < 130,000/mm3; OR, 12.87; 95% CI, 1.87–88.59; P = 0.009) in the 2nd 5-day period, fever (OR, 27.22; 95% CI, 3.67–
202.04; P = 0.001) and LDH > 300 U/L (OR, 18.35; 95% CI, 1.98–170.39; P = 0.010) in the 3rd 5-day period, and CRP > 1 mg/dL (OR, 11.31; 95% CI, 1.78–71.93; P = 0.010) in the 4th 5-day interval were associated with the aggravation group (Table 3).
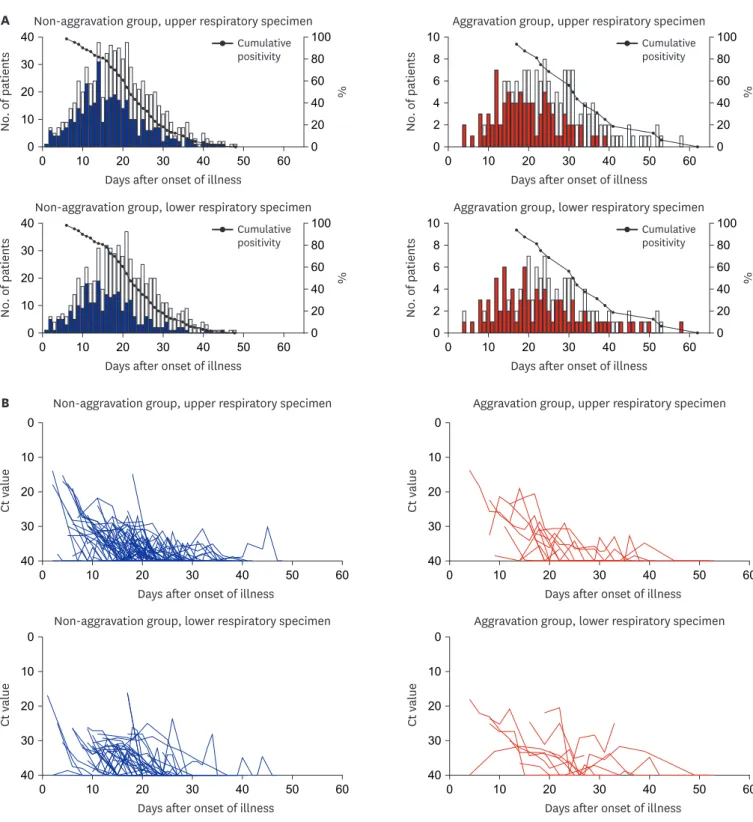
Positivity and Ct values of rRT-PCR testing
The overall trend of rRT-PCR positivity in the respiratory specimen over time after hospitalization in all mild group patients and serial Ct values in rRT-PCR testing of 61 patients in the non- aggravation group and 12 patients in the aggravation group were analyzed (Fig. 5). The median duration between the first positive PCR test and the final two serial negative PCR tests was shorter
00 5 10 15 20 25
10 WBC, ×109/L
Days after onset of illness
20 30 40 50 60 00
1 2 3 4
10 Lymphocyte, ×109/L
Days after onset of illness
20 30 40 50 60
Non-aggravation Aggravation Non-aggravation
Aggravation
00 200 400 600
10 Platelet, ×109/L
Days after onset of illness
20 30 40 50 60 0
10 20 30
10 0
CRP, mg/dL
Days after onset of illness
20 30 40 50 60
Non-aggravation Aggravation
Non-aggravation Aggravation Non-aggravation Aggravation
00 200 400 600 800
10
LDH, U/L
Days after onset of illness
20 30 40 50 60
Fig. 4. Dynamic changes in laboratory parameters. There were significant differences between the two groups in lymphocytes, platelets, total bilirubin and CRP on the 6–10th day of illness and LDH on the 11–15th day of illness.
WBC = white blood cell, LDH = lactate dehydrogenase, CRP = C-reactive protein.
in the non-aggravation group (22 days [IQR, 17–28] vs. 31.5 days [IQR, 23.5–40.5]) than in the aggravation group. The cumulative positivity of rRT-PCR testing at days 7, 14, 21 and 28 after onset of illness was 98.3%, 81.7%, 54.2% and 23.3% in the non-aggravation group and 100%, 100%, 87.5% and 68.7% in the aggravation groups (Fig. 5A). The level of Ct values between the two groups was not significantly different (Fig. 5B and Supplementary Table 3).
Antiviral therapy
Several antiviral agents were empirically used based on the decision of each physician in charge of patients. Lopinavir/ritonavir were the most frequently used drugs in both the non-aggravation and aggravation groups (39.2% vs. 81.3%), followed by hydroxychloroquine (13.3% vs. 31.3%). Four patients in the aggravation group were registered in a randomized remdesivir trial.
DISCUSSION
The overall clinical course of SARS-CoV-2 infection has been described by multiple studies from several countries,2,3,11,12 and the current consensus is that the majority of infections have a mild course. Early studies from China showed that 81% of patients with SARS- CoV-2 infection had mild or moderate disease, 14% had severe disease, and 5% had critical illness.3 Factors contributing to severe illness are known to be old age and certain underlying comorbidities, such as hypertension and diabetes.13 In some series of hospitalized patients, shortness of breath developed a median of 5 to 8 days after initial symptom onset, and its occurrence is suggestive of worsening disease.14 However, early reports on the clinical features of COVID-19 had limitations in assessing the natural course of the infection due to various degrees of selection bias for the subject patients. Areas with medical conditions overwhelmed by a sudden surge of COVID-19 patients might see more severe patients.4 There were reports about asymptomatic or mild COVID-19 cases from nonhospital community isolation facilities called ‘Living and treatment centers’ in Korea.5,15 Although those patients provided unique chances to observe the clinical characteristics of initial asymptomatic or mild cases of COVID-19, the criteria for admission to those facilities significantly limited the patients to mild cases with age restriction and no underlying comorbidity or well- controlled chronic diseases.16 These criteria may be used to select low-risk populations for complications in COVID-19 care. The clinical courses of those patients were all uneventful, but their temporal dynamic changes are unknown.
Our cohort in this study showed that 15.5% (25/161) of patients initially presented as non-mild. Old age is known to be associated with severe complications and mortality in COVID-19. Our results suggested that old age (median, 57 years; IQR, 51.0–74.5 years) was also associated with early severe presentation, and 84% of non-mild patients had oxygen demand (Fig. 2). Dyspnea (60.0%) and elevated levels of CRP (median, 7.35 mg/dL; IQR, Table 3. Indicators of clinical aggravation among COVID-19 patients with initial mild presentation at 5-day intervals after onset of illness in multivariate analysis Days after onset of
illness Fever,
> 37.5°C P value Platelet count,
< 130,000/mm3 P value LDH,
> 300 U/L P value CRP,
> 1 mg/dL P value
1–5th 4.56 (1.06–19.71) 0.042 - - - - - -
6–10th - - 12.87 (1.87–88.59) 0.009 - - - -
11–15th 27.22 (3.67–202.04) 0.001 - - 18.35 (1.98–170.39) 0.010 - -
16–20th - - - - - - 11.31 (1.78–71.93) 0.010
Data are presented as odds ratio (95% confidence interval).
COVID-19 = coronavirus disease 2019, LDH = lactate dehydrogenase, CRP = C-reactive protein.
3.17–12.02) indicated severe presentation and could be used to assess patients with COVID-19 for potential oxygen therapy.
00 10 20 30 40
0 20 40 60 100 80
10
No. of patients %
Days after onset of illness
A Non-aggravation group, upper respiratory specimen
20 30 40 50 60
Cumulative positivity
Aggravation group, upper respiratory specimen
00 2 4 6 10
0 20 40 60 100 80
10
No. of patients %
Days after onset of illness
20 30 40 50 60
8
Cumulative positivity
Non-aggravation group, lower respiratory specimen Cumulative positivity
00 10 20 30 40
0 20 40 60 100 80
10
No. of patients %
Days after onset of illness
20 30 40 50 60
Aggravation group, lower respiratory specimen Cumulative positivity
00 2 4 6 10
0 20 40 60 100 80
10
No. of patients %
Days after onset of illness
20 30 40 50 60
8
B
400 30 20 10 0
10
Ct value
Days after onset of illness
20 30 40 50 60 400
30 20 10 0
10
Ct value
Days after onset of illness
20 30 40 50 60
Non-aggravation group, upper respiratory specimen Aggravation group, upper respiratory specimen
0 10
Ct value
Days after onset of illness
20 30 40 50 60 400
30 20 10 0
10
Ct value
Days after onset of illness
20 30 40 50 60
40 30 20 10 0
Non-aggravation group, lower respiratory specimen Aggravation group, lower respiratory specimen
Fig. 5. Dynamic changes in rRT-PCR positivity for upper and lower respiratory specimens. (A) The cumulative positivity of rRT-PCR testing between the two groups. The cumulative positivity of rRT-PCR testing at days 7, 14, 21 and 28 after onset of illness was 98.3%, 81.7%, 54.2% and 23.3% in the non-aggravation group, respectively, and 100%, 100%, 87.5% and 68.7% in the aggravation groups, respectively. (B) The distribution of Ct values between the two groups. The mean Ct values surpassed 35 after 20 days of illness onset and remained at similar levels thereafter.
rRT-PCR = real-time reverse transcription polymerase chain reaction, Ct = cycle threshold.
Among the mild group on admission, 11.7% (16/136) of the patients experienced clinical aggravation during hospitalization, but no initial clinical factors could be identified to predict their aggravation during the clinical course. However, several variables, such as lymphopenia and elevated CRP and LDH levels, preceded the aggravation and could be used to monitor patient progression. Most of the oxygen demand occurred in the 1st and 2nd weeks after the onset of illness and rarely after the 3rd week. Therefore, even patients who are mild at presentation need to be followed up until the 3rd week for clinical aggravation with clinical and laboratory assessments. No mortality was observed in the mild group. If we follow clinical aggravation under good comprehension of the usual clinical course and provide optimal supportive care, the outcome may be excellent.
Viral load and its clearance are important considerations. Liu et al.17 reported that mild cases were found to have an early viral clearance, with 90% of these patients repeatedly testing negative on RT-PCR by day 10 post-onset from nasopharyngeal swab. However, our study showed that RT-PCR positivity lasted for a median of 22 to 32 days after the onset of illness in the initial mild patients, and the cumulative positivity of RT-PCR remained above 32.4%, even at day 28, which was longer than previously reported, especially in the aggravation group (Fig. 5B and Supplementary Table 3). Clinical aggravation was not related to the initial viral load in our study, but the conclusion was not clear because of our data limitations. However, PCR positivity does not indicate the persistence of viral infectivity.
This study only included fully discharged patients to try to identify the disease course as much as possible. As there was no surge of patients overwhelming the medical capacity surrounding the study hospitals, medical care in each hospital was within ordinary standard of care. Therefore, there might be little distortion of the natural course of disease due to a lack of medical resources. However, there were some limitations. First, as this study was a retrospective study, subjective symptoms could not be adequately serially quantified.
Second, the number of total cases was not enough to adequately perform the risk factor analysis. Third, individual hospitals used their test kits from six domestic commercial products. Although all of them were certified by KCDC, the absolute Ct values might be slightly different between the products. So, the interpretation of trend rather than absolute comparison of the Ct values is needed.
In conclusion, we observed a cohort of SARS-CoV-2-infected patients screened early by national policy. Old age was associated with early severe presentation. Clinical aggravation among asymptomatic or mild patients could not be predicted initially but was heralded by fever and several laboratory markers, such as thrombocytopenia, and elevated levels of CRP and LDH during the clinical course. Viral clearance took a median of 22 to 32 days after the onset of illness. Our study may help in understanding the natural course of mild COVID-19 and prepare for the possible next waves of disease.
ACKNOWLEDGMENTS
We thank Sun Min Kim (Department of Internal Medicine, Gyeonggi Provincial Medical Center Suwon Hospital, Suwon) and Su Yeon Kim (Department of Family Medicine, Gyeonggi Provincial Medical Center Suwon Hospital, Suwon) for the contribution and collection of patient information.
SUPPLEMENTARY MATERIALS
Supplementary Table 1
Risk factors for the initial non-mild presentation Click here to view
Supplementary Table 2
Indicators of clinical aggravation among COVID-19 patients with initial mild presentation at 5-day intervals after onset of illness, univariate analysis
Click here to view
Supplementary Table 3
The distribution of cycle threshold values of upper respiratory specimens between the non- aggravation and aggravation groups at 5-day intervals after the onset of illness
Click here to view
REFERENCES
1. World Health Organization. Coronavirus disease (COVID-2019) situation reports. https://www.who.int/
emergencies/diseases/novel-coronavirus-2019/situation-reports. Updated 2020. Accessed June 5, 2020.
2. Grasselli G, Zangrillo A, Zanella A, Antonelli M, Cabrini L, Castelli A, et al. Baseline characteristics and outcomes of 1591 Patients infected with SARS-CoV-2 admitted to ICUs of the Lombardy region, Italy.
JAMA 2020;323(16):1574-81.
PUBMED | CROSSREF
3. Wu Z, McGoogan JM. Characteristics of and important lessons from the coronavirus disease 2019 (COVID-19) outbreak in China: summary of a report of 72 314 cases from the Chinese Center for Disease Control and Prevention. JAMA 2020;323(13):1239-42.
PUBMED | CROSSREF
4. Grasselli G, Pesenti A, Cecconi M. Critical care utilization for the COVID-19 outbreak in Lombardy, Italy:
early experience and forecast during an emergency response. JAMA 2020;323(16):1545-6.
PUBMED | CROSSREF
5. Choe PG, Kang EK, Lee SY, Oh B, Im D, Lee HY, et al. Selecting coronavirus disease 2019 patients with negligible risk of progression: early experience from non-hospital isolation facility in Korea. Korean J Intern Med 2020;35(4):765-70.
PUBMED | CROSSREF
6. Bedford J, Enria D, Giesecke J, Heymann DL, Ihekweazu C, Kobinger G, et al. COVID-19: towards controlling of a pandemic. Lancet 2020;395(10229):1015-8.
PUBMED | CROSSREF
7. Kim JY, Choe PG, Oh Y, Oh KJ, Kim J, Park SJ, et al. The first case of 2019 novel coronavirus pneumonia imported into Korea from Wuhan, China: implication for infection prevention and control measures. J Korean Med Sci 2020;35(5):e61.
PUBMED | CROSSREF
8. Peck KR. Early diagnosis and rapid isolation: response to COVID-19 outbreak in Korea. Clin Microbiol Infect 2020;26(7):805-7.
PUBMED | CROSSREF
9. Park SY, Kim YM, Yi S, Lee S, Na BJ, Kim CB, et al. Coronavirus disease outbreak in call center, South Korea. Emerg Infect Dis 2020;26(8):1666-70.
PUBMED | CROSSREF
10. Korea Centers for Disease Control and Prevention. COVID-19 response guideline version 8-1 (in Korean).
http://ncov.mohw.go.kr/duBoardList.do?brdId=2&brdGubun=28. Updated 2020. Access June 5, 2020.
11. Chen N, Zhou M, Dong X, Qu J, Gong F, Han Y, et al. Epidemiological and clinical characteristics of 99 cases of 2019 novel coronavirus pneumonia in Wuhan, China: a descriptive study. Lancet 2020;395(10223):507-13.
PUBMED | CROSSREF
12. Wang D, Hu B, Hu C, Zhu F, Liu X, Zhang J, et al. Clinical characteristics of 138 hospitalized patients with 2019 novel coronavirus–infected pneumonia in Wuhan, China. JAMA 2020;323(11):1061-9.
PUBMED | CROSSREF
13. Zhou F, Yu T, Du R, Fan G, Liu Y, Liu Z, et al. Clinical course and risk factors for mortality of adult inpatients with COVID-19 in Wuhan, China: a retrospective cohort study. Lancet 2020;395(10229):1054-62.
PUBMED | CROSSREF
14. Gandhi RT, Lynch JB, Del Rio C, del Rio C. Mild or moderate Covid-19. N Engl J Med. Forthcoming 2020.
DOI: 10.1056/NEJMcp2009249.
PUBMED | CROSSREF
15. Kim GU, Kim MJ, Ra SH, Lee J, Bae S, Jung J, et al. Clinical characteristics of asymptomatic and symptomatic patients with mild COVID-19. Clin Microbiol Infect 2020;26(7):948.e1-3.
PUBMED | CROSSREF
16. Korea Centers for Disease Control and Prevention. COVID-19 response: Living and treatment centers guideline (in Korean). http://ncov.mohw.go.kr/duBoardList.do?brdId=2&brdGubun=28. Updated 2020.
Access June 5, 2020.
17. Liu Y, Yan LM, Wan L, Xiang TX, Le A, Liu JM, et al. Viral dynamics in mild and severe cases of COVID-19.
Lancet Infect Dis 2020;20(6):656-7.
PUBMED | CROSSREF