INTRODUCTION
The genetic and molecular heterogeneity of tumors is a major obstacle for cancer therapy.1 Heterogeneity elicits variable
re-sponses to anti-cancer drugs. In some tumor types, pharma-cological responses are not random but may be predicted by multi-featured molecular signatures. Thus, a molecular foot-print of a common set of mechanisms may exist within a spe-cific tumor subgroup.2
Based on the success of imatinib (Gleevec), a reductionist approach to inhibit the function of a single cancer-driving so-matic mutation has been a major strategy in the development
of anti-cancer drugs. These targeted anti-cancer therapies consist of small molecule inhibitors of the target protein or monoclonal antibodies targeted against various membrane-associated receptors. Although targeted therapies may blunt cancer-driving signaling events, intrinsic and acquired resis-tance generally occur due to a robust signaling network that can compensate for inhibition of a single perturbation.3 To
overcome this challenge, a proper model system that embrac-es the genetic heterogeneity and robust biological network of the original tumor is required.
Cancer cell lines traditionally serve as important models for oncology research, cancer drug discovery, and preclinical stud-ies.4,5 The primary somatic alteration is generally preserved in
a cancer cell line; further, cancer cell lines are usually able to form tumors in vivo. In addition, cancer cell lines demon-strate pharmacological characteristics similar to those of the primary tumor of origin. For example, cancer cell lines that ex-press mutant epidermal growth factor receptor (EGFR) show sensitivity to erlotinib treatment, similar to the tumor from which they were derived.6 Recent advances in genomic
tech-nologies provide unique opportunities to systematically iden-tify predictive biomarkers. These advances involve the
simul-Cancer Cell Line Panels Empower Genomics-Based
Discovery of Precision Cancer Medicine
Hyun Seok Kim
1,2, Yeo-Jin Sung
1, and Soonmyung Paik
21Brain Korea 21 PLUS Project for Medical Science and 2Severance Biomedical Science Institute, Yonsei University College of Medicine, Seoul,
Korea.
Since the first human cancer cell line, HeLa, was established in the early 1950s, there has been a steady increase in the number and tumor type of available cancer cell line models. Cancer cell lines have made significant contributions to the development of various chemotherapeutic agents. Recent advances in multi-omics technologies have facilitated detailed characterizations of the genomic, transcriptomic, proteomic, and epigenomic profiles of these cancer cell lines. An increasing number of studies employ the power of a cancer cell line panel to provide predictive biomarkers for targeted and cytotoxic agents, including those that are already used in clinical practice. Different types of statistical and machine learning algorithms have been developed to analyze the large-scale data sets that have been produced. However, much work remains to address the discrepancies in drug assay re-sults from different platforms and the frequent failures to translate discoveries from cell line models to the clinic. Nevertheless, continuous expansion of cancer cell line panels should provide unprecedented opportunities to identify new candidate targeted therapies, particularly for the so-called “dark matter” group of cancers, for which pharmacologically tractable driver mutations have not been identified.
Key Words: Targeted therapy, cancer genomics, biomarker, personalized medicine
Yonsei Med J 2015 Sep;56(5):1186-1198
http://dx.doi.org/10.3349/ymj.2015.56.5.1186 pISSN: 0513-5796 · eISSN: 1976-2437
Received: May 22, 2015
Corresponding author: Dr. Soonmyung Paik, Severance Biomedical Science
In-stitute, Yonsei University College of Medicine, 50-1 Yonsei-ro, Seodaemun-gu, Seoul 120-752, Korea.
Tel: 82-2-2228-0911, E-mail: [email protected] •The authors have no financial conflicts of interest. © Copyright: Yonsei University College of Medicine 2015
This is an Open Access article distributed under the terms of the Creative Com-mons Attribution Non-Commercial License (http://creativecomCom-mons.org/ licenses/ by-nc/3.0) which permits unrestricted non-commercial use, distribution, and repro-duction in any medium, provided the original work is properly cited.
taneous profiling of multi-omics features with drug responses or hypomorphic phenotypes in the same cell line. Steady-state multi-omics profiles include transcriptome abundance, single nucleotide variation, DNA copy number alteration, and pro-tein abundance. These profiles can be measured with technol-ogies, such as microarrays, next-generation sequencing (NGS), and reverse-phase protein arrays (RPPA). Profiles are often freely available from public domains. Due to advances in multi-omics technologies, cell-based phenotypic drug discovery strategies have recently gained traction for addressing the af-orementioned challenges.
In this review, we discuss the utility and caveats of establish-ed cancer cell lines for companion discovery of therapeutic tar-gets/drugs and enrollment biomarkers. In addition, we sum-marize publically available multi-omics data sets for cancer cell lines from major tumor types. We also provide an up-to-date summary of available computational algorithms and sta-tistical tools for analyzing large-scale screening data and per-forming further integrative genomics analyses for biomarker discovery. The identification of new therapeutic targets and agents linked to companion biomarkers may provide new op-tions for cancers that have failed to respond to the current an-ticancer drug discovery paradigm.7
HISTOLOGICAL PERSPECTIVE
A continuously growing cancer cell line is a critical resource for studying mechanisms of tumorigenesis and screening for antineoplastic agents. However, establishing such a line was a major challenge until the early 1950s. The first human cancer cell line, HeLa, was established from cervical cancer tissue isolated from a 30-year-old woman named Henrietta Lacks by the American scientist George Gey.8 Additional cancer cell
lines from different lineages, including lung,9 breast,10
ovari-an,11 melanoma,12 colorectal,13 pancreatic,14 and prostate, were
subsequently established.15,16 A significant number of these
cell lines are commercially available from several nonprofit biological resource centers, such as the American Type Culture Collection (ATCC).
These cancer cell lines have been assembled into panels, which span multiple tumor types, to facilitate disease-orient-ed screening of anticancer drugs.17-20 These panels have also
been useful for repositioning of cancer drugs.21-23 The most
fa-mous and widely used panel is the U.S. National Cancer Insti-tute (NCI) 60, which represents nine distinct tumor types (leu-kemia, melanoma, and cancers of the colon, lung, brain, kid-ney, ovary, breast, and prostate).24 A similar derivative, the
JFCR39 panel, replaced some of the lines in the NCI60 with six gastric cancer lines to represent one of the most common tu-mor types in East Asia. These focused panels have successfully facilitated the screening and lineage selectivity of first-line chemotherapeutic agents. However, cancer genome
sequenc-ing efforts have increased our understandsequenc-ing of tumor hetero-geneity. In addition, a novel class of anti-cancer agents that targets genuine somatic alterations has shown great success. Thus, a larger panel that embraces a significant portion of the recurrent genetic lesions and molecular diversity of cancer is needed. Several new panels have been developed to identify novel genetic and molecular enrollment biomarkers for che-motherapeutic agents. These panels include the Cancer Cell Line Encyclopedia (CCLE; 947 cancer lines),21 Genomics of
Drug Sensitivity in Cancer (GDSC; 639 cancer lines),22,25
Can-cer Target Discovery and Development (CTD2; 242 cancer
lines),23,26 Center for Molecular Therapeutics 1000 (CMT1000;
1000 cancer lines),5,6 and GlaxoSmithKline (GSK) (311 cancer
lines).27 The same approach has been extended to a concordant
discovery of biomarkers and small molecule lead compounds using a lung cancer cell line panel.28
PROS AND CONS OF CANCER CELL LINE
MODELS
Preclinical models of cancer typically include genetically en-gineered mouse (GEM) models, tumor grafts, and in vitro cell line models.18 Each of these models has unique strengths and
limitations. GEM models recapitulate the somatic alterations that drive human cancers; thus, these models are especially relevant for studying tumor initiation, progression, and vulner-abilities. To generate a GEM model, cancer-driving genetic ch-anges are introduced into the mouse germ line as a transgene or via mutagenesis. Xenograft tumor models are made by im-planting primary tumor tissues (patient-derived xenograft, PDX) or by inoculating established cancer cell lines orthotopically or subcutaneously into immunodeficient mice. Despite their clinical relevance, in vivo models are not adequate for large-scale studies. In addition, in vivo models cannot embrace the wide range of tumor diversity found in patients or for high-throughput screening of antineoplastic agents. These challeng-es can only be addrchalleng-essed by in vitro cell line models; however, recent controversy has surrounded the use of in vitro cell lines as a model system for cancer research. Specifically, cell lines are prone to artificial selection during prolonged culturing, which skews gene expression programs, including those relat-ed to multidrug resistance.29 One study that compared
muta-tions, changes in DNA copy number, and mRNA expression profiles found significant differences between ovarian cancer cell lines and high-grade serous ovarian tumor samples.30 In
contrast, a similar experimental approach revealed consistency between cell lines and primary samples in other studies of oth-er tumor types.4,21 Another potential concern with established
cell lines is cross-contamination.31 Further, the tumor
microen-vironment (TME) is completely absent in cell line models.32
Be-cause the stromal cells and immune cells of the TME make sig-nificant contributions to tumor development and metastasis,
the inability of cell lines to account for their effects is viewed as a limitation. There is also the potential for bias due to the un-derrepresentation of tumor types from certain lineages or ge-netic subtypes, such as prostate cancer lines and cancer lines expressing wild-type TP53.5 Finally, inconsistent data
regard-ing the response of a given cell line to a specific drug has been demonstrated across different platforms, raising concerns about reproducibility or reliability.33
Despite these caveats, a number of discoveries made from cell line models have clinical implications. For instance, the finding that the T790M mutation in EGFR underlies acquired resistance to EGFR inhibitors was made using a lung cancer cell line model.34 This information facilitated the recent
devel-opment of an irreversible second-generation EGFR inhibitor.35
Similarly, the finding that upregulation of the platelet-derived growth factor receptor B or mutation of NRAS causes acquired resistance to BRAF (V600E) inhibition was made in melanoma cell lines and validated in patients.36 Most importantly, a
num-ber of studies show that cancer cell lines reproducibly display clinically validated correlations between biomarkers and drug sensitivity.5,21,22,25
EVOLUTION OF METHODS FOR
ESTABLISHING AND CHARACTERIZING
CANCER LINES
Due to the discrepancies between in vivo and in vitro condi-tions, most primary cells are extremely difficult to grow directly in vitro. In addition, the in vivo growth environments required for tumors of different lineages are highly variable and general-ly unknown; thus, approaches based on trial-and-error are em-ployed until optimal growth conditions for cancer cells from each lineage are identified. Traditional methods for establish-ing permanent cell lines from lung cancer have been relatively well-documented. Briefly, resected tumor tissues are mechan-ically or enzymatmechan-ically dissociated into single cells. These cells are then grown on collagen-coated tissue culture dishes in spe-cialized media, such as ACL4 or HITES without fetal bovine serum (FBS), to remove contaminating normal cells. Cells are then grown on media with FBS to boost the growth of cancer cells.37 Unfortunately, this traditional approach has yielded
relatively low rates of establishing cancer cell lines, with only 4.5% and 9.7% success rates for lung and colon cancers, respec-tively.38,39
New methods that significantly increase the efficiency of es-tablishing cell lines have recently been introduced. One meth-od involves establishing cancer cell lines from PDX tumor models. Although this method is indirect, the end result has a higher success rate.39 Conditionally reprogrammed cell
cul-ture (CRC) methods have also been used to selectively amplify non-fibroblast epidermal cells in a mixed cell population co-cultured with irradiated feeder cells.40 Feeder cells together
with a Rho-associated protein kinase (ROCK) inhibitor allow selective proliferation of epithelial cells. This method enables matched tumor/normal cell line models to be generated from a single patient in a relatively short period of time compared to that developed with the traditional transgenesis method.41
Crystal, et al.42 recently applied the CRC method to effusions
and biopsies from lung cancer patients and reported a suc-cess rate of 50%. Using this CRC-generated cell line model, the investigators identified novel combinatorial therapeutic strate-gies for non-small cell lung cancers (NSCLCs) that have ac-quired resistance to targeted therapies. Three-dimensional or-ganoid culture models, in which resected tumor specimens or biopsies are grown in Matrigel supplemented with required tis-sue-specific growth factors, are another emerging method for establishing cell lines. This in vitro model mimics original tu-mor growth tu-more accurately than that of traditional two-di-mensional culture methods. Further, organoids successfully re-capitulate various features of primary tumors.43,44 Boj, et al.44
re-cently established human pancreatic organoids from resected tumors with a success rate of approximately 80%.
To identify the factors underlying tumor diversity, initial ef-forts focused on targeted sequencing of commonly mutated genes.15,45,46 Identified somatic DNA alterations from primary
and metastatic tumors as well as from established cancer cell lines have been deposited in the Catalog of Somatic Mutations in Cancer database. The information in this database is pro-fessionally curated with published literature regardless of the discovery platform.47 Recently innovated platforms in
micro-array and NGS technology have allowed more in-depth and high-resolution profiling of cancer variations, including gene expression changes in various cancer cell lines48,49 and genome
and exome level deciphering of DNA variations at relatively low cost. In addition, epigenomic50 and proteomic profiles are
also beginning to be employed for such analyses.51 These
multi-omics characterizations of cancer cell lines have been pursued for various lineages of tumors, including breast,46,52-54
lung,45,55-57 gastric,58 melanoma,12 pancreatic,14,59 colorectal,13,60
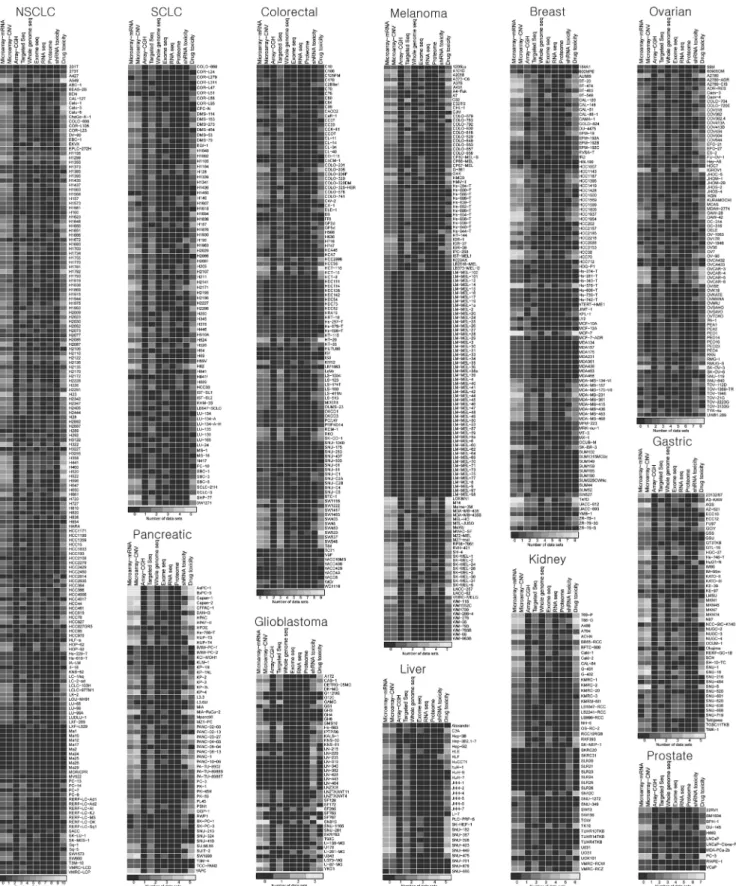
glioblastoma,61 ovarian,11,30 prostate,15,16 and pan-cancer
lines.19,21-23,25,49,62 The annotated established cancer cell lines for
12 major solid tumor types have been surveyed and summa-rized with respect to the type of assay and depth of corre-sponding orthogonal data sets (Fig. 1).
Beyond in vitro cell line models, genomic technologies fu-eled efforts to catalog somatic variations in thousands of tu-mor tissue specimens from various tutu-mor types.63 The Cancer
Genome Atlas (TCGA) project began in 2005 following the success of imatinib and the invention of NGS technologies. The first round of the project sought to discover the most highly recurrent mutations by sequencing at least 500 cases for each cancer type, which initially included nine major tumor types. The TCGA has now expanded to more than 30 tumor types and has also begun to characterize hundreds of rare tumor types. These data led to high-resolution mapping of somatic
altera-tions in major tumor types, including glioblastoma, ovarian carcinoma, colorectal cancer, lung squamous cancer, breast cancer, acute myeloid leukemia, endometrial cancer, kidney
cancer, bladder cancer, lung adenocarcinoma, and gastric can-cer (http://cancan-cergenome.nih.gov). Importantly, all of the multi-level discoveries from the TCGA are publically available
Fig. 1. A compendium of established cancer cell line models and the number of associated multi-omics data sets are represented as heatmaps for each of the 12 major tumor types. See Table 1 for the list of relevant studies that were used to generate this figure.
and searchable through cBioPortal (http://www.cbioportal. org).64
UTILITY OF CANCER CELL LINE PANELS:
DRUG DISCOVERY AND REPOSITIONING
The Developmental Therapeutics Program (DTP; http://dtp. nci.nih.gov) of the U.S. NCI employed the NCI60 cancer cell line panel in the early 1990s for the screening of anti-cancer drugs after experiencing failure with mouse model screening systems. More than 100000 compounds have been tested with this panel.4 Some of the candidate compounds were examinedby secondary screening in xenograft tumor models. Initially, the screen was focused on cytotoxic agents that kill the major-ity of cancers or a certain lineage of cancer. These early efforts with cancer cell lines helped position several cytotoxic agents as first-line treatment options for many tumor types.
There is a significant amount of inter- and intra-tumor het-erogeneity. Thus, the identification of subtypes that share vul-nerabilities to particular therapeutic agents and enrollment bio-markers that predict anti-tumor responses are one of the top priorities in cancer research. Most cancer-driving genetic varia-tions are found in only a small percentage of patients, with the exception of a few hotspot mutations. For example, response rates to gefitinib and crizotinib are only 15% and 6%, respec-tively, in patients with lung cancer. These low response rates are based on the low incidence of EGFR and ALK mutations, which are predictive of sensitivity to these targeted agents. Th-erefore, in vitro efforts to systematically identify this kind of precision vulnerability must have sufficient statistical power to address the low frequency of the target variations. During the past few years, several groups have attempted to implement systematic approaches to identify drug-biomarker relation-ships for cytotoxic and targeted agents at various clinical and preclinical stages in hundreds of cell lines. The most impor-tant projects include the CCLE, GDSC, CTD2, CMT1000, and GSK, which are all described in detail below.6,21-23,25,27
The CCLE project compiled multi-omics data from 947 can-cer cell lines and included targeted deep sequencing of 1600 genes and array-based determination of chromosomal copy number changes and mRNA expression levels.21 Among the
included cell lines, 479 were analyzed with an eight-point dose response assay for 24 targeted and cytotoxic agents. Correla-tion analyses between multi-omics profiles and pharmacolog-ical profiles identified anti-cancer drugs that are associated with genetic-, lineage-, and gene expression-based predictors. As proof of concept, this analysis rediscovered known drug-gene relationships, including PLX4720 (RAF inhibitor) and BRAF mutation, PD-0325901 (MEK inhibitor) and BRAF mu-tation, erlotinib (EGFR inhibitor) and EGFR mumu-tation, lapa-tinib (HER2 inhibitor) and ERBB2 amplification, PF-2341066 (MET/ALK inhibitor) and MET amplification, Nutlin-3
(inhib-its p53-MDM2 interaction) and MDM2 overexpression, and 17-AAG (Hsp90 inhibitor) and NQO1 expression. Known drug-lin-eage relationships, such as the effect of panobinostat (HDAC inhibitor) in hematologic cell lineages, were also assessed as proof of concept. Importantly, these analyses identified previ-ously unknown relationships, such as irinotecan (topoisom-erase I inhibitor) sensitivity and SLFN11 expression, PD0325901 and AHR expression in NRAS mutant cancer, and AEW541 (IGF1 receptor inhibitor) and multiple myeloma. This CCLE approach was extended to 345 small molecule probes that modulate known target molecules and pathways important for cancer in a subset of CCLE cell lines (n=242) enriched for pre-annotated genomic features.23 This group, which was a part of
the NCI Cancer Target Discovery and Development Network (CTD2),26 identified mutations in β-catenin as predictors of
sen-sitivity to navitoclax, a BCL-2 inhibitor. Furthermore, this group built a web-based portal called the Cancer Therapeutics Re-sponse Portal (http://www.broadinstitute.org/ctrp) to help researcher access to their discoveries.
The same strategy was employed by a collaboration effort between the Cancer Genome Project (CGP) at Wellcome Trust Sanger Institute and Cyril Benes’ group at Harvard.22 This
project assembled 639 cancer lines and performed targeted exome-seq and microarray-based copy number analysis and mRNA profiling. The cell line panel was examined with a nine-point dose response assay to generate pharmacological pro-files for 130 drugs that are in clinical and preclinical stages of investigation. This project reproduced many preconceived drug-biomarker relationships, such as PLX4720-BRAF mutation, lapatinib-ERBB2 amplification, PD-173074 (FGFR inhibitor)-FGFR2 mutation, Nutlin-3-TP53 mutation, and PD-0332991 (CDK inhibitor)-RB1 inactivation. Novel discoveries from this effort include drug-lineage relationships, such as obatoclax me-sylate (MCL1 inhibitor)-melanoma, and drug-gene relation-ships, such as ABT263-NOTCH1 mutation, 17AAG-STK11 in-activation, MS275 (HDAC inhibitor)-FBXW7 loss, 681640 (WEE1 and CHK1 inhibitor)-TET2 loss, and AZD2281 (PARP inhibitor)-EWS/FLI1 rearrangement. The GDSC web portal (http://www.cancerrxgene.org) provides a user-friendly inter-face that enables gene or drug queries to identify matching re-lationships.25
An earlier study from Jeffrey Settleman’s group at Harvard examined the oncogenotypes of 500 cancer cell lines by tar-geted resequencing, genomic copy number variations, and mRNA expression levels using a microarray platform. Greshock, et al.27 at GSK used a similar approach to assess 311 cancer
lines. These groups evaluated the genetic and molecular sub-type-dependent vulnerabilities to 14 kinase inhibitors and 19 targeted/anti-mitotic agents, respectively. The Settleman group utilized the CMT1000 panel to recapitulate known gen-otype-drug sensitivity relationships including that of erlotinib with EGFR mutation, PHA665752 (MET inhibitor) and MET amplification, and AZ628 (BRAF inhibitor) with BRAF
muta-tion.6 The GSK group found that PI3K/AKT and MEK
inhibi-tors are selective for the luminal and basal subtypes of breast cancer lines, respectively, and that IGF-1R inhibitors are se-lective for colon cancer lines.27
Identical driver alterations do not necessarily behave the same in different tumor types. For example, most melanomas with BRAF (V600E) mutations respond to specific inhibitors of the BRAF oncoprotein, whereas colon cancers with the same mutation do not respond.65 Thus, in addition to
feature-cen-tric pan-cancer analyses, lineage-focused panels are important for the companion discovery of anti-cancer drugs and enroll-ment biomarkers within a tumor type. For example, Ashraf, et al.66 found that the mutational status of KRAS/BRAF/PIK3CA
exon 20/PTEN predicts the efficacy of cetuximab in a study of 64 colorectal cancer cell lines. The highly annotated lung can-cer cell line panel (n=84) created by Drs. Adi Gazdar and John Minna at UT Southwestern Medical Center has also been used to screen for predictive biomarkers of response to clinical compounds.67 Using this panel, the investigators
discov-ered that the gatekeeper mutation T790M in EGFR confers re-sistance to EGFR inhibitors. Further, they discovered that can-cers with KRAS mutations are sensitive to Hsp90 inhibition in vitro and in vivo.67 Recently, as part of the CTD2 network, our
group utilized the same lung cancer cell line panel to simulta-neously screen for small molecule drug candidates and enroll-ment biomarkers anchored to a specific pair of cancer/normal cell lines from a single patient. For this project, 260000 synthetic small molecules were subjected to multiple rounds of single-dose and confirmation screenings followed by 12-point single-dose response assays in the entire panel of lung cancer cell lines. We identified an indolotriazine compound that is selectively toxic in a subset of lung cancer lines. These lines share a com-mon multi-gene expression signature. In addition, the indolo-triazine compound induces a robust endoplasmic reticulum stress response.28
The main discoveries made with these pan-cancer or lin-eage-focused large-scale studies employing cancer cell line panels are summarized in Table 1.
UTILITY OF CANCER CELL LINE PANELS:
TARGET IDENTIFICATION THROUGH
FUNCTIONAL GENOMICS
Current techniques for sequencing-based discovery of thera-peutic cancer targets have clear limitations. A significant frac-tion of tumors do not harbor known druggable driver muta-tions. Instead, these cancers often have mutated tumor sup-pressor genes, the functions of which are difficult to restore th-erapeutically. In addition, some of the major oncogenes, in-cluding RAS and MYC, have been pharmacologically intrac-table to date. Thus, overcoming the challenges of this so-called “dark matter” of current cancer therapeutics remains a priority.68
Reverse genetic loss-of-function screens provide powerful strategies for cell-based identification of genes that are respon-sible for various phenotypes. RNA interference (RNAi) and the more recently described clustered regularly interspaced short palindromic repeats (CRISPR) and CRISPR-associated (Cas) genes (CRISPR-Cas) systems are examples of such strat-egies. RNAi screens were the first to map the landscape of pu-tative essential human genes via interruption of gene function at the mRNA level.69,70 CRISPR-Cas-mediated screens have
al-lowed the identification of bona fide essential genes by com-pletely abrogating gene function at the DNA level.71,72 The
ge-nome-wide RNAi approach has been used in a variety of cancer cell line models to identify cancer-selective vulnerabilities and genes that exhibit synthetic lethality in response to anti-can-cer drugs. Moreover, RNAi has been extended to lineage- or on-cogene-dependent synthetic lethal targets (Table 1). Some of these genetic discoveries can be translated to pharmacological agents via the identification of actionable targets directly from the screen or from systems-level analysis of the hits.
RNAi screens are based on two different delivery platforms: short interference RNA (siRNA) and short hairpin RNA (shR-NA). The most straight-forward and simplest method for de-livering siRNA to cells is in complex with a lipid-based trans-fection reagent, although this effect is transient. In contrast, shRNA enables stable knockdown during repeated cell divi-sions due to the use of a chromosome-integrated vector con-struct. Therefore, shRNA experiments usually require a few weeks before phenotypic outcomes can be assessed. The three most common platforms for shRNA screens are pLKO by The RNAi Consortium (TRC),73 pGIPZ from a collaboration
be-tween Gregory Hannon at Cold Spring Harbor Laboratory and Stephen Elledge at Harvard Medical School,74 and the open
source DECIPHER libraries (http://www.decipherproject. net/shRNA-libraries/), which were produced through com-munity efforts.
The first generation TRC library is based on a simple hairpin structure and was used to identify essential cancer genes using pooled hairpins; this method requires post-hoc deconvolution of the individual hairpins.73 Further screenings for
lineage-se-lective essential genes75,76 and selective vulnerabilities
accord-ing to genetic and molecular subtype have identified numer-ous subtype-vulnerability relationships, including BRAF mu-tant-BRAF/EGFR co-inhibition,65 KRAS mutant-TBK1
inhibi-tion,77 KRAS mutant-BCL-xL/MEK co-inhibition,78 Myc
over-expression-SAE1/2 inhibition,79 RAS mutant-PLK1 inhibition,80
and KRAS dependent cancer lines-STK33 inhibition.81 The
TRC library is currently being employed for a large-scale sc-reening for essential genes in a pan-cancer cell line panel as part of “Project Achilles” (http://www.broadinstitute.org/achil-les). The second generation pGIPZ platform takes advantage of the stem-loop structure of endogenous miRNA and incor-porates our understanding of natural miRNA processing74 to
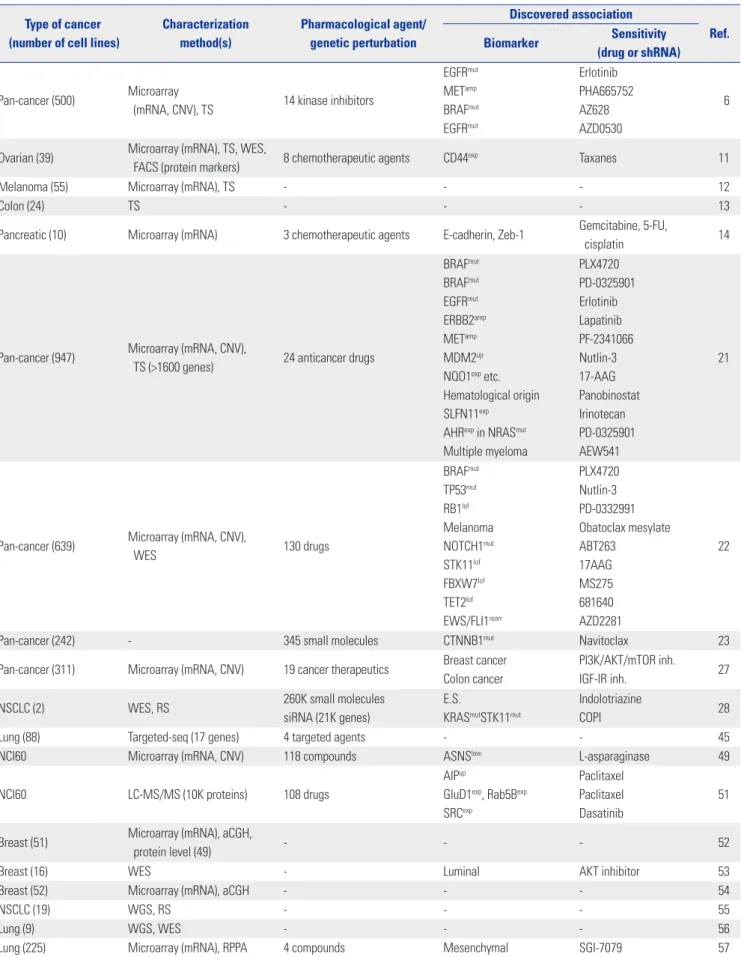
Fi-Table 1. Studies that Have Characterized the Genetic/Molecular Features or Sensitivity Profiles to Various Pharmacological/Genetic Perturbations Using Cancer Cell Line Panels
Type of cancer (number of cell lines)
Characterization method(s) Pharmacological agent/ genetic perturbation Discovered association Ref. Biomarker Sensitivity (drug or shRNA) Pan-cancer (500) Microarray
(mRNA, CNV), TS 14 kinase inhibitors
EGFRmut METamp BRAFmut EGFRmut Erlotinib PHA665752 AZ628 AZD0530 6
Ovarian (39) Microarray (mRNA), TS, WES,
FACS (protein markers) 8 chemotherapeutic agents CD44exp Taxanes 11
Melanoma (55) Microarray (mRNA), TS - - - 12
Colon (24) TS - - - 13
Pancreatic (10) Microarray (mRNA) 3 chemotherapeutic agents E-cadherin, Zeb-1 Gemcitabine, 5-FU,
cisplatin 14
Pan-cancer (947) Microarray (mRNA, CNV),
TS (>1600 genes) 24 anticancer drugs
BRAFmut BRAFmut EGFRmut ERBB2amp METamp MDM2up
NQO1exp etc.
Hematological origin SLFN11exp
AHRexp in NRASmut
Multiple myeloma PLX4720 PD-0325901 Erlotinib Lapatinib PF-2341066 Nutlin-3 17-AAG Panobinostat Irinotecan PD-0325901 AEW541 21
Pan-cancer (639) Microarray (mRNA, CNV),
WES 130 drugs BRAFmut TP53mut RB1lof Melanoma NOTCH1mut STK11lof FBXW7lof TET2lof EWS/FLI1rearr PLX4720 Nutlin-3 PD-0332991 Obatoclax mesylate ABT263 17AAG MS275 681640 AZD2281 22
Pan-cancer (242) - 345 small molecules CTNNB1mut Navitoclax 23
Pan-cancer (311) Microarray (mRNA, CNV) 19 cancer therapeutics Breast cancer Colon cancer
PI3K/AKT/mTOR inh.
IGF-IR inh. 27
NSCLC (2) WES, RS 260K small molecules
siRNA (21K genes)
E.S.
KRASmutSTK11mut
Indolotriazine
COPI 28
Lung (88) Targeted-seq (17 genes) 4 targeted agents - - 45
NCI60 Microarray (mRNA, CNV) 118 compounds ASNSlow L-asparaginase 49
NCI60 LC-MS/MS (10K proteins) 108 drugs
AIPup
GluD1exp, Rab5Bexp
SRCexp
Paclitaxel Paclitaxel Dasatinib
51
Breast (51) Microarray (mRNA), aCGH,
protein level (49) - - - 52
Breast (16) WES - Luminal AKT inhibitor 53
Breast (52) Microarray (mRNA), aCGH - - - 54
NSCLC (19) WGS, RS - - - 55
Lung (9) WGS, WES - - - 56
nally, the DECIPHER library is the newest open-source reso-urce that employs the pRSI lentiviral vector system and is av-ailable to researchers as pooled collections with a minimum handling fee.
Genome-wide libraries of synthetic siRNA oligos are also commercially available and have been used typically in “one-gene, one-well” high-throughput screen formats. In this con-text, the outcome of transiently depleting an individual gene can be assessed in a relatively short period of time (i.e., within a few days). Discoveries made with siRNA platforms include lineage- and molecular subtype-dependent vulnerabilities, such as the KIF11 dependence of head and neck and lung can-cers,85 proteasome addiction of triple-negative breast cancer,86
CSNK1e dependence of MYC-overexpressing cells,87 and
KRAS/STK11 dual mutation-driven addiction to lysosomal function in lung cancer.28 Synthetic lethality and mechanisms
of resistance to anti-cancer drugs have also been investigated. These studies have revealed that microtubule and proteasome depletion are synthetic lethal for paclitaxel in lung cancer,88
NF1 depletion leads to EGFR inhibitor resistance in lung can-cer,89 CDK5 is a synthetic lethal for PARP inhibitor,90 RAS
sup-pression synergizes with MEK inhibitor in KRAS-mutant co-lorectal cancer,91 and FAT1 is a negative regulator of
TRAIL-induced extrinsic apoptosis in glioblastoma.92
A new mammalian gene-knockout tool, the CRISPR-Cas system, is rapidly being adapted in a variety of fields, includ-ing cancer functional genomics.93 For example, Tyler Jacks’ lab
at M.I.T. recently employed CRISPR-Cas for the functional in-vestigation of a panel of tumor suppressor genes in a Kras-driven mouse lung cancer model.94 CRISPR-Cas and other
ge-nome editing tools, such as transcription activator-like effector nucleases (TALEN), should facilitate the identification of
ad-ditional cancer target genes and synthetic lethalities, especial-ly ones that are not detectable by partial knockdown via RNAi methods.
DATA PROCESSING AND IN SILICO
ANALYSIS METHODS
Typical cancer cell line-based drug or siRNA screens involve high-throughput assays that employ robotic liquid transfers and handling of thousands of barcode-tagged plates. These assays exhibit batch-to-batch or plate-to-plate variations in the degree of penetrance due to uneven evaporation within a plate or between plates during multiple days of incubation. There-fore, statistical evaluations of screening quality and normaliz-ation procedures for correcting these systematic errors are es-sential. The most popular quality control metric is the Z-factor (Z’), which is a measure of statistical effect size using assay values of positive and negative controls within a plate.95 If the Z’
is small or negative, then the assay conditions are not optimal for detecting hits. Thus, these Z’ values indicate that those plates should be reconsidered and re-assayed if possible. The normalization step requires the identification of various sourc-es of systematic errors followed by corrections using controls or samples on the plates. One of the most user-friendly tools we developed runs with Microsoft Excel, enabling informed and easy processing of the screening data by the investigators who perform the screens.96
Unlike siRNA or small molecule screens, typical shRNA screens are performed in a single tissue culture vessel per con-dition. Cells are transduced with a pool of different hairpin molecules, which span the whole gene set. These molecules Table 1. Studies that Have Characterized the Genetic/Molecular Features or Sensitivity Profiles to Various Pharmacological/Genetic Perturbations Using Cancer Cell Line Panels (Continued)
Type of cancer (number of cell lines)
Characterization method(s) Pharmacological agent/ genetic perturbation Discovered association Ref. Biomarker Sensitivity (drug or shRNA)
Gastric (32) Microarray (CNV), WES, RS - - - 58
Colorectal (56) TS (TP53) - - - 60
Glioblastoma (10) Microarray (mRNA) - - - 61
NCI60 WES - - - 62
Colorectal (64) Microarray (mRNA), TS 4 ERBB1, 2 inhibition
ERBB2up, AREGup
KRASwt/BRAFwt/PIK3CAwt
ERBB1up Lapatinib Lapatinib Cetuximab 66 NSCLC (84) Microarray (mRNA, CNV),
WES 12 cancer therapeutics
KRASmut
ABL2amp, SRCamp
HSP90 inh.
Dasatinib 67
Pan-cancer (72) - shRNA (16K genes) - - 75
Pan-cancer (102) - shRNA (11K genes) PAX8up ovarian shPAX8 76
Colorectal (8) - 5-FU+Irinotecan Stem-like subtype FOLFIRI 100
Pan-cancer (216) - shRNA (11K genes) - - Achilles
TS, targeted sequencing; WGS, whole-genome sequencing; WES, whole-exome sequencing; RS, RNA sequencing; E.S., expression signature; mut, mutated; wt, wild-type; up, upregulated; low, low expression; exp, expressed; amp, amplified; lof, loss of function; inh., inhibitor; rearr, rearrangement.
then compete against each other according to their impact on cell growth. Luo, et al.73 developed a statistical framework, the
RNAi gene enrichment ranking (RIGER) score, to test the sig-nificance of the effect of a group of hairpins that targeted a sin-gle gene. This method is based on the Kolmogorov-Smirnov (KS) statistic, which examines the biased distribution of the hairpins for a gene toward the top of the list. The KS statistic is implemented in the Broad Institute’s GENE-E software pack-age (http://www.broadinstitute.org/cancer/software/GENE-E). Alternatively, classical Z score or robust Z score statistics can be adopted to identify individual hit shRNAs.83
Responses to anti-cancer agents vary among cancer lines, possibly due to heterogeneity of the target molecule or path-way. Thus, the pharmacological profile obtained from many cancer cell lines may represent a footprint of the target mech-anism of each drug, although the actual target molecule may be unknown. An important contribution of the NCI60 panel is the ability to infer the mode of action (MOA) of a drug based on similarity with a drug that has a known MOA. For example, if a small molecule compound exhibits a sensitivity profile that is very similar to that of erlotinib, it is reasonable to speculate that the compound may function as an inhibitor of EGFR. NCI researchers formulated this concept as a pattern recognition algorithm called COMPARE.24 This algorithm relies on a
mean-graph pattern created by plotting delta values, which are pan-el-mean centered Log GI50 or LC50 values of the cell lines. A Pearson product moment correlation coefficient for each set of delta value pairs is then calculated and rank ordered for simi-larity to a reference set of mean-graphs of chemical probes.97
To identify features that directly correlate with drug re-sponse, simple statistical tests, such as multivariate analysis of variance, can be used in cases with two or more dependent variables; these variables may include tissue type, oncogeno-type, chromosomal rearrangements, microsatellite instability, or gene expression.22 Identifying a predictive model from
multi-omics features is challenging because the number of features (i.e., >20000 in multi-omics dataset) is much larger than the number of observations (i.e., drug response from several hun-dred cell lines). Therefore, a regularization and variable selec-tion method called elastic net outperforms other similar meth-ods, such as ridge regression and lasso.98 Elastic net achieves
both sparsity of representation (ridge regression does not) and grouping effect (lasso does not).98 Elastic net has been
suc-cessfully implemented in recent studies involving large-scale cancer cell line panels.21,22 To summarize the method, the
opti-mal values for two parameters, alpha and lambda, are estimat-ed using the Z score-convertestimat-ed input values by cross-valida-tion to minimize error. Bootstrapping is then performed with the optimal parameters and the resampled data to estimate the weight and frequency of the significant features. Biomark-ers that exceed the given thresholds for weight and frequency can then be selected.
Recently, the NCI-DREAM drug sensitivity prediction
chal-lenge evaluated 44 proposed algorithms for their predictive power based on the drug-response profiles of breast cancer cell lines that were randomly divided into training and test da-tasets. This community effort identified Bayesian multitask multiple kernel learning (MKL) as the top-performing predic-tion algorithm.99 The Bayesian multitask MKL is a
machine-learning method that integrates nonlinear regression, multi-task learning, multiview learning, and Bayesian inference. MKL estimates the kernel weights for each of the multiple profiling data sets (genomic views). Further multitask learning steps estimate the drug-specific regression parameters for all drugs simultaneously with the shared kernel weights across drugs. Bayesian inference is then used to estimate all of the model parameters to leverage uncertainty from a small sample size.99
FUTURE PROSPECTS
The statistical power that is now possible due to the number of available cancer cell lines combined with recent advances in genomic technologies has led to a series of discoveries that were previously deemed impossible. Early efforts were focused on potential repositioning of a variety of anti-cancer drugs ac-cording to associated predictive biomarkers. Although this may help to identify patients who are likely to benefit from spe-cific anti-cancer drugs, current therapeutics are not capable of inhibiting all forms of cancer. Many cancer subtypes are resis-tant to first-line chemotherapy options and do not harbor kn-own targetable somatic mutations; examples include the triple-negative subtype of breast cancer and stem cell-like subtype of colorectal cancer. In this respect, future endeavors should be expanded to include ab initio discovery of new drugs to fill existing gaps. The highest priority should be given to refracto-ry subtypes. Specifically, established cancer cell lines must be properly classified according to tumor molecular subtype100 to
allow more focused functional genomic screens or chemical screens for cancers that exhibit poor prognosis and/or drug resistance. However, a substantial number of cancer lines is re-quired for each tumor type to yield robust hits within a subtype. Importantly, recent CRC-based methods promise a faster pace for the accumulation of cell lines.
Major bottlenecks occur when patient-derived cancer cells are used as guides for clinical therapeutic decisions. Recent CRC applications in patient-derived lung cancer tissues took 2–6 months to establish cancer cells in sufficient amounts to perform drug screens.42 Overcoming the bottleneck in sample
size, such as from core needle biopsies of lung cancer, and min-imizing the time required to obtain a sufficient mass of tissue remain challenges that require further technical innovations.
Another obstacle in cell line-based modeling of drug resp-onses is the poor correlation of drug-response measures am-ong different studies.33 This discrepancy is unlikely to be due
ge-nomic features of the same cell lines were remarkably similar among the different studies.33 This difference is more likely to
be the result of epistasis with different growth conditions or differences in cell culture practice. The same is true for the re-lationship between cell line models and in vivo tumor models. Considering discrepancies in the growth conditions of cancer cell lines and original tumors, identifying the sources of the epistatic relationships between vulnerabilities and the TME is important. Thus, optimizing in vitro culture conditions may be necessary to minimize potential false positives and false nega-tives. Nevertheless, it is almost impossible to completely mimic the physiological tumor setting on plastic. Therefore, discov-eries made with cancer cell lines in vitro almost always require further validation in appropriate in vivo models. Traditionally, xenograft models of cancer cell lines in immune-compromised mice were the most popular option; however, accumulating PDX models with genomic annotations may be a better fit for this purpose, as these models maintain an intact TME.
Predictive biomarker(s) for a therapeutic regimen may indi-cate the context in which sensitivity to an anti-cancer drug will occur; identification of these markers is often complicated by the lack of adequate variables. Therefore, the presence of more orthogonal dimensions of novel features provides an increased opportunity for capturing a more robust predictive model. In this respect, current advances in metabolomic and proteomic quantitative profiling technologies, such as mass spectropho-tometry, have great potential. In addition, emerging function-al genomic technologies, such as the CRISPR-Cas system, will also provide additional advances in the field by uncovering qualitative genetic vulnerabilities in a more stringent fashion than can be achieved with conventional RNAi-based hypo-morphic screens.
CONCLUSION
Cancer cell lines have become a powerful tool for basic cancer research and anti-cancer drug development. Now empowered by various genomic tools, these cell lines offer utility as a plat-form for the discovery of precision cancer medicine and for drug repositioning. An increasing number of studies employ-ing this cancer cell line panel provide unprecedented oppor-tunities for data-driven discoveries of novel anti-cancer thera-peutic strategies. These strategies integrate multi-dimensional data sets of genetic/molecular profiles, drug responses, and molecular dependencies generated by different research lab-oratories. To efficiently implement this strategy, we need to overcome challenges associated with differences in experi-mental design and assay platforms. Development of commu-nity-wide, consensus-based guidelines for good standard of practice for using cancer cell line panels should be considered. Further, a mechanism for central deposition of multi-dimen-sional genomics and various cell-based assay data sets should
be established.
ACKNOWLEDGEMENTS
This study was supported by a grant from the National R&D Program for Cancer Control, Ministry of Health & Welfare, Re-public of Korea (1420100).
REFERENCES
1. Hanahan D, Weinberg RA. The hallmarks of cancer. Cell 2000; 100:57-70.
2. Paik S, Shak S, Tang G, Kim C, Baker J, Cronin M, et al. A multigene assay to predict recurrence of tamoxifen-treated, node-negative breast cancer. N Engl J Med 2004;351:2817-26.
3. Dawson JC, Carragher NO. Quantitative phenotypic and pathway profiling guides rational drug combination strategies. Front Phar-macol 2014;5:118.
4. Gazdar AF, Girard L, Lockwood WW, Lam WL, Minna JD. Lung cancer cell lines as tools for biomedical discovery and research. J Natl Cancer Inst 2010;102:1310-21.
5. Sharma SV, Haber DA, Settleman J. Cell line-based platforms to evaluate the therapeutic efficacy of candidate anticancer agents. Nat Rev Cancer 2010;10:241-53.
6. McDermott U, Sharma SV, Dowell L, Greninger P, Montagut C, Lamb J, et al. Identification of genotype-correlated sensitivity to selective kinase inhibitors by using high-throughput tumor cell line profiling. Proc Natl Acad Sci U S A 2007;104:19936-41. 7. Luo J, Solimini NL, Elledge SJ. Principles of cancer therapy:
onco-gene and non-oncoonco-gene addiction. Cell 2009;136:823-37. 8. Masters JR. HeLa cells 50 years on: the good, the bad and the ugly.
Nat Rev Cancer 2002;2:315-9.
9. Gazdar AF, Gao B, Minna JD. Lung cancer cell lines: Useless arti-facts or invaluable tools for medical science? Lung Cancer 2010; 68:309-18.
10. Gazdar AF, Kurvari V, Virmani A, Gollahon L, Sakaguchi M, West-erfield M, et al. Characterization of paired tumor and non-tumor cell lines established from patients with breast cancer. Int J Cancer 1998;78:766-74.
11. Beaufort CM, Helmijr JC, Piskorz AM, Hoogstraat M, Ruigrok-Rit-stier K, Besselink N, et al. Ovarian cancer cell line panel (OCCP): clinical importance of in vitro morphological subtypes. PLoS One 2014;9:e103988.
12. Behren A, Anaka M, Lo PH, Vella LJ, Davis ID, Catimel J, et al. The Ludwig institute for cancer research Melbourne melanoma cell line panel. Pigment Cell Melanoma Res 2013;26:597-600. 13. Ahmed D, Eide PW, Eilertsen IA, Danielsen SA, Eknæs M,
Hek-toen M, et al. Epigenetic and genetic features of 24 colon cancer cell lines. Oncogenesis 2013;2:e71.
14. Arumugam T, Ramachandran V, Fournier KF, Wang H, Marquis L, Abbruzzese JL, et al. Epithelial to mesenchymal transition con-tributes to drug resistance in pancreatic cancer. Cancer Res 2009; 69:5820-8.
15. Sobel RE, Sadar MD. Cell lines used in prostate cancer research: a compendium of old and new lines--part 1. J Urol 2005;173:342-59. 16. Sobel RE, Sadar MD. Cell lines used in prostate cancer research: a
compendium of old and new lines--part 2. J Urol 2005;173:360-72. 17. Gazdar AF, Minna JD. NCI series of cell lines: an historical
per-spective. J Cell Biochem Suppl 1996;24:1-11.
18. Suggitt M, Bibby MC. 50 years of preclinical anticancer drug screening: empirical to target-driven approaches. Clin Cancer Res
2005;11:971-81.
19. Kong D, Yamori T. JFCR39, a panel of 39 human cancer cell lines, and its application in the discovery and development of antican-cer drugs. Bioorg Med Chem 2012;20:1947-51.
20. Dan S, Okamura M, Seki M, Yamazaki K, Sugita H, Okui M, et al. Correlating phosphatidylinositol 3-kinase inhibitor efficacy with signaling pathway status: in silico and biological evaluations. Can-cer Res 2010;70:4982-94.
21. Barretina J, Caponigro G, Stransky N, Venkatesan K, Margolin AA, Kim S, et al. The Cancer Cell Line Encyclopedia enables predictive modelling of anticancer drug sensitivity. Nature 2012;483:603-7. 22. Garnett MJ, Edelman EJ, Heidorn SJ, Greenman CD, Dastur A, Lau
KW, et al. Systematic identification of genomic markers of drug sensitivity in cancer cells. Nature 2012;483:570-5.
23. Basu A, Bodycombe NE, Cheah JH, Price EV, Liu K, Schaefer GI, et al. An interactive resource to identify cancer genetic and lineage dependencies targeted by small molecules. Cell 2013;154:1151-61. 24. Shoemaker RH. The NCI60 human tumour cell line anticancer
drug screen. Nat Rev Cancer 2006;6:813-23.
25. Yang W, Soares J, Greninger P, Edelman EJ, Lightfoot H, Forbes S, et al. Genomics of Drug Sensitivity in Cancer (GDSC): a resource for therapeutic biomarker discovery in cancer cells. Nucleic Ac-ids Res 2013;41:D955-61.
26. Cancer Target Discovery and Development Network, Schreiber SL, Shamji AF, Clemons PA, Hon C, Koehler AN, et al. Towards pa-tient-based cancer therapeutics. Nat Biotechnol 2010;28:904-6. 27. Greshock J, Bachman KE, Degenhardt YY, Jing J, Wen YH, Eastman
S, et al. Molecular target class is predictive of in vitro response pro-file. Cancer Res 2010;70:3677-86.
28. Kim HS, Mendiratta S, Kim J, Pecot CV, Larsen JE, Zubovych I, et al. Systematic identification of molecular subtype-selective vul-nerabilities in non-small-cell lung cancer. Cell 2013;155:552-66. 29. Gillet JP, Calcagno AM, Varma S, Marino M, Green LJ, Vora MI, et
al. Redefining the relevance of established cancer cell lines to the study of mechanisms of clinical anti-cancer drug resistance. Proc Natl Acad Sci U S A 2011;108:18708-13.
30. Domcke S, Sinha R, Levine DA, Sander C, Schultz N. Evaluating cell lines as tumour models by comparison of genomic profiles. Nat Commun 2013;4:2126.
31. Burdall SE, Hanby AM, Lansdown MR, Speirs V. Breast cancer cell lines: friend or foe? Breast Cancer Res 2003;5:89-95.
32. Hanahan D, Weinberg RA. Hallmarks of cancer: the next genera-tion. Cell 2011;144:646-74.
33. Haibe-Kains B, El-Hachem N, Birkbak NJ, Jin AC, Beck AH, Aerts HJ, et al. Inconsistency in large pharmacogenomic studies. Na-ture 2013;504:389-93.
34. Pao W, Miller VA, Politi KA, Riely GJ, Somwar R, Zakowski MF, et al. Acquired resistance of lung adenocarcinomas to gefitinib or er-lotinib is associated with a second mutation in the EGFR kinase domain. PLoS Med 2005;2:e73.
35. Cross DA, Ashton SE, Ghiorghiu S, Eberlein C, Nebhan CA, Spit-zler PJ, et al. AZD9291, an irreversible EGFR TKI, overcomes T790M-mediated resistance to EGFR inhibitors in lung cancer. Cancer Discov 2014;4:1046-61.
36. Nazarian R, Shi H, Wang Q, Kong X, Koya RC, Lee H, et al. Melano-mas acquire resistance to B-RAF(V600E) inhibition by RTK or N-RAS upregulation. Nature 2010;468:973-7.
37. Oie HK, Russell EK, Carney DN, Gazdar AF. Cell culture methods for the establishment of the NCI series of lung cancer cell lines. J Cell Biochem Suppl 1996;24:24-31.
38. Zheng C, Sun YH, Ye XL, Chen HQ, Ji HB. Establishment and char-acterization of primary lung cancer cell lines from Chinese pop-ulation. Acta Pharmacol Sin 2011;32:385-92.
39. Dangles-Marie V, Pocard M, Richon S, Weiswald LB, Assayag F, Saulnier P, et al. Establishment of human colon cancer cell lines from fresh tumors versus xenografts: comparison of success rate and cell line features. Cancer Res 2007;67:398-407.
40. Rheinwald JG, Green H. Serial cultivation of strains of human epi-dermal keratinocytes: the formation of keratinizing colonies from single cells. Cell 1975;6:331-43.
41. Liu X, Ory V, Chapman S, Yuan H, Albanese C, Kallakury B, et al. ROCK inhibitor and feeder cells induce the conditional repro-gramming of epithelial cells. Am J Pathol 2012;180:599-607. 42. Crystal AS, Shaw AT, Sequist LV, Friboulet L, Niederst MJ,
Locker-man EL, et al. Patient-derived models of acquired resistance can identify effective drug combinations for cancer. Science 2014; 346:1480-6.
43. Sato T, Vries RG, Snippert HJ, van de Wetering M, Barker N, Stange DE, et al. Single Lgr5 stem cells build crypt-villus structures in vi-tro without a mesenchymal niche. Nature 2009;459:262-5. 44. Boj SF, Hwang CI, Baker LA, Chio II, Engle DD, Corbo V, et al.
Or-ganoid models of human and mouse ductal pancreatic cancer. Cell 2015;160:324-38.
45. Blanco R, Iwakawa R, Tang M, Kohno T, Angulo B, Pio R, et al. A gene-alteration profile of human lung cancer cell lines. Hum Mu-tat 2009;30:1199-206.
46. Hollestelle A, Nagel JH, Smid M, Lam S, Elstrodt F, Wasielewski M, et al. Distinct gene mutation profiles among luminal-type and basal-type breast cancer cell lines. Breast Cancer Res Treat 2010; 121:53-64.
47. Forbes SA, Bindal N, Bamford S, Cole C, Kok CY, Beare D, et al. COSMIC: mining complete cancer genomes in the Catalogue of Somatic Mutations in Cancer. Nucleic Acids Res 2011;39:D945-50. 48. Ross DT, Scherf U, Eisen MB, Perou CM, Rees C, Spellman P, et al.
Systematic variation in gene expression patterns in human can-cer cell lines. Nat Genet 2000;24:227-35.
49. Bussey KJ, Chin K, Lababidi S, Reimers M, Reinhold WC, Kuo WL, et al. Integrating data on DNA copy number with gene expression levels and drug sensitivities in the NCI-60 cell line panel. Mol Can-cer Ther 2006;5:853-67.
50. Shen L, Kondo Y, Ahmed S, Boumber Y, Konishi K, Guo Y, et al. Drug sensitivity prediction by CpG island methylation profile in the NCI-60 cancer cell line panel. Cancer Res 2007;67:11335-43. 51. Moghaddas Gholami A, Hahne H, Wu Z, Auer FJ, Meng C,
Wil-helm M, et al. Global proteome analysis of the NCI-60 cell line panel. Cell Rep 2013;4:609-20.
52. Neve RM, Chin K, Fridlyand J, Yeh J, Baehner FL, Fevr T, et al. A collection of breast cancer cell lines for the study of functionally distinct cancer subtypes. Cancer Cell 2006;10:515-27.
53. Zaman N, Li L, Jaramillo ML, Sun Z, Tibiche C, Banville M, et al. Signaling network assessment of mutations and copy number variations predict breast cancer subtype-specific drug targets. Cell Rep 2013;5:216-23.
54. Kao J, Salari K, Bocanegra M, Choi YL, Girard L, Gandhi J, et al. Molecular profiling of breast cancer cell lines defines relevant tu-mor models and provides a resource for cancer gene discovery. PLoS One 2009;4:e6146.
55. Liu J, Lee W, Jiang Z, Chen Z, Jhunjhunwala S, Haverty PM, et al. Genome and transcriptome sequencing of lung cancers reveal di-verse mutational and splicing events. Genome Res 2012;22:2315-27.
56. Jia P, Jin H, Meador CB, Xia J, Ohashi K, Liu L, et al. Next-genera-tion sequencing of paired tyrosine kinase inhibitor-sensitive and -resistant EGFR mutant lung cancer cell lines identifies spectrum of DNA changes associated with drug resistance. Genome Res 2013;23:1434-45.
57. Byers LA, Diao L, Wang J, Saintigny P, Girard L, Peyton M, et al. An epithelial-mesenchymal transition gene signature predicts resis-tance to EGFR and PI3K inhibitors and identifies Axl as a thera-peutic target for overcoming EGFR inhibitor resistance. Clin Can-cer Res 2013;19:279-90.
58. Liu J, McCleland M, Stawiski EW, Gnad F, Mayba O, Haverty PM, et al. Integrated exome and transcriptome sequencing reveals ZAK isoform usage in gastric cancer. Nat Commun 2014;5:3830. 59. Jones S, Zhang X, Parsons DW, Lin JC, Leary RJ, Angenendt P, et al.
Core signaling pathways in human pancreatic cancers revealed by global genomic analyses. Science 2008;321:1801-6.
60. Liu Y, Bodmer WF. Analysis of P53 mutations and their expression in 56 colorectal cancer cell lines. Proc Natl Acad Sci U S A 2006; 103:976-81.
61. Demuth T, Rennert JL, Hoelzinger DB, Reavie LB, Nakada M, Be-audry C, et al. Glioma cells on the run - the migratory transcrip-tome of 10 human glioma cell lines. BMC Genomics 2008;9:54. 62. Abaan OD, Polley EC, Davis SR, Zhu YJ, Bilke S, Walker RL, et al.
The exomes of the NCI-60 panel: a genomic resource for cancer biology and systems pharmacology. Cancer Res 2013;73:4372-82. 63. Garraway LA, Lander ES. Lessons from the cancer genome. Cell
2013;153:17-37.
64. Gao J, Aksoy BA, Dogrusoz U, Dresdner G, Gross B, Sumer SO, et al. Integrative analysis of complex cancer genomics and clinical profiles using the cBioPortal. Sci Signal 2013;6:pl1.
65. Prahallad A, Sun C, Huang S, Di Nicolantonio F, Salazar R, Zec-chin D, et al. Unresponsiveness of colon cancer to BRAF(V600E) inhibition through feedback activation of EGFR. Nature 2012; 483:100-3.
66. Ashraf SQ, Nicholls AM, Wilding JL, Ntouroupi TG, Mortensen NJ, Bodmer WF. Direct and immune mediated antibody targeting of ERBB receptors in a colorectal cancer cell-line panel. Proc Natl Acad Sci U S A 2012;109:21046-51.
67. Sos ML, Michel K, Zander T, Weiss J, Frommolt P, Peifer M, et al. Predicting drug susceptibility of non-small cell lung cancers based on genetic lesions. J Clin Invest 2009;119:1727-40.
68. Epstein RJ. The unpluggable in pursuit of the undruggable: tack-ling the dark matter of the cancer therapeutics universe. Front On-col 2013;3:304.
69. Silva JM, Marran K, Parker JS, Silva J, Golding M, Schlabach MR, et al. Profiling essential genes in human mammary cells by multi-plex RNAi screening. Science 2008;319:617-20.
70. Schlabach MR, Luo J, Solimini NL, Hu G, Xu Q, Li MZ, et al. Can-cer proliferation gene discovery through functional genomics. Science 2008;319:620-4.
71. Shalem O, Sanjana NE, Hartenian E, Shi X, Scott DA, Mikkelsen TS, et al. Genome-scale CRISPR-Cas9 knockout screening in hu-man cells. Science 2014;343:84-7.
72. Wang T, Wei JJ, Sabatini DM, Lander ES. Genetic screens in hu-man cells using the CRISPR-Cas9 system. Science 2014;343:80-4. 73. Luo B, Cheung HW, Subramanian A, Sharifnia T, Okamoto M,
Yang X, et al. Highly parallel identification of essential genes in cancer cells. Proc Natl Acad Sci U S A 2008;105:20380-5. 74. Silva JM, Li MZ, Chang K, Ge W, Golding MC, Rickles RJ, et al.
Second-generation shRNA libraries covering the mouse and hu-man genomes. Nat Genet 2005;37:1281-8.
75. Marcotte R, Brown KR, Suarez F, Sayad A, Karamboulas K, Krzy-zanowski PM, et al. Essential gene profiles in breast, pancreatic, and ovarian cancer cells. Cancer Discov 2012;2:172-89.
76. Cheung HW, Cowley GS, Weir BA, Boehm JS, Rusin S, Scott JA, et al. Systematic investigation of genetic vulnerabilities across can-cer cell lines reveals lineage-specific dependencies in ovarian cancer. Proc Natl Acad Sci U S A 2011;108:12372-7.
77. Barbie DA, Tamayo P, Boehm JS, Kim SY, Moody SE, Dunn IF, et al. Systematic RNA interference reveals that oncogenic KRAS-driv-en cancers require TBK1. Nature 2009;462:108-12.
78. Corcoran RB, Cheng KA, Hata AN, Faber AC, Ebi H, Coffee EM, et al. Synthetic lethal interaction of combined BCL-XL and MEK inhibition promotes tumor regressions in KRAS mutant cancer models. Cancer Cell 2013;23:121-8.
79. Kessler JD, Kahle KT, Sun T, Meerbrey KL, Schlabach MR, Schmitt EM, et al. A SUMOylation-dependent transcriptional subpro-gram is required for Myc-driven tumorigenesis. Science 2012; 335:348-53.
80. Luo J, Emanuele MJ, Li D, Creighton CJ, Schlabach MR, West-brook TF, et al. A genome-wide RNAi screen identifies multiple synthetic lethal interactions with the Ras oncogene. Cell 2009; 137:835-48.
81. Scholl C, Fröhling S, Dunn IF, Schinzel AC, Barbie DA, Kim SY, et al. Synthetic lethal interaction between oncogenic KRAS depen-dency and STK33 suppression in human cancer cells. Cell 2009; 137:821-34.
82. Sims D, Mendes-Pereira AM, Frankum J, Burgess D, Cerone MA, Lombardelli C, et al. High-throughput RNA interference screen-ing usscreen-ing pooled shRNA libraries and next generation sequenc-ing. Genome Biol 2011;12:R104.
83. Mendes-Pereira AM, Sims D, Dexter T, Fenwick K, Assiotis I, Ko-zarewa I, et al. Genome-wide functional screen identifies a com-pendium of genes affecting sensitivity to tamoxifen. Proc Natl Acad Sci U S A 2012;109:2730-5.
84. Chen R, Bélanger S, Frederick MA, Li B, Johnston RJ, Xiao N, et al. In vivo RNA interference screens identify regulators of antiviral CD4(+) and CD8(+) T cell differentiation. Immunity 2014;41:325-38.
85. Martens-de Kemp SR, Nagel R, Stigter-van Walsum M, van der Meulen IH, van Beusechem VW, Braakhuis BJ, et al. Functional genetic screens identify genes essential for tumor cell survival in head and neck and lung cancer. Clin Cancer Res 2013;19:1994-2003.
86. Petrocca F, Altschuler G, Tan SM, Mendillo ML, Yan H, Jerry DJ, et al. A genome-wide siRNA screen identifies proteasome addic-tion as a vulnerability of basal-like triple-negative breast cancer cells. Cancer Cell 2013;24:182-96.
87. Toyoshima M, Howie HL, Imakura M, Walsh RM, Annis JE, Chang AN, et al. Functional genomics identifies therapeutic tar-gets for MYC-driven cancer. Proc Natl Acad Sci U S A 2012;109: 9545-50.
88. Whitehurst AW, Bodemann BO, Cardenas J, Ferguson D, Girard L, Peyton M, et al. Synthetic lethal screen identification of chemo-sensitizer loci in cancer cells. Nature 2007;446:815-9.
89. de Bruin EC, Cowell C, Warne PH, Jiang M, Saunders RE, Melnick MA, et al. Reduced NF1 expression confers resistance to EGFR inhibition in lung cancer. Cancer Discov 2014;4:606-19.
90. Turner NC, Lord CJ, Iorns E, Brough R, Swift S, Elliott R, et al. A synthetic lethal siRNA screen identifying genes mediating sensi-tivity to a PARP inhibitor. EMBO J 2008;27:1368-77.
91. Lamba S, Russo M, Sun C, Lazzari L, Cancelliere C, Grernrum W, et al. RAF suppression synergizes with MEK inhibition in KRAS mutant cancer cells. Cell Rep 2014;8:1475-83.
92. Kranz D, Boutros M. A synthetic lethal screen identifies FAT1 as an antagonist of caspase-8 in extrinsic apoptosis. EMBO J 2014; 33:181-97.
93. Hsu PD, Lander ES, Zhang F. Development and applications of CRISPR-Cas9 for genome engineering. Cell 2014;157:1262-78. 94. Sánchez-Rivera FJ, Papagiannakopoulos T, Romero R, Tammela T,
ge-netic events in cancer through somatic genome editing. Nature 2014;516:428-31.
95. Zhang JH, Chung TD, Oldenburg KR. A Simple Statistical Param-eter for Use in Evaluation and Validation of High Throughput Screening Assays. J Biomol Screen 1999;4:67-73.
96. Singh NK, Seo BY, Vidyasagar M, White MA, Kim HS. siMacro: A Fast and Easy Data Processing Tool for Cell-Based Genomewide siRNA Screens. Genomics Inform 2013;11:55-7.
97. Paull KD, Shoemaker RH, Hodes L, Monks A, Scudiero DA, Ru-binstein L, et al. Display and analysis of patterns of differential ac-tivity of drugs against human tumor cell lines: development of
mean graph and COMPARE algorithm. J Natl Cancer Inst 1989; 81:1088-92.
98. Zou H, Hastie T. Regularization and variable selection via the elas-tic net. J R Statist Soc B 2005;67:301-20.
99. Costello JC, Heiser LM, Georgii E, Gönen M, Menden MP, Wang NJ, et al. A community effort to assess and improve drug sensitivity prediction algorithms. Nat Biotechnol 2014;32:1202-12. 100. Sadanandam A, Lyssiotis CA, Homicsko K, Collisson EA, Gibb
WJ, Wullschleger S, et al. A colorectal cancer classification system that associates cellular phenotype and responses to therapy. Nat Med 2013;19:619-25.