INTRODUCTION
Bra�nemark started comprehensive study on microscopic phenomenon of the bone healing in 1952. He reported the bone contacted on the titanium surface directly.1This study led to animal study of endosseous implant. Human study was start- ed in 1965 and he presented the results of 10 years of study in 1977.2In early development stage of dental implant, it had machined surface without any additional surface treatment. As time went by, scientists have studied and developed the sur- face, form and shape of implant. As a result, it showed high suc- cess rate and predictable results over 40 years and has been uti- lized for several decades. But also failed implants have been increased as compared with early development stage of implant.3-6
There are many related factors affecting implant failure.7,8First group of factors is host related, such as patient age, gender, sys- temic disease, smoking and oral hygiene. Second group is implant placement site related factors such as position in arch, bone qual- ity and bone quantity. Third group is surgery related factors including an initial stability, angulation and direction of
implant and the skillfulness of an operator. Fourth one is implant fixture related factors, such as surface roughness, length, diameter, macrostructure and microstructure of an implant fix- ture. Fifth group is implant prosthesis related factor. That is pros- thesis type, retention method (screw type or cement type), occlusal scheme and so on.
Albrektsson et al.9stated in 1981 that design and surface of implant, condition of implant placement site, surgery technique and occlusal loading condition have an important influence on the successful osseointegration. And a close examination on failure of dental implants has always been an important issue.
Failure of dental implants can be divided into biological and mechanical failure according to failure pattern. Esposito et al.10 had divided implant failure into biological and mechanical type.
Biological failure is defined as no sign of osseointegration around dental implant. Mechanical failure is fixture fracture, screw loos- ening and fracture of screw, restoration fracture and dis- lodgement.
In addition, it can be divided into early failure and late failure according to failure time. First, early failure is one that failed osseointegration within several weeks or several months.
A retrospective study on related factors affecting the survival rate of dental implants
Hee-Won Jang*, DDS, MSD, Jeong-Kyung Kang, DDS, MSD, Ki Lee, DDS, Yong-Sang Lee, DDS, Pil-Kyoo Park, DDS Department of Prosthodontics, Dental Center, Seoul Veterans Hospital, Korea
PURPOSE. The aim of this retrospective study is to analyze the relationship between local factors and survival rate of dental implant which had been installed and restored in Seoul Veterans Hospital dental center for past 10 years. And when the relationship is found out, it could be helpful to predict the prognosis of dental implants. MATERIALS AND METHODS. A retrospective study of patients receiving root-shaped screw- type dental implants placed from January 2000 to December 2009 was conducted. 6385 implants were placed in 3755 patients. The follow- ing data were collected from the dental records and radiographs: patient’s age, gender, implant type and surface, length, diameter, location of implant placement, bone quality, prosthesis type. The correlations between these data and survival rate were analyzed. Statistical analy- sis was performed with the use of Kaplan-Meier analysis, Chi-square test and odds ratio. RESULTS. In all, 6385 implants were placed in 3755 patients (3120 male, 635 female; mean age 65 ±10.58 years). 108 implants failed and the cumulative survival rate was 96.33%. There were significant differences in age, implant type and surface, length, location and prosthesis type (P<.05). No significant differences were found in relation to the following factors: gender, diameter and bone quality (P>.05). CONCLUSION. Related factors such as age, implant type, length, location and prosthesis type had a significant effect on the implant survival. [J Adv Prosthodont 2011;3:204-15]
KEY WORDS: Dental implants; Implant survival; Implant type and surface; Length; Location; Prosthesis type
Corresponding author: Hee-Won Jang
Department of Prosthodontics, Dental Center, Seoul Veterans Hospital 6-2, Dunchon 2-Dong, Kangdong-Gu, Seoul, 134-791, Korea Tel. 82 2 2225 1467: e-mail, [email protected]
Received September 17, 2011 / Last Revison November 15, 2011 / Accepted November 28, 2011
ⓒ 2011 The Korean Academy of Prosthodontics
This is an Open Access article distributed under the terms of the Creative Commons Attribution Non-Commercial License (http://creativecommons.org/licenses/by- nc/3.0) which permits unrestricted non-commercial use, distribution, and reproduction in any medium, provided the original work is properly cited.
*This study had no financial support from any implant company.
It was due to bone necrosis, surgical trauma, bacterial infec- tion, inadequate initial stability and early occlusal loading.11 Late failure is failure that turns up after functional loading of several period of time. It takes place because of infection and excessive loading.12There are many difficulties to figure out the cause of implant success and failure because it is affected by many various factors. It is hard to find a reason- able solution only with in vitro study model. Thus, it is good to get an idea through literature review.
If it gives a clue to the relationship between failure pattern and risk factor, it is beneficial for us to control and overcome it. And it will be helpful to increase the success rate. The pur- pose of this study is to analyze the relationship between related factors and survival rate of dental implant which had been installed and restored in Seoul Veterans Hospital dental center for past 10 years. And by finding the relationship it could be helpful to predict the prognosis of dental implants.
MATERIALS AND METHODS 1. Patient selection
Several surgeons placed implants from January 2000 to December 2009 and some prosthodontists made restorations
in Seoul Veterans Hospital. Periodic recall check for every 6 months was performed for 3755 patients in male 3120, female 635 and 6385 placed implants during the retrospective study.
Before the implant surgery, the operator collected informed consent from all patients. They operated with a careful caution after consulting patients who had systemic diseases to the spe- cialist of internal medicine. After controlling the relative contraindication with a thorough medical consult, they placed implants. However, patients receiving immunosuppressive treat- ment, radiolocal and chemical antitumor therapy, those with hormonal imbalance, osteporosis, pregnant women, the addict of alcohol or drugs, and people having psychiatric disease, intra- oral chronic infectious disease, immune disease and untreat- ed periodontal disease were excluded from the study.
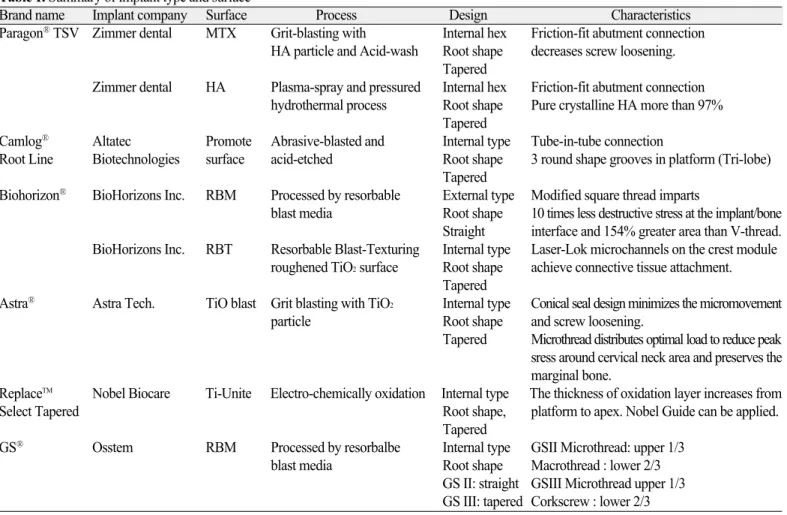
2. Selection of implant type
Eight implant type and surface were used in this study as fol- lows (Table 1).
3. Method of surgery and restoration
After making an alveolocrestal incision under local infiltration anesthesia and reflecting full-thickness flap, implants were placed
Table 1. Summary of implant type and surface
Brand name Implant company Surface Process Design Characteristics
Paragon�TSV Zimmer dental MTX Grit-blasting with Internal hex Friction-fit abutment connection HA particle and Acid-wash Root shape decreases screw loosening.
Tapered
Zimmer dental HA Plasma-spray and pressured Internal hex Friction-fit abutment connection hydrothermal process Root shape Pure crystalline HA more than 97%
Tapered
Camlog� Altatec Promote Abrasive-blasted and Internal type Tube-in-tube connection
Root Line Biotechnologies surface acid-etched Root shape 3 round shape grooves in platform (Tri-lobe) Tapered
Biohorizon� BioHorizons Inc. RBM Processed by resorbable External type Modified square thread imparts
blast media Root shape 10 times less destructive stress at the implant/bone Straight interface and 154% greater area than V-thread.
BioHorizons Inc. RBT Resorbable Blast-Texturing Internal type Laser-Lok microchannels on the crest module roughened TiO2surface Root shape achieve connective tissue attachment.
Tapered
Astra� Astra Tech. TiO blast Grit blasting with TiO2 Internal type Conical seal design minimizes the micromovement particle Root shape and screw loosening.
Tapered Microthread distributes optimal load to reduce peak sress around cervical neck area and preserves the marginal bone.
ReplaceTM Nobel Biocare Ti-Unite Electro-chemically oxidation Internal type The thickness of oxidation layer increases from
Select Tapered Root shape, platform to apex. Nobel Guide can be applied.
Tapered
GS� OsstemRBM Processed by resorbalbe Internal type GSII Microthread: upper 1/3 blast media Root shape Macrothread : lower 2/3
GS II: straight GSIII Microthread upper 1/3 GS III: tapered Corkscrew : lower 2/3
according to the recommendations of the implant company. All surgeries were done with antibiotics premedication. Doctors in Seoul Veterans Hospital dental clinic made a decision on bone quality and quantity which was suggested by Lekholm and Zarb.13 They used a tapping, countersinking drilling if necessary.
Insertion torque values of dental implants were measured with Kavo INTRAsurg 300 plus�(Kavo, Biberach, Germany).
Initial stability was evaluated by insertion torque and judgment of surgeons.
Doctors got an insertion torque at least more than 10 Ncm.
When the threads of implants were exposed to oral cavity or bone defects occurred, surgeons made guided bone regener- ation (GBR). When it was hard to insert implant because of large horizontal and vertical defect of the residual ridge, they made ridge augmentation and got sufficient healing time. In other words, delayed placement or staged approach was performed.
When vertical height of residual ridge was not enough in the molar region of maxilla, they used osteotome sinus floor elevation (OSFE), bone added osteotome sinus floor elevation (BAOSFE), or sinus graft with a lateral window opening. When the condition of an immediate placement was possible, oper- ators did it.
Patients had a periodic recall check more than one time a month. Periotest�was applied for evaluation of the damping characteristics of implant anchoring structures.14The integri- ty of osseointegration and implant stability was measured by OsstellTMmentor.
After more than 3 months of healing period, prosthodontist made progress in conventional prosthetic procedures. If an imme- diate loading was possible, it was limited to the anterior region according to the doctor’s decision. Patients had more than 3 recall checks during the first year after the placement of prosthesis (1 week, 6 months, 1 year, respectively). After 1 year of prosthesis delivery, they received a thorough oral and clinical examination, radiographic survey and measurement of plaque control more than once a year.
4. Related factor
Data, such as patient age, gender, implant type and surface, diameter, length, location, bone quality, prosthesis type were collected and put in order. The effect of factors was ana- lyzed on survival rate. In this study, whether mucosal cover- age was performed or not, additional procedure of surgery, time of implant placement, 3 dimensional placement site, mainte- nance method of prosthesis, occlusal scheme and operator were excluded.
5. Evaluation of survival rate
The guidelines used in this study were suggested by Buser and Cochran et al.15They included inclusion and exclusion criteria.
Buser and Weber suggested success criteria as below.16 a. Absence of persistent subjective complaints, such as
pain, foreign body sensation, and/or dysaesthesia b. Absence of a recurrent peri-implant with suppuration c. Absence of mobility
d. Absence of a continuous radiolucency around implant and no rapid progressive bone loss
e. Possibility of restoration
Implants with abnormal symptom mentioned above were final- ly removed, and implant failure was defined as implant loss or removal. Also, survival period from implant placement to fail- ure or survival period from implant placement to last survey was calculated.
6. Statistical analysis
Survival rate was analyzed with the use of Kaplan-Meier sur- vival analysis method. Chi-square test was used for com- parison within related factors. All statistics were calculated using SAS 9.2 (SAS Inc., North Carolina, USA) software. The level of statistical significance was P-value less than .05.
When comparing significant differences between items with- in related factor, the significance level(P<.05/n, n: number of test) corrected by Bonferroni was used. This corrected an error ratio result from the repeated test.
When proved significantly different with the use of Bonferroni correction, odds ratio could be trusted. Because the implants were exposed to the specific risk factor, odds ratio was calculated to present the probability of failure comparing to the probability of success between groups. For example, when there were 4 groups, set first group I as the standard (=1), and then the fail- ure to success ratio of other II, III and IV groups was denot- ed individually. If odds ratio of group II was larger than the stan- dard (=1), it meant the failure probability of group II was high- er than that of group I.
RESULTS
1. Type of placement and distribution
In this study 6385 implants were placed from January 2000 to December 2009 in 3755 patients.
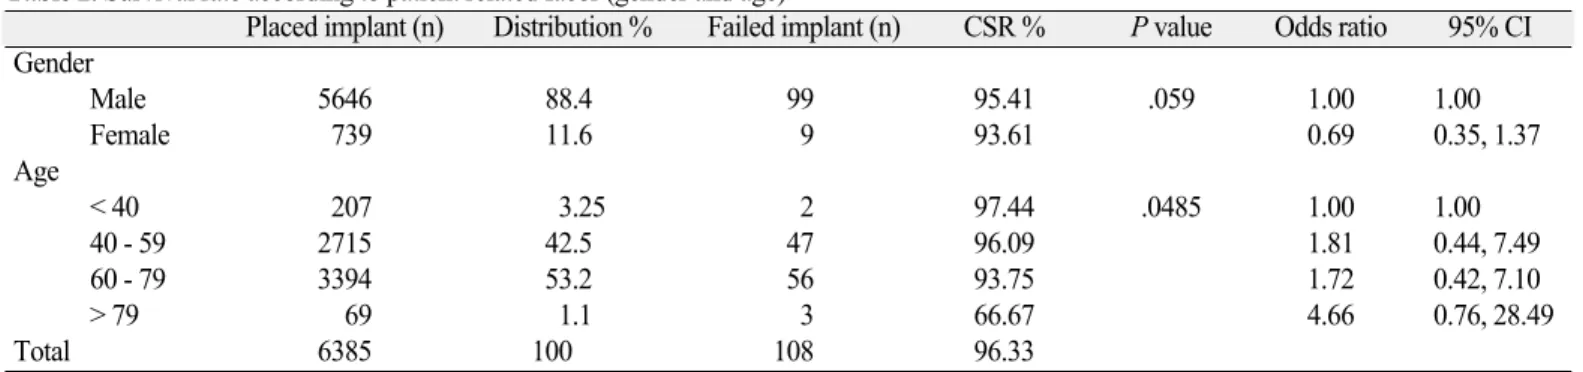
1) Distribution of implants according to gender and age (Table 2)
The number of patients and ratio for male was 3120 (83.09%), and female was 635 (16.91%) respectively.
The age distribution was from 18 to 88 and the mean value was 65±10.58 years.
2) Distribution of implants according to implant type and surface (Table 3)
3) Distribution of implants according to diameter (Table 4)
4) Distribution of implants according to length (Table 5) Diameter and length had a similar tendency. And in the major- ity of cases, wide diameter implant had a long length.
5) Distribution of implants according to location (Table 6)
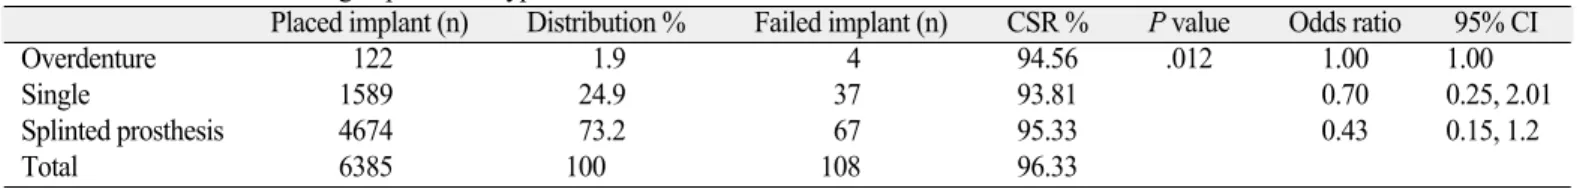
6) Distribution of implants according to prosthesis type (Table 7)
7) Distribution of implants according to bone quality (Table 8) Table 2. Survival rate according to patient related facor (gender and age)
Placed implant (n) Distribution % Failed implant (n) CSR % P value Odds ratio 95% CI Gender
Male 5646 88.4 99 95.41 .059 1.00 1.00
Female 739 11.6 9 93.61 0.69 0.35, 1.37
Age
< 40 207 3.25 2 97.44 .0485 1.00 1.00
40 - 59 2715 42.5 47 96.09 1.81 0.44, 7.49
60 - 79 3394 53.2 56 93.75 1.72 0.42, 7.10
> 79 69 1.1 3 66.67 4.66 0.76, 28.49
Total 6385 100 108 96.33
Table 3. Survival rate according to implant type and surface
Company Placed implant (n) Distribution % Failed implant (n) CSR % P value Odds ratio 95% CI
Astra 280 4.4 6 97.00 .00066 1.00 1.00
Biohorizon RBM 1110 17.4 22 93.74 0.92 0.37, 2.30
Biohorizon RBT 225 3.5 1 99.55 0.20 0.02, 1.71
Camlog 1426 22.3 11 97.35 0.36 0.13, 0.97
GS 660 10.3 3 99.53 0.21 0.05, 0.84
Paragon MTX 2030 31.8 47 93.09 1.08 0.46, 2.56
Paragon HA 127 2.0 5 95.58 1.87 0.56, 6.25
Replace 527 8.3 13 94.81 1.15 0.43, 3.07
Total 6385 100 108 96.33
Table 4. Survival rate according to implant diameter
Placed implant (n) Distribution % Failed implant (n) CSR % P value Odds ratio 95% CI
< 3.75 1026 16.1 22 92.39 .503 1.00 1.00
3.75 - 4.5 2773 43.4 36 96.90 0.60 0.35, 1.03
> 4.5 2586 40.5 50 94.74 0.90 0.54, 1.49
Total 6385 100 108 96.33
Table 5. Survival rate according to implant length
Placed implant (n) Distribution % Failed implant (n) CSR % P value Odds ratio 95% CI
< 10 224 3.5 8 95.11 .0000048 1.00 1.00
10 - 11.5 3541 55.5 64 96.53 0.50 0.24, 1.05
> 11.5 2620 41.0 36 95.22 0.38 0.17, 0.82
Total 6385 100 108 96.33
Table 6. Survival rate according to location
Placed implant (n) Distribution % Failed implant (n) CSR % P value Odds ratio 95% CI
Mx. Ant. 422 6.56 10 94.37 .03 1.00 1.00
Mx. Post. 2690 42.57 54 93.73 0.84 0.43, 1.67
Mn. Ant. 314 4.96 6 93.94 0.80 0.29, 2.23
Mn. Post. 2959 45.91 38 96.35 0.54 0.27, 1.08
Total 6385 100 108 96.33
2. Survival rate
1) Cumulative survival rate
Cumulative survival rate was 96.33%. Average observation period was 45.73±12.48 months in 3755 patients. The obser- vation period was 42.69±30.68 months in male and 48±28.47 months in female. 6385 implants were placed, and 108 of them failed. 3120 male of 3755 patients had 99 failed implants, and 635 female had 9 failed implants.
2) Distribution of implants according to failure stage Among 108 failed implants, 22 implants failed from implant placement to prosthesis delivery (early failure). And 86 implants failed after prosthesis delivery and occlusal loading (late failure). This study represented that it was important to control the occlusal stress and occlusal adjustment.
3) Survival rate according to gender and age (Table 2) Table 2 demonstrates that the survival rate in male was higher than in female. Groups were not significantly different at P<.05. As patients’age was older, the survival rate accord- ing to age decreased. There were significant differences at P<
.05. The survival curve according to gender and age is represented in (Fig. 1).
4) Survival rate according to implant type and surface (Table 3)
Survival rate of Biohorizon�RBT was higher than for oth- er implants, and that of Paragon�MTX was the lowest, because operators placed Paragon�MTX in Seoul Veterans Hospital 10 years ago. And a large number of implants were inserted; therefore practitioners experienced many failures of trial and error for long time. However, Biohorizon�RBT was
technique-sensitive. For that reason when they were accustomed to dental surgeries, doctors inserted small number of Biohorizon� RBT from 2008 to 2009. Groups were significantly different at P<.05. The survival curve according to implant type and sur- face is shown in (Fig. 2).
5) Survival rate according to implant diameter (Table 4) Group II was considered to be regular diameter recorded the highest score among 3 groups, and group I which was regard- ed as narrow diameter represented the lowest one. Groups were not significantly different at P<.05. The survival curve accord- ing to implant diameter is depicted in (Fig. 3).
6) Survival rate according to implant length (Table 5) Group II was looked upon as regular length presented the most superior result, and group I which was counted as short length showed the most inferior score. Groups were significantly different at P<.05. The survival curve according to implant length is shown in (Fig. 4).
7) Survival rate according to location (Table 6)
Survival rate indicated the best result in mandibular poste- riors among 4 groups, and maxillary anteriors, mandibular ante- riors, maxillary posteriors were manifested in the order of sur- vival rate. Groups were significantly different at P<.05. The survival curve according to location is depicted in (Fig. 5).
8) Survival rate according to prosthesis type (Table 7) The survival rate of splinted prosthesis was higher than for other groups. Single crown recorded relatively inferior result.
But, it was reasonable. The outcome of implant overdenture was moderate. Groups were significantly different at P<.05. The sur- vival curve according to prosthesis is represented in (Fig. 6).
Table 7. Survival rate according to prosthesis type
Placed implant (n) Distribution % Failed implant (n) CSR % P value Odds ratio 95% CI
Overdenture 122 1.9 4 94.56 .012 1.00 1.00
Single 1589 24.9 37 93.81 0.70 0.25, 2.01
Splinted prosthesis 4674 73.2 67 95.33 0.43 0.15, 1.2
Total 6385 100 108 96.33
Table 8. Survival rate according to bone quality
Placed implant (n) Distribution % Failed implant (n) CSR % P value Odds ratio 95% CI
Type I 271 4.2 1 99.63 .265 1.00 1.00
Type II 2690 42.1 45 95.76 4.59 0.63, 33.44
Type III 3312 51.9 59 94.45 4.90 0.68, 35.47
Type IV 112 1.8 3 97.06 7.43 0.76, 72.19
Total 6385 100 108 96.33
(%) 100 98 96 94 92 90
A female male
0 2 4 6 8 10 12 14 16 18 20 22 24 26 28 30 32 34 36 38 40 42 44 46 48 50 52 54 56 58 60 62 64 66 68 70 72 74 76 78 80 (month)
(%) 100 98 96 94 92 90 88
B < 40 40 - 49 50 - 59 60 - 69 > 69
0 2 4 6 8 10 12 14 16 18 20 22 24 26 28 30 32 34 36 38 40 42 44 46 48 50 52 54 56 58 60 62 64 66 68 70 72 74 76 78 80 (month) Fig. 1. A: The survival curve according to gender, B: The survival curve according to age.
(%) 100 98 96 94 92 90
Astra Biohorizon RBM Biohorizon RBT Camlog GS Paragon MTX Paragon HA Replace
0 2 4 6 8 10 12 14 16 18 20 22 24 26 28 30 32 34 36 38 40 42 44 46 48 50 52 54 56 58 60 62 64 66 68 70 72 74 76 78 80 (month) Fig. 2. The survival curve according to implant type and surface.
(%) 100 98 96 94 92 90
< 3.75 mm 3.75 - 4.5 mm > 4.5 mm
0 2 4 6 8 10 12 14 16 18 20 22 24 26 28 30 32 34 36 38 40 42 44 46 48 50 52 54 56 58 60 62 64 66 68 70 72 74 76 78 80
(month) Fig. 3. The survival curve according to implant diameter.
(%) 100 98 96 94 92 90
< 10 mm 10 - 11.5 mm > 11.5 mm
0 2 4 6 8 10 12 14 16 18 20 22 24 26 28 30 32 34 36 38 40 42 44 46 48 50 52 54 56 58 60 62 64 66 68 70 72 74 76 78 80
(month) Fig. 4. The survival curve according to implant length.
(%) 100 98 96 94 92 90
Mx. Ant. Mx. Post. Mn. Ant. Mn. Post.
0 2 4 6 8 10 12 14 16 18 20 22 24 26 28 30 32 34 36 38 40 42 44 46 48 50 52 54 56 58 60 62 64 66 68 70 72 74 76 78 80 (month) Fig. 5. The survival curve according to location.
9) Survival rate according to bone quality (Table 8) Type I showed the most superior result and type III stood for the most inferior outcome. There was a tendency of decreased survival rate when bone quality was poor. Type IV had a small number of 112 implants. Therefore, it had a negative effect on statistic analysis. If more implants had been placed in the type IV, more failure would have been found out. Groups were not significantly different at P<.05. The survival curve according to bone quality is represented in (Fig. 7).
DISCUSSION
The purpose of this study was to evaluate the survival rate for dental implants, which was investigated on the basis of patient related factor, implant related factor, site related factor,
restoration factor and bone related factor.
There were significant differences between the related fac- tors and survival rate, and other article reported similar results.17
Other memoirs presented that when patients age increases, failure rate had a tendency of increment.18The retrospective study in Seoul Veterans Hospital showed a similar pattern. There were statistical differences (P=.048).
As people get older, bone density decreases because the amount of bone resorption is greater than amount of bone production.
As the cortical bone is thinner, and porosity increases in spongeous bone.18
And in an animal experiment younger animals have more active formation of spongeous bone, and the bone to implant contact (BIC) ratio increases.19
(%) 100 98 96 94 92 90
overdenture single splint
0 2 4 6 8 10 12 14 16 18 20 22 24 26 28 30 32 34 36 38 40 42 44 46 48 50 52 54 56 58 60 62 64 66 68 70 72 74 76 78 80
(month) Fig. 6. The survival curve according to prosthesis type.
(%) 100 98 96 94 92 90
type I type II type III type IV
0 2 4 6 8 10 12 14 16 18 20 22 24 26 28 30 32 34 36 38 40 42 44 46 48 50 52 54 56 58 60 62 64 66 68 70 72 74 76 78 80 (month) Fig. 7. The survival curve according to bone quality.
The results of other published studies represent that age does not affect the implant success rate.20However, the present study showed the most inferior survival rate in group of patients old- er than 79 years. Other study revealed that gender is an influencing factor. Schwartz et al.21and Wagenberg and Froum22reported that failure rate in male was higher than in female. But, in this study, failure rate in male (4.59%) was lower than female fail- ure rate (6.39%). There were no statistical differences (P=.059).
Survival rate of Astra�(97.0%), Biohorizon�RBT (99.5%), Camlog�(97.34%) and GS�(99.53%) were higher than the mean survival rate of rough surface implants. Survival rate of Biohorizon�RBM (93.74%) was lower than the mean survival rate, because the macrostructure of the implant thread was square type and as many as 1110 implants of Biohorizon�RBM were placed.
The sample size Parogon�MTX implants was the largest among groups. It could have an effect on the statistical analy- sis, because operators placed Paragon�MTX in Seoul Veterans Hospital 10 years ago. A large number of implants were inserted; therefore practitioners experienced many failures of trial and error for long time.
A positive correlation was found between Biohorizon� RBM (93.74%), Paragon� MTX (93.1%) and ReplaceTM (94.81%) from a point of relatively low survival rate. Even though ReplaceTM had a Ti-Unite surface and a root-form fixture, which was easy to get primary stability, it showed a relatively low survival rate than other implants. But, the record of ReplaceTMwas reasonable.
Biohorizon�RBT showed a survival rate of 99.55%, which was different from Biohorizon�RBM (93.74%). Biohorizon� RBT was placed approximately from 2008 to 2009, but Biohorizon�RBM was inserted for 10 years from 2000 to 2009.
The observation period of Biohorizon�RBM was longer.
Consequently, the results of survival rate were different.
This study reported that the survival rate of group I (<3.75 mm) was 92.39%, group II (3.75 - 4.5 mm) 96.90%, and group III (>4.5 mm) 94.74%.
But, Renouard reported that failure rate of narrow width implants in the literature review was low.23Because it was less invasive, and the operators selected the exact diameter to consider the bone quality and biomechanics in edentulous patients who had limited ridge width. Ivanoff mentioned that wide implants with diameter more than 5 mm showed increased fail- ure rate.24The learning curve could affect the results. Operators used wide implants as rescue implants in poor bone quality when they could not achieve primary stability. This present study showed similar result. Hultin-Mordenfeld M said that wide implants had higher failure rates.25Because they were placed in unfavorable situations such as poor bone quality and quan- tity. Recently published papers discuss a fact that there is no correlation between diameter and survival rate.26 Success can be achieved by the development of implant design,
patient selection and adapted surgical technique. In addi- tion, gentle surgical procedure, staged approach, adequate heal- ing time and no exposure of membrane are important. In this present study, implant length influenced survival rate statistically (P=4.84×10⁻⁶). Misch presented that shorter implants less than 10 mm had lower success rates (7 - 25%) than longer 10 mm implants through the literature review of published papers from 1996 to 2003.27 Renouard reported that when machined implants were placed in poor bone qual- ity, short implants less than 10 mm had higher failure rates.
Furthermore, when rough surface implants were placed in poor bone quality without countersinking or with underdrilling, which could increase primary stability, success rate was similar between less than 10 mm and longer than 10 mm implants.23 In fact, the surgical technique of operators was more impor- tant than implant length in clinical practice. Thus, if the practitioners use short implants with a careful attention, they will experience a diminution in failure. As to survival rate in implant location, it was higher in mandible than maxilla, and failure rate of posterior teeth was higher than that of anterior teeth. It is because maxilla has thinner cortical bone and low density in spongeous bone.
Schwartz said that mandibular anteriors showed the lowest failure rate than other parts throughout the literature review.21 In posterior teeth, the implantation was limited by the max- illary sinus or inferior alveolar canal, unfavorable crown to implant ratio, greater occlusal force than anterior teeth, so they had a mechanical disadvantage. There were similar results in present study. Survival rate in mandible (95.15%) was supe- rior to maxilla (94.04%).
This study presented that the failure rate was the highest in maxillary posterior teeth (6.27%), mandibular anterior teeth (6.06%), maxillary anterior teeth (5.63%) and mandibular posterior teeth (3.65%) in the order. It can be surprising why failure rate was so high in mandibular anterior teeth, because dentists inserted implants in type I and type II bone. Thus, implan- tation in hard bone would lead to the resorption of the marginal bone.
Goodacre et al.28presented that failure rate of single crown and fixed partial denture was 3% and 6% individually in partial edentulous patients. The failure rates of fixed partial den- ture and overdenture were 10% and 19% in the full edentulous maxilla. The failure rates of fixed partial denture and overdenture were 3% and 4% in the full edentulous mandible.
When contemplating prosthesis type and arch condition, he reported that the location of restoration had an effect than pros- thesis type. There were very little differences of failure rate according to the restoration type in the mandible, but larger fail- ure rates were exhibited in the maxillary overdenture. Bryant et al.29said the location of restoration was important than the restoration type in case of full mouth rehabilitation. And when prosthodontists restored a full arch dentition with the use
of a fixed partial denture, failure rate was higher (6.6%) in max- illa than the mandible. It was statistically available (P<.001).
When restoring the maxilla with overdenture, 5-year sur- vival rate (76.6%) was lower than for fixed partial denture (87.7%). There were statistical differences (P<.001), because it meant that there was inadequate bone quantity to restore with the use of removable prosthesis before surgery. However, he reported that the 5-year survival rate of overdenture treat- ment in the mandible was 95.7 - 96.7%, and the 10-year survival rate of fixed partial denture was 95.4%. There were no statistical differences of failure rate as to restoration type (P>.05).
After Weber and Sukotjo30researched on 74 papers through literature review, the survival rate of single crown for 6 years was 95.6% and the rate of fixed partial denture was 97.7% in partial edentulous ridges. He reported no statistical differences.
But, this retrospective study showed that there were significant differences at P=.012 between prosthesis types. The present study on implant overdenture revealed that failure occurred in the mandible. No failure appeared in maxilla. The sample size was as small as 122 implants, because most patients did not want removable overdentures. People usually preferred fixed restoration to removable partial denture. If more implants had been placed in the maxilla, more failure would have been revealed.
When bone quality was poor, survival rate of implants had a tendency to decrease. However, there were no significant dif- ferences (P=.26) in present study. However, there was a ten- dency that when bone quality was poor, survival rate decreased from type I to type III. Type IV showed a different pattern. When surgeons placed in poor bone, they gave an attention to bone quality precisely and performed gentle surgical procedure with the proper implant design. This could have an effect on survival rate of type IV.
In this situation bone quality was important, and thus initial stability was significant, too. Initial stability is a factor deter- mined by initial bone to implant contact (BIC) ratio during implantation, surrounding bone density and biomechanical char- acteristics.31That is to say, it is influenced by implant site such as bone quantity, density of spongeous bone and thickness of cortical bone.32Also, surgical techniques, implant shape and implant geometry can have an effect on it.33
Even in poor bone, when operators select proper length, diam- eter, shape, surface of implant and improved surgery methods, they can increase an initial stability. O’Sullivan et al.34grad- ed initial stability after he placed standard Bra�nemark� implant, MK II self-tapping Bra�nemark�implant, MK IV tapered self-tapping Bra�nemark�implant. And he checked ini- tial stability with the use of insertion torque, resonance frequency analysis and removal torque in the maxilla of human cadav- er. He found out that MK IV Bra�nemark�implant recorded the highest value of initial stability. When Alves35 applied a
cylindrical osteotome to the same size of the final drill diam- eter in type IV bone, and inserted a self-tapping tapered form implant, he created bone compaction effect at the coro- nal 1/3.
Above all, he improved bone density and raised initial sta- bility. But, initial stability was not recorded in the present study.
To measure initial stability, a RFA instrument is necessary. It is difficult to verify RFA values every time during surgery, because the smart peg of OsstellTMmentor is disposable and expensive. Most surgeons measure an insertion torque (IT) when it is calculated on the screen of the surgical engine. They gauge a removal torque (RT) when implant is removed from the bone.
To increase the success rate of implants, research and devel- opment of implant shape, geometry and surface treatment should be continued without cessation. To shorten healing period of bone, implants have been developed from pure machined titanium surface to rough treated surfaces.36
Recently developed implants have enough primary stabili- ty to apply an immediate loading. And researches on the surface coating are in progress by achieving secondary stability to make an immediate loading possible.37
Schwartz-Arad et al.21reported that the prerestoration and postrestoration failure were 50.55%, 44.4% respectively in 7- year retrospective study.
Goodacre et al.28said failure rate was similar before and after prosthesis, and failure rate before proshesis is a little higher.
But the results of this retrospective study showed that late fail- ure was higher. Early failure before proshesis was 20.37% and late failure after restoration was 79.63% respectively. There were prosthodontic problems and patient related problems. For example, there could be impression taking error, stone pour- ing problem, and errors in dental laboratory procedure, occlusal interferences, inadequate occlusal adjustment and main- tenance problems. Most patients were old men who had inserted implants in Seoul Veterans Hospital. Age distribution was from 18 to 88 years, and a mean age was 65±10.58 years.
And they were in favor of eating hard and tough traditional Korean food such as Kimchi and Kaktugi. Esposito et al.38said that the systemic condition of a patient could have an influence on host immune response, and when inflammation was exces- sive, it could impede an osseointegration. Above all, it could result in failure. Also, parafunctional habits such as clenching, bruxism and unilateral chewing which gave rise to excessive loading might result in late failure. Many authors said that most failure usually occurred within one year after implantation. And they concluded it as a primary biologic failure due to the break- down of osseointegration.38However, when surgeon placed the machined surface implants in maxillary posterior teeth of smoker, the osseointegration was not continuous. And after the delivery of prosthesis, there was the tendency that the stabil- ity of interfacial bone decreased gradually. They called it
‘primary and secondary failure’.39,40
This retrospective study estimated how patient age, gender, implant type and surface, length, diameter, location, bone quality and restoration type could influence survival rate among the various factors which were related with implant sur- vival. In addition, there were various factors related with patient’s systemic disease, bone graft and barrier membrane, sinus graft, osteoporosis, smoking and hormonal imbalance.
Also, factors which could influence survival rate were very diverse such as the cause of tooth loss, immediate place- ment, immediate loading and so on. Various factors com- bined systematically with compound could determine the survival rate. But, they were not analyzed in this study. If long term well-controlled prospective studies are made, the relationship between factors which influence survival rate will be found out more objectively and consecutively. When many research centers draw a common conclusion on the reason of implant failure, common factors related with survival rate will have greater influence on failure. Thus, further studies are needed on them.
CONCLUSION
As implant survival rate is influenced by various factors, it is difficult to analyze a cause of failure objectively. In this study related factors were evaluated for implant placement i.e.patient’s age and gender, implant type and surface, diameter and length, location, prosthesis type, bone quality. Within the lim- itations of this study, the following conclusions were drawn:
1. 6385 implants were placed in 3755 patients. 3120 of them were male, and 635 were female. Age distribution was from 18 to 88 years and a mean age was 65±10.58 years. 108 implants of them failed and the cumulative sur- vival rate was 96.33%.
2. There were significant differences in age, implant type and surface, length, location and prosthesis type (P<.05).
They had an influence on implant survival rate.
3. There were no statistical differences in gender, diameter and bone quality (P>.05).
4. There were low survival rates in age older than 79 (66.67%), female (93.61%), Paragon�TSV (93.09%), narrow implant less than 3.75 mm (92.39%), short implant less than 10 mm (95.11%), maxillay posterior teeth (93.73%), single implant (93.81%) and type III bone (94.45%).
ACKNOWLEDGEMENT
Other practitioners contributed to this study.
Prosthodontist Jin-Uk Choi, periodontist Jeong-A You and Dong-Woon Lee gave advice on this study and analyzed it with scientific concept.
Thanks for thier careful assistance and devoted efforts.
REFERENCES
1. Bra�nemark PI, Adell R, Breine U, Hansson BO, Lindstro¨m J, Ohlsson A. Intra-osseous anchorage of dental prostheses. I.
Experimental studies. Scand J Plast Reconstr Surg 1969;3:81- 100.
2. Bra�nemark PI, Hansson BO, Adell R, Breine U, Lindstro¨m J, Halle′n O, Ohman A. Osseointegrated implants in the treatment of the edentulous jaw. Experience from a 10-year period.
Scand J Plast Reconstr Surg Suppl 1977;16:1-132.
3. Adell R, Lekholm U, Rockler B, Bra�nemark PI. A 15-year study of osseointegrated implants in the treatment of the eden- tulous jaw. Int J Oral Surg 1981;10:387-416.
4. Adell R, Eriksson B, Lekholm U, Bra�nemark PI, Jemt T. Long- term follow-up study of osseointegrated implants in the treatment of totally edentulous jaws. Int J Oral Maxillofac Implants 1990;5:347-59.
5. Buser D, Mericske-Stern R, Bernard JP, Behneke A, Behneke N, Hirt HP, Belser UC, Lang NP. Long-term evaluation of non-submerged ITI implants. Part 1: 8-year life table analysis of a prospective multi-center study with 2359 implants. Clin Oral Implants Res 1997;8:161-72.
6. Esposito M, Grusovin MG, Coulthard P, Thomsen P, Worthington HV. A 5-year follow-up comparative analysis of the efficacy of various osseointegrated dental implant systems: a systematic re- view of randomized controlled clinical trials. Int J Oral Maxillofac Implants 2005;20:557-68.
7. el Askary AS, Meffert RM, Griffin T. Why do dental implants fail? Part I. Implant Dent 1999;8:173-85.
8. el Askary AS, Meffert RM, Griffin T. Why do dental implants fail? Part II. Implant Dent 1999;8:265-77.
9. Albrektsson T, Bra�nemark PI, Hansson HA, Lindstro¨m J.
Osseointegrated titanium implants. Requirements for ensur- ing a long-lasting, direct bone-to-implant anchorage in man. Acta Orthop Scand 1981;52:155-70.
10. Esposito M, Hirsch JM, Lekholm U, Thomsen P. Biological fac- tors contributing to failures of osseointegrated oral implants. (II).
Etiopathogenesis. Eur J Oral Sci 1998;106:721-64.
11. Tonetti MS, Schmid J. Pathogenesis of implant failures.
Periodontol 2000 1994;4:127-38.
12. Albrektsson T, Dahl E, Enbom L, Engevall S, Engquist B, Eriksson AR, Feldmann G, Freiberg N, Glantz PO, Kjellman O, et al. Osseointegrated oral implants. A Swedish multicenter study of 8139 consecutively inserted Nobelpharma implants. J Periodontol 1988;59:287-96.
13. Lekholm U, Zarb, G. Patient selection and preparation. In:
Bra�nemark PI, Zarb GA & Albrektsson T (eds). Tissue integrated prosheses: Osseointegration in clinical Dentistry. Chicago:
Quintessence Publishing Co, 1985. p. 199-209.
14. Tricio J, Laohapand P, van Steenberghe D, Quirynen M, Naert I. Mechanical state assessment of the implant-bone continuum:
a better understanding of the Periotest method. Int J Oral Maxillofac Implants 1995;10:43-9.
15. Cochran DL, Buser D, ten Bruggenkate CM, Weingart D, Taylor TM, Bernard JP, Peters F, Simpson JP. The use of reduced healing times on ITI implants with a sandblasted and acid- etched (SLA) surface: early results from clinical trials on ITI SLA implants. Clin Oral Implants Res 2002;13:144-53.
16. Buser D, Weber HP, Lang NP. Tissue integration of non-sub- merged implants. 1-year results of a prospective study with 100 ITI hollow-cylinder and hollow-screw implants. Clin Oral Implants Res 1990;1:33-40.
17. Kim SH, Kim SJ, Lee KW, Han DH. The effects of local factors on the survival rate of dental implants: A 19 year retrospective study. J Korean Acad Prosthodont 2010;48:28-40.
18. Bryant SR. The effects of age, jaw site, and bone condition on oral implant outcomes. Int J Prosthodont 1998;11:470-90.
19. Shirota T, Ohno K, Suzuki K, Michi K. The effect of aging on the healing of hydroxylapatite implants. J Oral Maxillofac Surg 1993;51:51-6.
20. Smith RA, Berger R, Dodson TB. Risk factors associated with dental implants in healthy and medically compromised pa- tients. Int J Oral Maxillofac Implants 1992;7:367-72.
21. Schwartz-Arad D, Laviv A, Levin L. Failure causes, timing, and cluster behavior: an 8-year study of dental implants. Implant Dent 2008;17:200-7.
22. Wagenberg B, Froum SJ. A retrospective study of 1925 con- secutively placed immediate implants from 1988 to 2004. Int J Oral Maxillofac Implants 2006;21:71-80.
23. Renouard F, Nisand D. Impact of implant length and diameter on survival rates. Clin Oral Implants Res 2006;17:35-51.
24. Ivanoff CJ, Gro¨ndahl K, Sennerby L, Bergstro¨m C, Lekholm U.
Influence of variations in implant diameters: a 3- to 5-year retrospective clinical report. Int J Oral Maxillofac Implants 1999;14:173-80.
25. Mordenfeld MH, Johansson A, Hedin M, Billstro¨m C, Fyrberg KA. A retrospective clinical study of wide-diameter implants used in posterior edentulous areas. Int J Oral Maxillofac Implants 2004;19:387-92.
26. Shin SW, Bryant SR, Zarb GA. A retrospective study on the treat- ment outcome of wide-bodied implants. Int J Prosthodont 2004;17:52-8.
27. Misch CE. Short dental implants: a literature review and rationale for use. Dent Today 2005;24:64-6, 68.
28. Goodacre CJ, Bernal G, Rungcharassaeng K, Kan JY. Clinical complications with implants and implant prostheses. J Prosthet Dent 2003;90:121-32.
29. Bryant SR, MacDonald-Jankowski D, Kim K. Does the type of implant prosthesis affect outcomes for the completely edentu- lous arch? Int J Oral Maxillofac Implants 2007;22:117-39.
30. Weber HP, Sukotjo C. Does the type of implant prosthesis af- fect outcomes in the partially edentulous patient? Int J Oral Maxillofac Implants 2007;22:140-72.
31. Meredith N, Shagaldi F, Alleyne D, Sennerby L, Cawley P. The application of resonance frequency measurements to study the stability of titanium implants during healing in the rabbit tibia.
Clin Oral Implants Res 1997;8:234-43.
32. Huwiler MA, Pjetursson BE, Bosshardt DD, Salvi GE, Lang NP.
Resonance frequency analysis in relation to jawbone characteristics and during early healing of implant installation. Clin Oral Implants Res 2007;18:275-80.
33. Rabel A, Ko¨hler SG, Schmidt-Westhausen AM. Clinical study on the primary stability of two dental implant systems with res- onance frequency analysis. Clin Oral Investig 2007;11:257-65.
34. O’Sullivan D, Sennerby L, Meredith N. Measurements comparing the initial stability of five designs of dental implants: a human cadaver study. Clin Implant Dent Relat Res 2000;2:85-92.
35. Alves CC, Neves M. Tapered implants: from indications to ad- vantages. Int J Periodontics Restorative Dent 2009;29:161-7.
36. Iezzi G, Degidi M, Scarano A, Perrotti V, Piattelli A. Bone re- sponse to submerged, unloaded implants inserted in poor bone sites: a histological and histomorphometrical study of 8 titani- um implants retrieved from man. J Oral Implantol 2005;31:225- 33.
37. Cochran DL. The evidence for immediate loading of implants.
J Evid Based Dent Pract 2006;6:155-63.
38. Esposito M, Hirsch J, Lekholm U, Thomsen P. Differential di- agnosis and treatment strategies for biologic complications and failing oral implants: a review of the literature. Int J Oral Maxillofac Implants 1999;14:473-90.
39. Balshe AA, Eckert SE, Koka S, Assad DA, Weaver AL. The ef- fects of smoking on the survival of smooth- and rough-surface dental implants. Int J Oral Maxillofac Implants 2008;23:1117- 22.
40. Esposito M, Hirsch JM, Lekholm U, Thomsen P. Biological fac- tors contributing to failures of osseointegrated oral implants. (I).
Success criteria and epidemiology. Eur J Oral Sci 1998;106:527- 51.