Annals of Rehabilitation Medicine
Ann Rehabil Med 2017;41(6):1028-1038 pISSN: 2234-0645 • eISSN: 2234-0653 https://doi.org/10.5535/arm.2017.41.6.1028
Rapid, Objective and Non-invasive Diagnosis of Sudomotor Dysfunction in Patients
With Lower Extremity Dysesthesia:
A Cross-Sectional Study
Choong Sik Chae, MD
1, Geun Young Park, MD, PhD
2, Yong-Min Choi, MD
3, Sangeun Jung, MD
1, Sungjun Kim, MD
1, Donggyun Sohn, MD
2, Sun Im, MD, PhD
21
Department of Rehabilitation Medicine, Seoul St. Mary’s Hospital, College of Medicine, The Catholic University of Korea, Seoul;
2
Department of Rehabilitation Medicine, Bucheon St. Mary’s Hospital, College of Medicine,
The Catholic University of Korea, Bucheon;
3Department of Rehabilitation Medicine, Dongsan Medical Center, School of Medicine, Keimyung University, Daegu, Korea
Objective To determine whether patients with lumbosacral (LS) radiculopathy and peripheral polyneuropathy (PPNP) exhibit sudomotor abnormalities and whether SUDOSCAN (Impeto Medical, Paris, France) can complement nerve conduction study (NCS) and electromyography (EMG).
Methods Outpatients with lower extremity dysesthesia underwent electrophysiologic studies and SUDOSCAN.
They were classified as normal (group A), LS radiculopathy (group B), or PPNP (group C). Pain severity was measured by the Michigan Neuropathy Screening Instrument (MNSI) and visual analogue scale (VAS).
Demographic features, electrochemical skin conductance (ESC) values on hands and feet, and SUDOSCAN-risk scores were analyzed.
Results There were no statistical differences in MNSI and VAS among the three groups. Feet-ESC and hands-ESC values in group C were lower than group A and B. SUDOSCAN-risk score in group B and C was higher than group A.
With a cut-off at 48 microSiemens of feet-ESC, PPNP was detected with 57.1% sensitivity and 94.2% specificity (area under the curve [AUC]=0.780; 95% confidence interval [CI], 0646–0.915). With a SUDOSCAN-risk score cut-off at 29%, NCS and EMG abnormalities related to LS radiculopathy and PPNP were detected with 64.1% sensitivity and 84.2% specificity (AUC=0.750; 95% CI, 0.674–0.886).
Conclusion SUDOSCAN can discriminate outpatients with abnormal electrophysiological findings and sudomotor dysfunction. This technology may be a complementary tool to NCS and EMG in outpatients with lower extremity dysesthesia.
Keywords Radiculopathy, Diabetes mellitus, Polyneuropathies, Small fiber neuropathy, Galvanic skin response
Received March 15, 2017; Accepted May 29, 2017 Corresponding author: Sun Im
Department of Rehabilitation Medicine, Bucheon St. Mary’s Hospital, College of Medicine, The Catholic University of Korea, 327 Sosa-ro, Wonmi-gu, Bucheon 14647, Korea. Tel: +82-32-340-2182, Fax: +82-32-340-7640, E-mail: [email protected]
ORCID: Choong Sik Chae (http://orcid.org/0000-0001-7336-7442); Geun Young Park (http://orcid.org/0000-0002-6587-6471); Yong-Min Choi (http://
orcid.org/0000-0001-7174-5489); Sangeun Jung (http://orcid.org/0000-0001-7964-1510); Sungjun Kim (http://orcid.org/0000-0002-4517-7294);
Donggyun Sohn (http://orcid.org/0000-0003-2796-3918); Sun Im (http://orcid.org/0000-0001-8400-4911).
This is an open-access article distributed under the terms of the Creative Commons Attribution Non-Commercial License (http://creativecommons.org/
licenses/by-nc/4.0) which permits unrestricted noncommercial use, distribution, and reproduction in any medium, provided the original work is properly cited.
Copyright © 2017 by Korean Academy of Rehabilitation Medicine
INTRODUCTION
Dysesthesia accompanied by pain in the lower extremi- ties is a common complaint in outpatient clinics. It can result from diverse causes that include overuse of back muscles, zygapophyseal joint degeneration, disc hernia- tion, spine instability such as spondylolisthesis, spondy- lolysis, lumbosacral (LS) radiculopathy, and peripheral polyneuropathy (PPNP) [1]. LS radiculopathy and PPNP are frequently present in patients with lower extremity dysesthesia [2,3]. Physical examination and pain ques- tionnaires may not be adequate for a diagnosis because of their subjective nature, which underestimates detec- tion compared to other tools [4]. Imaging of only struc- tural lumbar lesions can be insufficiently revealing and provides limited information in cases of LS radiculopa- thy. Nerve conduction study (NCS) and needle electro- myography (EMG) can help diagnose LS radiculopathy and PPNP [5-8]. However, these tools can only reveal abnormalities of the large fiber nerves and not those in- volving the small fibers [9]. Small fiber dysfunction has been linked to pain associated with diabetic neuropathy, chronic kidney disease, autonomic diseases, vasculitis and fibromyalgia [10].
There is a need for tests that are less time-consuming and less invasive than conventional tests. Also, assess- ment of small fibers through sudomotor evaluation might be helpful in evaluating dysesthesia of the lower extremi- ties. The American Diabetes Association recommends evaluation of sudomotor function for early diagnosis of neuropathy and small fiber involvement in diabetes mel- litus (DM) patients [11]. SUDOSCAN (Impeto Medical, Paris, France) is a novel quantitative assessment tool that provides index values of the thin, unmyelinated C fibers and assesses sudomotor function by evaluating the secretory function of the sweat glands. This device is a noninvasive, painless, and convenient tool that mea- sures electrical conduction activity in the hands and feet by reflecting cholinergic neurotransmission of the sweat glands. Also its diagnostic validity to reflect small fiber function has already proven by past test with skin biopsy results [12-15]. However, the current literature on its use has been mainly limited to PPNP patients, and its appli- cation to other patients with lower extremity dysesthesia related to different causes have not been proven. Proper diagnosis of sudomotor dysfunction, which can lead to
painful dysesthesia, is important [9,16]. The clinical util- ity and benefit of evaluating sudomotor dysfunction us- ing SUDOSCAN among outpatients with mixed etiologies remain unclear.
In addition to patients with PPNP, there is evidence that both the sudomotor system and sympathetic responses are involved in patients with painful LS radiculopathy [16-18]. Significant prolongation of sympathetic skin re- sponse (SSR) latency has been found in LS radiculopathy and failed back surgery syndrome (FBSS) [16,17]. There is a considerable theoretical support to help detect sym- pathetic and sudomotor dysfunction in LS radiculopathy.
However, no clinical studies have attempted to use it in patients with LS radiculopathy.
The primary study objective was to investigate whether SUDOSCAN could detect differences of its parameters in outpatients with dysesthesia of the lower extremities related to PPNP or LS radiculopathies who had been referred for NCS and EMG evaluations. The secondary objective was to assess the diagnostic validity of the ob- tained values related with sudomotor dysfunction values and determine the clinical utility compared with conven- tional NCS and needle EMG studies.
MATERIALS AND METHODS Patient enrollment
This cross-sectional study was conducted from May 1, 2015 to August 31, 2015, and was based on outpatients who had been referred from an NCS and EMG clinic for dysesthesia and discomfort in the lower extremities to the EMG clinic at our institution. Preliminary clinical history taking, physical, and electrophysiological examinations were performed by physicians. Exclusion criteria were symptoms and signs confined to the upper extremity related to cervical radiculopathy or upper extremity en- trapment neuropathies, prior amputation of arms or legs and implanted electrical devices, episodes of trauma, in- complete electrophysiologic studies, and previous LS ra- diculopathy or PPNP history (Fig. 1). The study protocols were approved by Bucheon St. Mary’s Hospital, Catholic University of Korea local ethical boards of committee (HC15RISI0100).
Patient demographic characteristics
Clinical and demographic characteristics, including
sex, age, pre-existing comorbidities like DM, lumbar spine surgery, alcohol consumption, body mass index (BMI), serum fasting glucose, serum uric acid, serum creatinine, total cholesterol (TC), total triglyceride (TG), low-density lipoprotein (LDL), and high-density lipo- protein (HDL) were retrieved from medical records. The Michigan Neuropathy Screening Instrument (MNSI) and visual analogue scale (VAS) were used to record the na- ture and severity of pain.
NCS and EMG
NCS was performed with a Viking Electromyography System (Nicolet-Viasys Biomedical Inc., Madison, WI, USA) with a setting of 20 Hz for the lower filter, 3 kHz for upper filter for sensory studies, and 5–10 kHz for motor studies. The pulse duration was with 0.1 ms. NCS tests included the sural sensory, superficial peroneal sensory, common peroneal motor, and tibial motor nerves. The minimum F-response latencies from both tibial nerves and H-reflex latencies from tibial nerve stimulation were collected. EMG needling was done by inserting the mo- nopolar needle in selected lower extremity muscles and lumbar paraspinalis muscles from the L1-L2 to L5-S1 levels. All NCS and EMG tests were performed by expe- rienced physicians with more than 3 years experience in the procedures. NCS results obtained from only one side
were used in the statistical analysis.
Patients were stratified by electrophysiological results into normal (group A), LS radiculopathy (group B), and PPNP (group C) findings. Group A patients had normal latency range and amplitude on NCS without abnormal spontaneous activity in the sampled muscles. Group B patients had abnormal spontaneous activity, such as positive sharp waves and other denervation potentials, in the tested muscles with normal NCS parameters [19,20].
Total visited patients (n=401)
SUDOSCAN evaluation Patients underwent with NCS and EMG (n=121)
Enrolled patients (n=73)
Normal findings on NCS and EMG
: Group A (n=34) LS radiculopathy on NCS and EMG
: Group B (n=18) PPNP on NCS and EMG
: Group C (n=21) 1st exclusion (n=280)
Symptoms on upper extremities
2nd exclusion (n=48)
Progressive muscle and neuropathy disease, episodes of trauma, amputee of arms or legs incomplete NCS and EMG,
implanted electrical devices, rheumatic disease, myopathy or
previous LS radiculopathy or PPNP history
Fig. 1. Flow chart of participants. NCS, nerve conduction study; EMG, electromyography; LS, lumbosacral; PPNP, pe- ripheral polyneuropathy.
A B
Fig. 2. Position of a subject undergoing a typical SUDO-
SCAN examination performed in standing position with
full contact of electrodes on the hands (A) and the feet (B).
A Feet conductances & asymmetry Hands conductances & asymmetry Left
Right ANALYSIS:
Feet mean ESC: 74 S Feet mean asymmetry: 7%
SUDOSCAN-risk score: 11%
Left
Right ANALYSIS:
Hands mean ESC: 70 S mean asymmetry: 6%
SUDOSCAN-risk score: 11%
Hands
B
C
Feet conductances & asymmetry
Feet conductances & asymmetry
Hands conductances & asymmetry
Hands conductances & asymmetry Left
Left
Right
Right ANALYSIS:
Feet mean ESC: 71 S Feet mean asymmetry: 4%
SUDOSCAN-risk score: 32%
ANALYSIS:
Feet mean ESC: 20 S Feet mean asymmetry: 4%
SUDOSCAN-risk score: 35%
Left
Left
Right
Right ANALYSIS:
Hands mean ESC: 65 S Hands mean asymmetry: 4%
SUDOSCAN-risk score: 32%
ANALYSIS:
Hands mean ESC: 31 S Hands mean asymmetry: 32%
SUDOSCAN-risk score: 35%
Fig. 3. Representative figures from each group obtained from SUDOSCAN. (A) Results obtained in a patient who showed normal NCS and needle EMG findings with normal mean feet ESC with low SUDOSCAN risk score. (B) Results obtained in a patient with needle EMG findings compatible with lumbosacral radiculopathies with normal mean feet ESC but increased SUDOSCAN-risk score. (C) Results obtained in a patient with NCS findings compatible with pe- ripheral polyneuropathy with low mean feet ESC and increased SUDOSCAN-risk score. NSC, nerve conduction study;
EMG, electromyography; ESC, electrochemical skin conductance.
Group C had reduced sensory nerve action potential (SNAP) amplitudes of the sural nerve (<10 mV) and ab- normal peroneal (compound muscle action potential [CMAP] and/or F-wave) responses [21]. Patients were in- cluded in group C when reduced amplitudes of SNAPs in both sural nerves [22].
ESC and SUDOSCAN-risk score
SUDOSCAN was performed on the same day by a sepa- rate examiner blind to patient’s clinical symptoms and history before NCS and EMG evaluation. Sudomotor function was assessed as ESC values and SUDOSCAN- risk score using two pairs of electrodes for the feet and hands, and connected to a computer for data recording and modulation [11]. Subjects maintained contact with the electrodes for 3 minutes after their age, height, and weight had been recorded (Fig. 2). ESC values were cal-
culated by analysis of electrochemical currents generated in response to low voltage stimulation and expressed in microsiemens (mS) [12] (Fig. 3).
Lower ESC values indicated dysfunction of the sweat glands. SUDOSCAN-risk scores were calculated automat- ically from ESC values, BMI, and age using an algorithm included in the device software. Scores are presented as percentages. Higher SUDOSCAN-risk scores have been related to increased risk of cardiac autonomic abnormal- ities. Both ESC values and SUDOSCAN-risk scores were displayed numerically with graphs on the device monitor.
Statistical analyses
Descriptive statistics are expressed numerically and as percentages for categorical variables, and as mean±standard deviation for continuous variables. De- mographic characteristics and NCS values were com-
Table 1. Baseline characteristics of the enrolled patients
Characteristic Total
(n=73) Group A
(n=34) Group B
(n=18) Group C
(n=21) p-value
Age (yr) 53.59±12.92 48.79±12.67 55.00±12.50 60.14±10.83
a)0.011*
Gender 0.038*
Male 36 14 7 15
a,b)Female 37 20 11 6
a,b)Underlying DM history 20 (26.03) 4 (11.76) 3 (16.67) 12 (57.14)
a,b)0.001**
Chronic alcoholics 14 (19.17) 6 (17.65) 0 (0) 8 (38.09)
a,b)0.013*
Lumbar spine operation 4 (5.41) 1 (2.94) 2 (11.11) 1 (4.55) 0.473
BMI (kg/m
2) 23.13±2.74 23.00±2.72 24.80±2.82 21.91±2.00
b)0.005**
Laboratory findings
Fasting glucose (mg/dL) 117.18±54.72 99.92±15.61 104.83±15.84 155.71±89.23
a,b)<0.001 ***
Serum creatinine (mg/dL) 0.87±0.29 0.88±0.35 0.84±0.17 0.87±0.27 0.967 Serum uric acid (mg/dL) 5.01±1.27 5.19±1.33 4.1±0.73
a)5.49±1.16
a,b)<0.001***
TC (mg/dL) 180.44±36.52 189.11±38.66 179.78±29.97 166.98±35.42 0.085 LDL (mg/dL) 108.71±31.11 115.58±31.66 113.50±25.31 93.47±30.69
a,b)0.007**
HDL (mg/dL) 56.28±11.08 56.88±9.81 56.75±7.91 54.90±15.07 0.811
TG (mg/dL) 134.92±82.20 148.09±79.53 110.12±48.65 134.84±105.01 0.117 Pain severity
VAS 5.62±2.05 5.62±2.10 5.44±1.82 5.76±2.23 0.901
MNSI 5.03±2.35 5.06±2.47 5.06±2.18 4.95±2.38 0.982
Values are presented as mean±standard deviation or number (%).
The patients were classified to the normal (group A), lumbosacral radiculopathy (group B), or peripheral polyneurop- athy group (group C) according to nerve conduction study and electromyography examinations.
BMI, body mean index; DM, diabetes mellitus; TC, total cholesterol; LDL, low density lipoprotein; HDL, high-density lipoprotein; TG, total triglyceride; VAS, visual analogue scale; MNSI, Michigan Neuropathy Screening Instrument.
*p<0.05, **p<0.01, ***p<0.001.
a)
p<0.05 in comparison with group A,
b)p<0.05 in comparison with group B.
pared by Kruskal-Wallis test followed by Man-Whitney U-test to identify differences among the three groups.
Analysis of covariance (ANCOVA) followed by least sig- nificant difference (LSD) analysis were used to compare differences of SUDOSCAN-risk scores, hands-ESC, feet- ESC, and asymmetry of ESC on hands and feet, among the three groups with adjustment for age and DM history, which was confirmed showing normal distribution by Kolmogorov-Smirnov test [23].
Receiver operating characteristic (ROC) curves were calculated to estimate the effectiveness of foot-ESC val- ues to predict PPNP and SUDOSCAN-risk scores in the abnormal electrophysiological findings of groups B and C.
Spearman correlation coefficients were calculated to cor- relate NCS parameters (SNAP latencies and amplitude) with hands-ESC, feet-ESC, and SUDOSCAN-risk score.
Two-sided p-values <0.05 were considered significant.
Statistical analyses were performed using SPSS ver. 19.0 (SPSS Inc., Chicago, IL, USA).
RESULTS
Enrollment and demographic characteristics of outpatients
Out of the 401 patients who visited the electromyogra- phy clinic, 73 outpatients met the inclusion criteria. Thir- ty-four patients had normal NCS and EMG results (group A), 18 were diagnosed with LS radiculopathy (group B), and 21 with PPNP (group C). The patient demographic and clinical characteristics are shown in Table 1. There were no significant differences in MNSI and VAS scores among the three groups. There were significant baseline differences in age, sex, history of DM and alcohol abuse, BMI, serum fasting glucose, serum uric acid, and LDL level.
NCS and EMG results
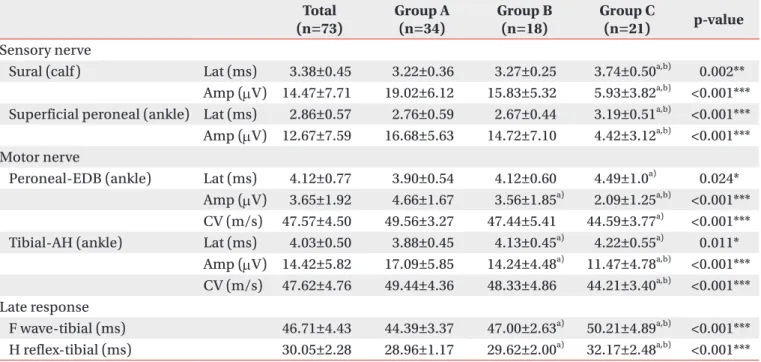
NCS did not reveal right to left side difference in any group. As expected, the latencies and amplitudes of SNAPs and CMAPs in all tested nerves of group C were significantly lower than in other groups (Table 2). The
Table 2. Nerve conduction study findings in three groups (left side) Total
(n=73) Group A
(n=34) Group B
(n=18) Group C
(n=21) p-value Sensory nerve
Sural (calf) Lat (ms) 3.38±0.45 3.22±0.36 3.27±0.25 3.74±0.50
a,b)0.002**
Amp (mV) 14.47±7.71 19.02±6.12 15.83±5.32 5.93±3.82
a,b)<0.001***
Superficial peroneal (ankle) Lat (ms) 2.86±0.57 2.76±0.59 2.67±0.44 3.19±0.51
a,b)<0.001***
Amp (mV) 12.67±7.59 16.68±5.63 14.72±7.10 4.42±3.12
a,b)<0.001***
Motor nerve
Peroneal-EDB (ankle) Lat (ms) 4.12±0.77 3.90±0.54 4.12±0.60 4.49±1.0
a)0.024*
Amp (mV) 3.65±1.92 4.66±1.67 3.56±1.85
a)2.09±1.25
a,b)<0.001***
CV (m/s) 47.57±4.50 49.56±3.27 47.44±5.41 44.59±3.77
a)<0.001***
Tibial-AH (ankle) Lat (ms) 4.03±0.50 3.88±0.45 4.13±0.45
a)4.22±0.55
a)0.011*
Amp (mV) 14.42±5.82 17.09±5.85 14.24±4.48
a)11.47±4.78
a,b)<0.001***
CV (m/s) 47.62±4.76 49.44±4.36 48.33±4.86 44.21±3.40
a,b)<0.001***
Late response
F wave-tibial (ms) 46.71±4.43 44.39±3.37 47.00±2.63
a)50.21±4.89
a,b)<0.001***
H reflex-tibial (ms) 30.05±2.28 28.96±1.17 29.62±2.00
a)32.17±2.48
a,b)<0.001***
Values are presented as mean±standard deviation.
The patients were classified to the normal (group A), lumbosacral radiculopathy (group B), or peripheral polyneurop- athy group (group C) according to nerve conduction study and electromyography examinations.
EDB, extensor digitorum brevis; AH, abductor halluces; Lat, latency (motor, onset latency; sensory, peak latency);
Amp, amplitude; CV, conduction velocity.
*p<0.05, **p<0.01, ***p<0.001.
a)
p<0.05 in comparison with group A,
b)p<0.05 in comparison with group B.
EMG profiles in group B showed denervation potentials in the lumbar paraspinalis muscles with multiple level involvement in 7 patients (38.9%), single level involve- ment in 8 (44.4%) patients, and in the lower limbs in 7 patients (38.9%). PPNP was associated with underlying alcohol consumption in 4 patients, uremia in 2, DM in 12, and was idiopathic in 3.
Low feet-ESCs were significantly correlated with de- creased amplitudes of SNAPs of sural and superficial pe- roneal nerves (r=0.274 to 0.358, p<0.002 to 0.019). Hands- ESCs showed no correlation with amplitudes of sural and superficial peroneal nerves (r=0.133 to 0.198, p=0.126 to 0.263). High SUDOSCAN-risk score was significantly correlated with decreased SNAP amplitudes in both su- ral and superficial peroneal nerves (r=−0.352 to −0.415, p<0.001 to 0.002). ESC values and SUDOSCAN-risk score were not statistically correlated with latencies in both su- ral and superficial peroneal nerves.
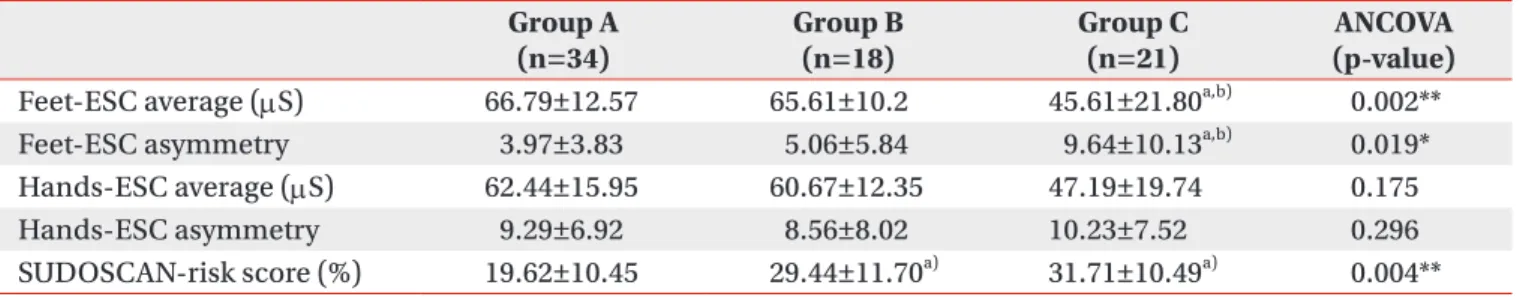
Differences of SUDOSCAN values ESC values and its diagnostic validity
Comparison of ESC values among the three groups was done using ANCOVA followed by LSD. The results indicated that feet-ESC values and asymmetry of group C were statistically different from those in groups A and B (Table 3).
Feet-ESC had a 57.1% sensitivity and 94.2% specificity at 48 mS to detect PPNP (95% confidence interval [CI], 0.646–0.915) with 80.0% positive predictive value and 84.5% negative predictive value. Hands-ESC had 71.4%
sensitivity and 78.8% specificity at 55 mS (95% CI, 0.577–
0.860) with a 57.7% positive predictive value and 87.2%
negative predictive value.
SUDOSCAN-risk score
ANCOVA followed by LSD revealed significantly higher SUDOSCAN-risk scores were in groups B and C than group A (Table 3). The sensitivity and specificity of the SUDOSCAN-risk score for detecting abnormal electro- physiological findings (LS radiculopathy and PPNP) were 64.1% and 82.4%, respectively, at a cut-off on 29% and area under the curve (AUC) of 0.780 (95% CI, 0.674–0.886) with a positive predictive value of 80.65% and negative predictive value of 66.67%.
DISCUSSION
The results demonstrate that sudomotor evaluation through SUDOSCAN can help discriminate outpatients with dysesthesia of the lower extremities attributable to LS radiculopathy or PPNP. Although similar in clinical pain intensity, ESC values in the feet were significantly lower in patients diagnosed with PPNP, whereas the SUDOSCAN-risk score was higher in patients with LS ra- diculopathy or PPNP. The feet-ESC values at cut-off value of 48 mS, showed high specificity of 94.2% with 57.1% sen- sitivity to discriminate those with normal electrophysi- ologic findings and without PPNP. The sensitivity and specificity of the SUDOSCAN-risk score to detect abnor- mal electrophysiological findings (LS radiculopathy or PPNP) was 64.1% and 82.4%, respectively, at a 29% cut-off value. Overall, lower feet-ESC and higher SUDOSCAN- risk scores were found in those with PPNP, whereas high- er SUDOSCAN-risk scores and normal feet-ESC values
Table 3. ANCOVA analysis for the differences of ESC and SUDOSCAN risk score values in three groups Group A
(n=34) Group B
(n=18) Group C
(n=21) ANCOVA
(p-value) Feet-ESC average (mS) 66.79±12.57 65.61±10.2 45.61±21.80
a,b)0.002**
Feet-ESC asymmetry 3.97±3.83 5.06±5.84 9.64±10.13
a,b)0.019*
Hands-ESC average (mS) 62.44±15.95 60.67±12.35 47.19±19.74 0.175
Hands-ESC asymmetry 9.29±6.92 8.56±8.02 10.23±7.52 0.296
SUDOSCAN-risk score (%) 19.62±10.45 29.44±11.70
a)31.71±10.49
a)0.004**
Values are presented as mean±standard deviation.
The patients were classified to the normal (group A), lumbosacral radiculopathy (group B), or peripheral polyneurop- athy group (group C) according to nerve conduction study and electromyography examinations.
ESC, electrochemical skin conductance.
*p<0.05, **p<0.01.
a)