Introduction
Chronic obstructive pulmonary disease (COPD) is a com- plex and heterogeneous disease, characterized by chronic in- flammation in the airways by noxious particle such as tobacco smoking
1. Secondary systemic inflammation from airway is a key feature of COPD pathogenesis
2,3. Elevation of white blood cells (WBC) count, C-reactive protein (CRP), interleukin 6 (IL-6) and 8 (IL-8), and fibrinogen values in the peripheral blood have been reported in COPD patients
3-8. However, sys- temic inflammation is also observed in other diseases such as metabolic syndrome
9-13and may be a consequence of these frequently accompanying comorbidities. The aim of our study was to determine whether plasma WBC count can be used as a biomarker reflecting disease severity independent of these comorbidities in COPD patients. Since current guide- line assess COPD severity by pulmonary function testing and symptoms score, relationship between WBC count, lung
Systemic White Blood Cell Count as a Biomarker Associated with Severity of Chronic Obstructive Lung Disease
Hyeon-Kyoung Koo, M.D., Ph.D.
1, Hyung Koo Kang, M.D.
1, Pamela Song, M.D.
2, Hye Kyeong Park, M.D.
1, Sung-Soon Lee, M.D., Ph.D.
1and Hoon Jung, M.D., Ph.D.
11
Division of Pulmonary and Critical Care Medicine, Department of Internal Medicine and
2Department of Neurology, Inje University Ilsan Paik Hospital, Inje University College of Medicine, Goyang, Korea
Background: Chronic obstructive pulmonary disease (COPD), is a chronic inflammatory disorder. We evaluated whether white blood cell (WBC) count, is associated with the severity of COPD, independent of other inflammatory conditions, such as metabolic syndrome.
Methods: The WBC counts were compared between 1227 COPD patients and 8679 non-COPD adults older than 40.
The relationships between the WBC count, lung function, and symptoms score in COPD patients, were determined, using general linear regression analyses.
Results: The WBC count was negatively associated with forced vital capacity (FVC, L), FVC (% predicted), forced expiry volume in one second (FEV
1, L), and FEV
1(% predicted) in COPD patients. Additionally, the WBC count was independently associated with the quality of life measure, by EQ5D-index score. However, this relationship between WBC count, and disease severity, was not significant in current smokers, because of the confounding effect of smoking, on the WBC count.
Conclusion: The WBC count is associated with current smoking status and COPD severity, and a risk factor for poor lung function, and quality of life, especially in non-currently smoking COPD patients. The WBC count can be used, as an easily measurable COPD biomarker.
Keywords: Pulmonary Disease, Chronic Obstructive; Leukocyte Count; Respiratory Function Tests; Quality of Life
Address for correspondence: Hoon Jung, M.D., Ph.D.
Division of Pulmonary and Critical Care Medicine, Department of Internal Medicine, Inje University Ilsan Paik Hospital, Inje University College of Medicine, 170 Juhwa-ro, Ilsanseo-gu, Goyang 10380, Korea
Phone: 82-31-910-7924, Fax: 82-31-910-7219E-mail: [email protected]
*The abstract of this paper was presented at the Asian Pacific Society of Respirology 20th Congress, 2015 as a poster presentation with interim findings. The poster’s abstract was published in “Poster Abstracts” in Respirology, DOI: 10.1111/resp.12706.
Received: Sep. 8, 2016 Revised: Dec. 11, 2016 Accepted: Feb. 23, 2017
cc
It is identical to the Creative Commons Attribution Non-Commercial License (http://creativecommons.org/licenses/by-nc/4.0/).
Copyright © 2017
The Korean Academy of Tuberculosis and Respiratory Diseases.
All rights reserved.
function, and quality of life was compared by using data from Korean National Health and Nutrition Examination Survey (KNHANES).
Materials and Methods
1. Study design and participants
The KNHANES is a collection of nationally representative, cross-sectional, population-based health and nutritional sur- veys by the Korean Centers for Disease Control and Preven- tion since 1998. The participants were chosen by proportional allocation system sampling with multistage stratification, based on the geographical area, age, and sex. KNHANES in- cludes a health interview, physical examination, laboratory tests, and nutritional questionnaires. Pulmonary function tests (PFTs) were performed for subjects >40 years of age, and among them, COPD patients were selected according to the Global Initiative for Chronic Obstructive Lung Disease (GOLD) guideline
1. All individuals participated voluntarily and provided written informed consent. The KNHANES pro- tocol was approved by the Institutional Review Board of the Korean Centers for Disease Control and Prevention.
2. Measurement of variables
The PFTs were performed for subjects aged >40 years ac- cording to guidelines of the American Thoracic Society/Euro- pean Respiratory Society
14using a spirometry system (model 1022; SensorMedics, Yorba Linda, CA, USA). Spirometry was repeated at least three times to ensure reproducibility and va- lidity, and calculated based on the predictive equation for the Korean population
15. The current GOLD guideline classifies COPD patients not only by the degree of airflow limitation, but also by various symptom scores, such as the modified Medi- cal Research Council dyspnea scale or COPD assessment test (CAT) score
1. KNHANES included EuroQoL which is 5-item self-administered, scale-based, generic questionnaire (EQ- 5D) for quality of life (QoL) measurement in various chronic diseases such as COPD
16. Since good correlations between the EQ5D and St. George’s Respiratory Questionnaire (SGRQ) scores
17,18, and the SGRQ and CAT scores
19have already been reported, the symptom scores were replaced by the EQ-5D in this study. The EQ5D comprises a descriptive system and a vi- sual analog scale (VAS). The descriptive assessment includes five items: mobility, self-care, usual activities, pain/discomfort, and anxiety/depression. Each item can be used to represent profiles of health status or can be converted to a summary index (EQ5D-index). The VAS is a measurement scale ranging from 0 (worst health status) to 100 (best health status).
3. Definitions
COPD was defined as a pulmonary function test result of forced expiratory volume in 1 second (FEV
1, L)/forced vital capacity (FVC, L) <0.7 among adult >40 years of age accord- ing to the GOLD guidelines. The degree of airflow limitation was classified as GOLD 1 if FEV
1>80%, GOLD 2 if FEV
1>50%
to ≤80%, GOLD 3 if FEV
1>30% to ≤50%, and GOLD 4 if FEV
1≤30%
1. Body mass index (BMI) was calculated as kg/m
2. Hypertension was defined as blood pressure ≥140 mm Hg systolic or ≥90 mm Hg diastolic, or subjects who were already taking anti-hypertensive medication. Diabetes was defined as a fasting glucose level of ≥126 mg/dL or hemoglobin A1c of
≥6.5%, and/or diabetes treatment. Dyslipidemia was defined as an abnormal high-density lipoprotein level (<40 mg/dL in males and <50 mg/dL in females), a triglyceride level of >150 mg/dL, and/or hyperlipidemia treatment. The definition of central obesity followed the criteria for Asian individuals (waist circumference ≥90 cm for males and ≥80 cm for females)
20. 4. Statistical analysis
KNHANES was designed using a complex, stratified, mul- tistage probability-sampling model; thus, data were analyzed via the complex-sample design using stratification, sampling weight variables, and clustering variables to represent Korean population using SAS version 9.3 (SAS Institute Inc., Cary, NC, USA). In order to compare the characteristics of each sub- group, Student’s t tests or analyses of variance were used to compare continuous variables and chi-square tests were used to compare categorical variables. Associations between vari- ables were examined using Pearson’s correlation coefficient (r). To determine the association between lung function and WBC count in COPD patients, general linear regression was conducted with age, sex, height, BMI, current smoking status, hypertension, diabetes, and dyslipidemia as co-variables. With respect to the association between QoL and WBC count, ad- justment were made for age, sex, BMI, current smoking status, COPD severity, hypertension, diabetes, and dyslipidemia for multivariable analysis. A p-value of <0.05 was used to indicate statistical significance.
Results
1. Characteristics of the participants
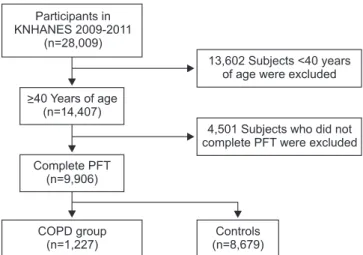
Data from a total of 9,906 adults >40 years of age were re- trieved from KNHANES. Among them, 1,227 patients met the definition of COPD (Figure 1). The prevalence of COPD was 12.4%, and among them, 44.8% were classified as GOLD 1, 50.2% as GOLD 2, 4.5% as GOLD 3, and 0.5% as GOLD 4.
The demographic and clinical characteristics of the COPD
and non-COPD groups are summarized in Table 1. Between the non-COPD and COPD groups, age, sex, height, BMI, and smoking status were significantly different, and the prevalence of hypertension, diabetes, and dyslipidemia was much higher in the COPD group; the values of cholesterol, WBC count, he- moglobin, platelet count, blood urea nitrogen, creatinine, QoL (both EQ5D-index and EQ5D-VAS), and pulmonary function were different between the groups.
2. WBC count and lung function
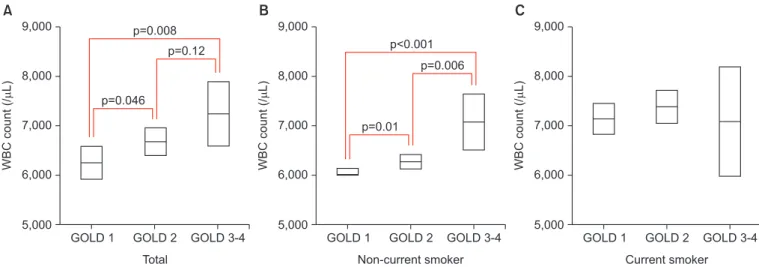
In COPD patients, the WBC count increased according to severity of airflow limitation (6,345±1,769 in GOLD 1, 6,584±1,844 in GOLD 2, 6,833±1,875 in GOLD 3–4; p=0.03) and was higher in current smokers than in non-current smok- ers (7,231±1,957 in current smoker vs. 6,136±1,631 in non- current smoker; p<0.001). The demographic and clinical characteristics of the COPD were compared according to quartiles of WBC count (Table 1). Quartile (Q) cutoff values were Q1 <5,200, Q2=5,200–6,250, Q3=6,250–7,470, and Q4
>7,470. Sex, waist circumference, smoking status, diabetes, hy- perlipidemia, and FVC (L) were significantly different among different quartiles of WBC counts. Proportion of male sex (p for trend <0.001), central obesity (p for trend <0.001), current smoker (p for trend <0.001), diabetes (p for trend <0.001), and hyperlipidemia (p for trend <0.001) increased according to dif- ferent quartiles of WBC counts. Values of FVC (% predicted) (p for trend=0.01) and FEV
1(% predicted) (p for trend=0.01) decreased according to increase of WBC quartiles. Multivari- able analysis for the relationship between degree of airflow limitation and WBC count were performed adjusted for age, sex, waist circumference, hypertension, diabetes, and dyslip- idemia. Both the degree of airflow limitation (β=0.10, p=0.002)
and current smoking status (β=0.28; p<0.001) were indepen- dently associated with the WBC count. Since there existed interaction between severity of airflow limitation and smoking status for WBC counts (p<0.001), we stratified study popula- tion based upon smoking status and reanalyzed the effect of degree of airflow limitation on WBC count. WBC counts were significantly different among each COPD stage only in non- current smoker group. WBC counts adjusted by age, sex, waist circumference, hypertension, diabetes, and dyslipidemia were compared according to the degree of airflow limitation and current smoking status in Figure 2.
The relation to WBC count with FEV
1(% predicted) (R=–
0.06, p=0.03) were statistically significant, but not with FVC (%
predicted) (p=0.06) in COPD patients. Multivariable analysis for the WBC count on lung function was performed after adjustment for age, sex, height, BMI, and current smoking status. The WBC count independently correlated with both decreased FVC (% predicted) and FEV
1(% predicted) (model 1 in Table 2). Even after additional co-variables (presence of hypertension, diabetes, and dyslipidemia) were included to the previous model, the associations between WBC count and lung function were still significant (model 2 in Table 2).
The proportions of patients with the different COPD stages were compared according to quartiles of the WBC count.
The associations between the proportions of COPD stage did not reach statistical significant differences according to the quartiles of the WBC count (p=0.07), but showed a tendency to worsen (p for trend=0.008). Progression of the COPD stage was apparent in the fourth quartile (p=0.01 in the post-hoc subgroup analysis) (Figure 3). After stratification by current smoking status, the proportion of COPD stage did not showed significant difference among different quartiles of WBC count (Supplementary Figures S1, S2).
3. WBC count and quality of Life
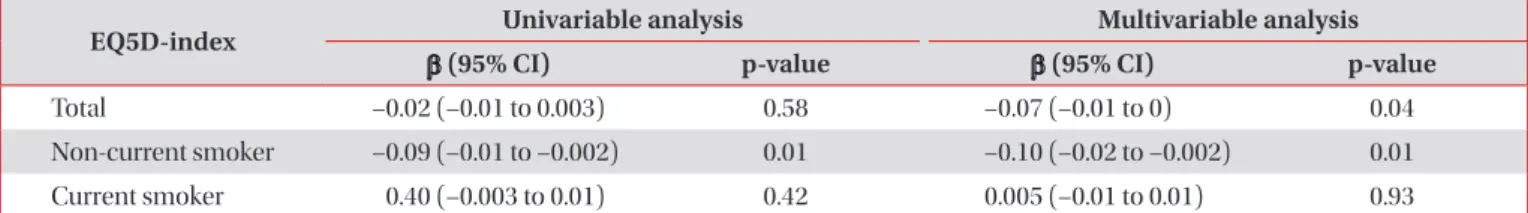
The relationships between the WBC count and the EQ5D- index or EQ5D-VAS were evaluated. WBC count was not statistically associated with EQ5D-index (p=0.58) or EQ5D- VAS score (p=0.55). Multivariable analysis of the relationship between WBC count and QOL was performed with adjusted for age, sex, BMI, current smoking status, and COPD severity.
The WBC count was independently associated with EQ5D- index (p=0.03), but not with EQ5D-VAS score (p=0.41). After further addition of co-variables such as hypertension, diabetes, and dyslipidemia to previous model, the association between WBC count and EQ5D-index was still significant (Table 3).
4. Subgroup analysis according to smoking status Since smoking status is one of the most important con- founders for COPD and since it was shown to have significant influence on the WBC counts in our study, we next stratified
Participants in KNHANES 2009-2011
(n=28,009)
>40 Years of age (n=14,407)
Complete PFT (n=9,906)
COPD group (n=1,227)
Controls (n=8,679)
13,602 Subjects <40 years of age were excluded
4,501 Subjects who did not complete PFT were excluded
Figure 1. Flow chart of the study population. KNHANES: Korean
National Health and Nutrition Examination Survey; PFT: pulmo-
nary function test; COPD: chronic obstructive pulmonary disease.
the study population according to smoking status. The WBC count correlated with FVC (% predicted) (R=–0.12, p<0.001) and FEV
1(% predicted) (R=–0.10, p=0.003) in the non-current smoker group. However, these correlations were not apparent in the current smoker group (p for FVC [% predicted]=0.56, p
for FEV
1[% predicted]=0.52). Multivariable analysis adjusted for age, sex, height, BMI, and current smoking status (model 1), and presence of hypertension, diabetes, and dyslipidemia in addition to model 1 (model 2) resulted in similar outcomes (Table 2). The association between the WBC counts with Table 1. Baseline characteristics of study population according to quartiles of WBC count
Characteristic Non-COPD
COPD p-value
Total COPD Q1 Q2 Q3 Q4 Non-COPD
vs. COPD
Between COPD
No. 8,679 1,227 307 306 307 307
Age, yr 55.6±10.5 64.7±9.8 64.9±9.6 64.9±9.7 64.4±9.6 63.5±10.0 <0.001 0.25
Male sex, % 40.1 73.4 62.8 72.8 79.2 83.0 <0.001 <0.001
Height, cm 160.5±8.7 163.3±8.7 161.9±8.9 163.1±8.8 164.3±8.2 164.7±8.3 <0.001 <0.001 Weight, kg 62.9±10.5 63.0±10.1 61.2±9.9 63.0±10.0 64.3±10.0 64.1±10.4 0.82 <0.001
BMI, kg/cm
224.3±3.0 23.5±2.8 23.3±2.7 23.6±2.8 23.8±2.8 23.6±2.9 <0.001 0.17
WC, cm 83.1±9.0 84.4±8.5 82.6±8.0 84.8±8.7 85.3±8.4 85.3±8.7 <0.001 <0.001
Smoking
Current smoke, % 17.6 32.2 16.6 27.8 35.6 51.1 <0.001 <0.001
Smoking amount, PY 10.8±17.5 24.2±23.3 19.0±23.5 19.2±40.6 26.6±23.2 29.4±22.8 <0.001 <0.001 Underlying disease
HTN 40.6 52.6 48.3 53.2 55.6 54.4 <0.001 0.27
DM 12.6 18.0 12.7 16.0 18.3 25.6 <0.001 <0.001
HL 39.8 43.9 45.2 59.2 58.3 63.2 0.001 <0.001
PFT
FVC, L 3.41±0.84 3.57±0.92 3.48±0.91 3.57±0.93 3.66±0.92 3.65±0.91 <0.001 0.045 FVC, % predict 92.5±11.7 90.1±14.1 91.6±13.3 90.3±15.0 89.7±13.9 88.6±14.2 <0.001 0.059 FEV
1, L 2.72±0.66 2.25±0.66 2.22±0.64 2.24±0.68 2.29±0.66 2.31±0.65 <0.001 0.213 FEV
1, % predict 94.3±12.0 77.3±15.4 79.0±14.7 77.1±16.9 76.4±15.2 75.8±14.5 <0.001 0.051 FEV
1/FVC, % 80.0±4.9 62.9±7.4 63.6±7.1 62.5±8.3 62.4±7.5 63.1±6.8 <0.001 0.177 Laboratory
WBC, /μL 5,966±1,660 6,492±1,817 4,574±539 5,761±281 6,792±344 8,925±1,503 <0.001 <0.001 Hb, g/dL 13.9±1.5 14.4±1.4 13.8±1.4 14.4±1.4 14.6±1.4 14.9±1.4 <0.001 <0.001 PLT (×10
3), /μL 252.9±59.0 243.6±59.9 224.3±53.0 239.1±57.1 245.2±54.2 267.3±66.3 <0.001 <0.001
BUN, mg/dL 15.0±4.2 15.9±5.4 16.0±6.8 15.7±4.5 16.0±4.9 16.0±4.9 <0.001 0.86
Cr, mg/dL 0.82±0.21 0.90±0.21 0.88±0.27 0.89±0.18 0.92±0.21 0.92±0.18 <0.001 0.01 Cholesterol, mg/dL 195.4±36.3 189.8±37.2 187.38±36.4 188.48±35.5 190.78±38.3 192.48±38.7 <0.001 0.32 Quality of life
EQ5D-index 0.93±0.12 0.92±0.14 0.92±0.13 0.92±0.15 0.92±0.12 0.92±0.15 <0.001 0.90
EQ5D-VAS 77.8±62.0 72.7±18.7 75.9±54.5 72.9±18.7 72.2±18.5 76.3±55.8 0.003 0.51
Values are presented as mean±standard deviation or frequency (%)
WBC: white blood cell; COPD: chronic obstructive pulmonary disease; BMI: body mass index; WC: waist circumference; PY: pack-year; HTN:
hypertension; DM: diabetes mellitus; HL: hyperlipidemia; PFT: pulmonary function test; FVC: forced vital capacity; FEV
1: forced expiratory volume in 1 second; Hb: hemoglobin; PLT: platelet; BUN: blood urea nitrogen; Cr: creatinine; EQ5D: Euro quality of life instrument; VAS:
visual analogue scale.
EQ5D-index was significant only in the non-current smoker group, but not in the current smoker group (Table 3).
Discussion
In this study, a higher WBC count was found to be indepen- dently associated with worse FVC (% predicted), and FEV
1(%
predicted), and quality of life in COPD patients. These associa- tions were more significant in the non-current smoker group than in the current smoker group. The elevation of the WBC count was independently associated with the COPD severity and current smoking status.
In previous studies, elevation of inflammatory markers, such as the WBC count, CRP, IL-6, and IL-8, had been reported in COPD patients
3-7. Singh et al.
7reported that sputum neutro- phils showed a weak association with FEV
1(% predicted) (r
2=0.025), but not with emphysema or future exacerbation,
using data of the Evaluation of COPD Longitudinally to Iden- tify Predictive Surrogate Endpoints (ECLIPSE) cohort. How- ever, acquiring a qualified sputum specimen is difficult, and it is necessary to identify reliable biomarker that can be easily measured in the peripheral blood
21. Agusti et al.
22compared the characteristics of a population with persistent systemic inflammation using the same ECLIPSE cohort. In this study, COPD patients had a higher WBC count than those of the controls, and groups with increased inflammatory markers showed more exacerbation and higher mortality rate than the groups without increased inflammatory markers. How- ever, the % predicted FEV
1and annual decline rate of FEV
1were not significantly different between the two groups
22. In another, smaller study by Fattouh and Alkady
23, the authors also reported increased exacerbation in the high WBC group, whereas no significant correlation between the % predicted FEV
1and WBC count was observed. Unlike the risk of exac- erbation, the correlation between the peripheral WBC count Table 2. Multivariable analysis for the influence of the white blood cell count on lung function in COPD patients
Model 1 Model 2
Total Non-current
smoker Current-smoker Total Non-current
smoker Current-smoker
β p-value β p-value β p-value β p-value β p-value β p-value
FVC, L –0.05 0.002 –0.08 <0.001 –0.02 0.62 –0.05 0.01 –0.08 0.001 –0.01 0.74
FVC, % –0.09 0.002 –0.12 <0.001 –0.03 0.56 –0.09 0.01 –0.13 0.001 –0.03 0.64
FEV
1, L –0.05 0.01 –0.08 0.02 –0.02 0.60 –0.06 0.01 –0.09 0.002 –0.03 0.51
FEV
1, % –0.08 0.01 –0.11 0.003 –0.03 0.52 –0.09 0.01 –0.12 0.002 –0.04 0.48
FEV
1/FVC, % –0.01 0.77 –0.02 0.60 –0.01 0.87 –0.03 0.33 –0.05 0.23 –0.03 0.63
Model 1: Adjusted by age, sex, height, body mass index, and current smoking status.
Model 2: Adjusted by age, sex, height, body mass index, current smoking status, hypertension, diabetes, and dyslipidemia.
COPD: chronic obstructive pulmonary disease; FVC: forced vital capacity; FEV
1: forced expiratory volume in 1 second.
9,000
8,000
7,000
6,000
5,000
GOLD 1
A
WBCcount(/L)
GOLD 2 GOLD 3-4 Total
9,000
8,000
7,000
6,000
5,000
GOLD 1
C
WBCcount(/L)
GOLD 2 GOLD 3-4 Current smoker 9,000
8,000
7,000
6,000
5,000
GOLD 1
B
WBCcount(/L)
GOLD 2 GOLD 3-4 Non-current smoker
p=0.01
p=0.006 p<0.001
p=0.046
p=0.12 p=0.008
Figure 2. The white blood cell (WBC) count according to the current smoking status and degree of airflow limitation. Values are presented as
mean±standard deviation.
and lung function has been reported to be mainly insignifi- cant.
Our study revealed that this insignificant correlation be- tween WBC count and lung function in previous reports were attributable to effect of smoking status. Values of WBC count are related to both lung function and QoL which determine COPD stage. Therefore, WBC count can be used as indicator for COPD severity, especially in non-current smoking COPD patients. The interaction between smoking status and COPD stage on WBC count might be result from effect of smoking on COPD.
Furthermore, COPD patients frequently have comorbidi- ties related to systemic inflammation including metabolic syndrome, and elevation of these biomarkers could be con- sequences of other coexisting disease
9, not by COPD itself.
To discriminate their confounding effects and clearly identify their relationship with COPD, we examined the correlations of the WBC count with the severity of COPD, adjusting for hypertension, diabetes, dyslipidemia, and other confounding factors in a sufficient number of patients.
Therefore, the WBC may represent a powerful biomarker for COPD patients, as it correlates to lung function and QoL, in addition to the risks of exacerbation and mortality.
Although this study identified independent relationships between the WBC count and COPD severity, the following limitations of the study should be noted when interpreting these results: first, we could not obtain data of other inflamma- tory markers, the diffusing capacity for carbon monoxide, em- physema index, or objective functional status measurements, such as the 6-minute walk distance. Second, we used the Eu- roQoL instead of the CAT score for measuring QoL, which is a generic questionnaire, although it has been reported to show a good correlation with the SGRQ score
17,18. Third, we did not evaluate post-bronchodilator FEV
1and FVC, which are com- monly used as lung function parameters in COPD patients, as this study was part of the national health survey. Fourth, differential leukocyte count or changes of WBC counts during follow-up or exacerbations could not be evaluated since this study was part of national survey. Fifth, WBC counts can be also influenced by infectious, rheumatologic, hematologic, or malignant diseases other than metabolic diseases. Though number of these population were small, our study could not exclude all these population, so WBC count could be influ- enced by these comorbidities. Fifth, number of advanced COPD patients included in our study were relatively small than that of COPD I–II patients, therefore caution is required in interpreting these results. Lastly, we could not completely differentiate COPD from asthma. Although KNHANES includes a self-reported questionnaire for asthma, many patients may not be able to differentiate these diseases accu- rately. Therefore, chronic smoking-related asthma or asthma- COPD overlap syndrome may have existed in our study popu- lation, and this relation could be different in this subgroups.
Further large trials evaluating the effect of the WBC count on the annual decline rate of lung function, functional capacity, and/or mortality are needed to confirm our findings.
In conclusion, elevation of the WBC count is independently associated with current smoking status and COPD severity. A high WBC count is a related to poorer lung function and lower quality of life in COPD patients, especially in non-current smokers. Based on our result, the WBC count could poten- tially be used as a powerful prognostic biomarker for COPD patients.
Table 3. Association between white blood cell count and quality of life in COPD patients
EQ5D-index Univariable analysis Multivariable analysis
β (95% CI) p-value β (95% CI) p-value
Total –0.02 (–0.01 to 0.003) 0.58 –0.07 (–0.01 to 0) 0.04
Non-current smoker –0.09 (–0.01 to –0.002) 0.01 –0.10 (–0.02 to –0.002) 0.01
Current smoker 0.40 (–0.003 to 0.01) 0.42 0.005 (–0.01 to 0.01) 0.93
Adjusted by age, sex, body mass index, current smoking status, chronic obstructive pulmonary disease (COPD) severity, diabetes, hypertension, and dyslipidemia.
CI: confidence interval.
1Q 100
50
0
2Q 3Q 4Q
Percentage
COPD 1 COPD 2 COPD 3-4