폐암의 호흡동조방사선치료 시 변형영상정합을 이용한 4차원 선량평가
서울아산병원 방사선종양학과 엄기천·유순미·윤인하·백금문
목 적 : 폐암의 호흡동조방사선치료(Respiratory Gated Radiotherapy, RGRT)계획수립 후 표적 주변에 위 치하고 있는 정상장기의 경우에는 움직임과 용적변화가 고려되지 않은 상태에서 선량평가가 이루어지는 경우 가 많다. 본 연구에서는 적응형방사선치료(Adaptive Radiotherapy, ART)에서 많이 사용되는 변형영상정합 (Deformable Image Registration, DIR)을 이용하여 호흡동조방사선치료 시 특정 위상에서의 정상장기의 움 직임을 반영한 4차원-선량평가를 진행하였으며, 3차원 선량평가와의 차이를 연구하였다. 또한, 폐암의 치료계 획평가 시 환자 호흡에 따른 정상장기의 움직임과 용적변화에 대한 분석 및 고려가 필요한 지 알아보고자 한다.
대상 및 방법 : 호흡동조방사선치료를 받은 폐암 환자 10명을 대상으로 하였다. Eclipse(Ver 13.6 Varian, USA)로 최고 위상 CT영상에 그려진 구조물을 모든 위상영상에 Propagation(EclipseTM)이나 Segmentation Wizard(EclipseTM)의 메뉴로 동일하게 설정하였으며, Center-to-Center 방식으로 구조물의 움직임 및 용적 을 분석하였다. 또한, 4차원 선량평가를 위해 VELOCITY 프로그램(VELOCITY Ver 4.0, Varian, USA)을 이용 하여 각 위상의 영상과 선량분포를 최고 위상 CT영상에 변형하였으며, 선량을 합산하여 정상장기의 4차원 선 량평가를 실시하고, 3차원 선량평가와 비교분석을 하였다. 또한, 4차원 선량분포의 검증을 위해 QUASARTM Phantom(Modus Medical Devices)과 GAFCHROMICTM EBT3 Film(Ashland, USA)을 사용하여 4차원 감 마분석을 시행하였다.
결 과 : 들숨과 날숨 구간의 움직임은 우측 폐가 축 방향 0.989±0.34 cm로 가장 컸으며, 척수가 측 방향 -0.001 cm로 가장 작았다. 30~70 % 구간의 움직임은 식도가 축 방향 0.52±0.21 cm로 가장 컸으며, 척수 가 전후방향 0.013±0.01 cm로 가장 작았다. 용적은 우측 폐가 33.5 %로 가장 큰 변화율을 보였다. 3차원 선 량평가와 4차원 선량평가에서의 PTV 선량균질지수(Conformity Index, CI) 값과 처방선량지수(Homogeneity Index, HI) 값의 차이는 각각 최대 0.076, 0.021, 최소 0.011, 0.0으로 평가되었다. 정상장기의 경우 4차원 선 량평가에서 0.0045~2.76 % 차이를 보였다. 모든 환자의 4차원 감마통과율은 평균 98.1±0.42 %로 확인되었 고, 모두 기준 95 %를 통과하였다.
결 론 : 모든 환자의 PTV 선량균질지수 값은 4차원 선량평가 시 더 유의한 값임을 확인할 수 있었으며, 처방 선량지수는 두 선량평가에서 차이를 보이지 않았다. 호흡에 의한 움직임이 고려된 4차원 선량분포에서 PTV 경계부분이 채워져 3차원 선량분포에서보다 선량이 더욱 균질한 것을 확인할 수 있었다. 정상장기의 4차원 선 량평가에서 0.004~2.76 % 차이가 있었으며, 척수를 제외한 모든 정상장기에서 두 평가방법의 차이유의를 확 인할 수 있었다. 정상장기의 3차원 선량평가 시 과소평가가 이루어 질 수 있다는 사실을 본 연구를 통해 알 수 있었으며, 호흡에 의한 정상장기의 선량변화가 예상되는 경우 변형영상정합을 이용한 4차원 선량평가를 고려 할 수 있을 것이다. 변형영상정합을 이용한 4차원 선량평가는 환자의 호흡에 의한 정상장기의 움직임과 용적 변화를 반영하는 조금 더 현실적인 선량평가방법이 될 것이라고 사료된다.
▶ 핵심용어 : Lung cancer, Respiratory Gated Radiotherapy, Deformable Image Registration, 4-Di- mensional Dose Evaluation
책임저자: 엄기천, 서울아산병원 서울 송파구 올림픽로43길 88 Tel: 02)3010-2707
E-mail: [email protected]
서 론
폐암의 방사선치료 시 호흡에 의한 표적의 움직임은 방 사선치료 효과를 좌우하는 큰 요인이 된다. 호흡에 의한 움 직임을 반영하기 위하여 여러 연구들이 진행되고 있으며, 선택적으로 사용되는 호흡동조방사선치료(Respiratory Gated Radiation Therapy, RGRT)는 표적의 내부여지 (Internal Margin, IM)를 줄이고, 정상장기의 불필요한 선 량을 최소화 시킬 수 있는 발전된 치료기술이다.(1,2)
호흡동조방사선치료는 표적이 설정위상 또는 설정주기 에 위치하였을 때 방사선이 조사되도록 하는 치료기술이 며, 4차원 컴퓨터단층촬영(4-Dimensional Computed Tomography, 4-DCT)으로 획득한 각 위상의 영상으로 표적의 움직임을 고려한 내부표적용적(Internal Target Volume, ITV)과 치료계획표적용적(Planning Target Volume, PTV)을 설정하여 치료계획의 수립 및 평가가 이 루어지게 된다.(3) 하지만, 표적 주변에 위치하고 있는 정상 장기의 경우에는 움직임 및 용적변화가 발생하여 선량차 이가 생길 수 있으며, 움직임 및 용적변화를 고려하지 않은 최고 위상 CT영상에 그려진 구조물로 선량평가를 하게 된 다. 특히, 폐의 선량이 중요하게 고려되는 폐암의 방사선치 료계획에서 호흡에 따른 폐의 움직임과 용적변화는 폐의 선량에 영향을 미칠 것이라고 판단하였다. 이에 본 연구에 서는 폐암의 호흡동조방사선치료 시 설정위상에서 폐를 포 함한 주변 정상장기의 움직임 및 용적변화가 반영된 4차원 선량평가를 하고 기존 3차원 선량평가와의 차이를 연구하 였다.
먼저, 최고 위상 CT영상(Top Phase CT image)에 수립 된 치료계획을 각각의 호흡동조위상 CT영상(30 %, 40 %, 50 %, 70 % Phase CT image)에 적용하여 정상장기의 선 량을 평가하였을 때 선량차이의 편차가 크다는 것을 확인 하였고, 모든 호흡동조위상이 종합적으로 반영된 4차원 선 량평가를 하고자 하였다. 이러한 4차원 선량평가를 위해서 적응형방사선치료(Adaptive Radiation Therapy, ART) 시 많이 사용되는 변형영상정합(DIR)을 이용하게 되었 다.(10) 또한, 각 위상영상에 정상장기의 구조물을 설정하여 정상장기의 움직임과 용적변화를 분석하고 선량변화와의 상관관계를 알아보고자 하였으며, 폐암의 호흡동조방사선
치료를 위한 치료계획수립 및 평가 시 표적 주변에 위치하 는 정상장기의 움직임 및 용적변화에 대한 고려가 필요할 것인지 알아보고자 하였다.(4,5)
대상 및 방법
1. Patient Selection and Contour Propagation (Eclipse
TM)
본원에서 폐암으로 호흡동조방사선치료를 받은 환자 10명을 대상으로 하였으며, 모든 환자는 역방향치료계획 인 세기조절방사선치료(Intensity Modulated Radiation Therapy, IMRT)계획이 수립되었다. 또한, 모든 환자의 호 흡주기 중 60 % 위상이 최고 위상이라고 평가되었다.
실제 환자의 표적과 정상장기의 구조물은 최고 위상 CT 영상에 그려졌으며, 총 종양용적(Gross Target Volume, GTV), 내부표적용적(Internal Target Volume, ITV), 치 료계획표적용적(Planning Target Volume, PTV)과 우 측 폐, 좌측 폐, 심장, 식도, 척수의 정상장기 용적이 그려 졌다. 다른 위상 CT영상의 구조물 설정을 위해 좌측 폐와 우측 폐는 Eclipse(Treatment Planning system Ver- sion 13.6, Varian, U.S.A)의 Contouring Segmentation Wizard(EclipseTM) 메뉴를 이용하였으며, 심장, 식도의 경 우에는 최고 위상 CT영상에 그려진 구조물로 Deform- able Propagate(EclipseTM)를 진행하였다. 예외적으로, 흉부지점의 척수의 움직임이 매우 작다는 연구결과를 토 대로 척수는 Rigid Propagate(EclipseTM)를 진행하였다.(6) 구조물을 직접 설정하지 않고 Contour Propagation으로 발생할 수 있는 오차 범위는 Contour Propagation의 정 확성을 검증한 연구결과를 바탕으로 충분히 대변할 수 있 다고 간주하였다.(7,8,9)
Propagation으로 얻어진 정상장기의 용적을 이용하여 흡기(0 % phase, Inhalation)와 호기(60 % phase, Top phase, Exhalation)사이의 움직임과 특정 위상(30~60
%, 60~70 %, 30~70 % interval motion)에서의 움직임 을 Center-to-Center로 분석하여 평균값과 표준편차를 구했으며, 각 구간의 용적변화도 같은 조건으로 분석하였 다.(11)
2. 4-D Dose Map using Deformable Image Registration
기존 최고 위상 CT영상에 수립된 치료계획을 실제 호흡 동조구간(30~70 %)의 각 위상영상에 적용하여 선량계산 을 하였다. 그 후, VELOCITY 프로그램(VELOCITY pro- gram Version 4.0, Varian Medical System, U.S.A)의 변 형영상접합(DIR) 기능을 이용하여 영상을 변형하였다.
VELOCITY 프로그램에서 제공하는 변형알고리즘으 로는 B-Spline이며, 해상력을 결정해주는 변화인자로는 Deformable방식과 Deformable Multi-pass방식이 대 표적이다.(12) Deformable방식은 한 단계의 영상정합이 끝 나면, 다음단계의 정합을 위해 사용자가 해상도를 설정해 야 하는 특징이 있다. 하지만, Deformable Multi-pass 방식의 경우에는 영상정합이 끝난 후 얻어진 영상으로 다 음단계의 영상정합에 사용할 수 있으며, 각각의 영상정 합마다 자동으로 해상도를 설정해주는 특징을 가지고 있 다. VELOCITY 프로그램 공급자는 임상적인 설정의 경
우 Deformable Multi-pass방식을 사용할 것을 권고하고 있으며, 본 연구에서는 권고와 같이 Deformable Multi- pass방식을 채택하여 영상변형을 시행하였다.(13,14)
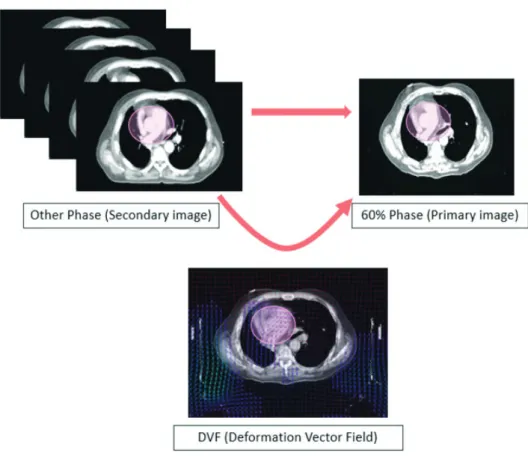
최고 위상 CT영상을 Primary(Fixed) Image로 설정 하였으며, 호흡동조구간의 각 위상영상(30 %, 40 %, 50
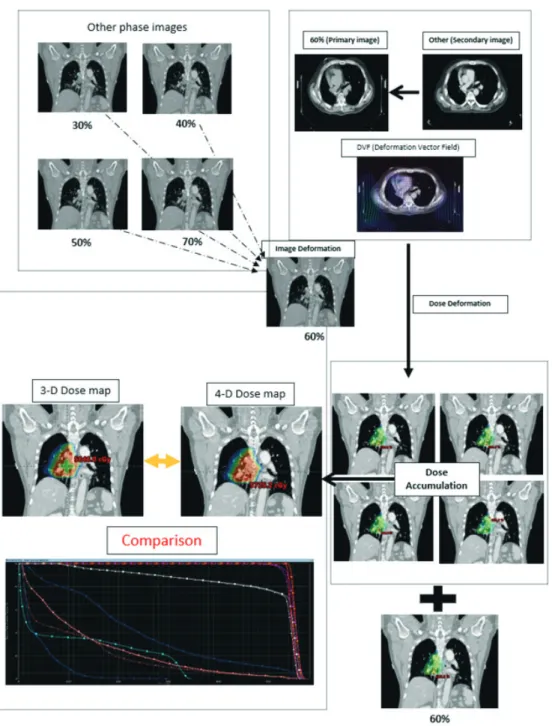
%, 70 % Phase Image)은 Secondary(Moved) Image 로 설정한 후 영상변형(Image Deformation)을 실시하였 다(Fig. 1). 또한, 영상변형과정에서 얻어낸 Deformation Vector Field(DVF)를 토대로 선량변형(Dose Deforma- tion)을 실시하였다. 호흡동조구간의 각 위상영상에 적용 된 치료계획의 선량분포(30, 40, 50, 70 % Phase dose map)들을 각각 Secondary로 설정하여 선량변형을 실시
하였다.(10,16,17) 그 후 변형된 선량분포들의 선량합산(Dose
Accumulation)을 실시하였다(Fig. 2). 이것은 각 위상의 선량분포를 최고 위상 CT영상에 단일화시킨 것이며, 본 연구에서는 호흡동조위상이 고려된 4차원 선량분포라고 정의하였다. 또한, 합산된 4차원 선량분포를 최고 위상 CT
Fig. 1. Deformable Image Registration and Deformation Vector Field
영상에 불러와 기존 3차원 선량분포와 비교분석하였다.
3. 4-D Dose Evaluation
표적의 선량평가를 위하여 국제방사선단위측정위원회 (International Commission on Radiation Units and Measurements, ICRU) 보고서 62를 기준으로 3차원 선량분포와 4차원 선량분포에서의 PTV 선량균질지수
(Conformity Index, CI)[식 1]와 처방선량지수(Homo- geneity Index, HI)[식 2]를 각각 구하여 비교분석하였다.
CI = VTV
[식1]
VPTV
VTV : 처방선량이 포함하는 용적(cm3) VPTV : PTV의 용적(cm3)
Fig. 2. Procedure of 4D Dose Accumulation
HI = D5 %
[식2]
D95 %
D5 % : PTV의 5 % 용적이 받는 선량(Gy) D95 % : PTV의 95 % 용적이 받는 선량(Gy)
또한, 정상장기의 평가를 위해 각 위상의 선량분포를 합 산시킨 4차원 선량분포의 선량체적용적(Dose Volume Histogram, DVH)과 기존 최고 위상 CT영상의 3차원 선 량분포 선량체적용적을 비교분석하였다. 정상장기의 평 가대상으로는 양쪽 폐, 심장, 식도, 척수를 선정하였다. 양 쪽 폐는 평균 폐 선량(Mean Lung Dose, MLD)과 각각의 V5Gy, V10Gy, V20Gy를 평가하였으며, 심장은 평균 심장 선량
(Mean Heart Dose, MHD)과 Dmax, V30 Gy를 평가하였다.
또한 식도와 척수는 Dmax를 측정하여 평가하였다.
두 선량평가의 차이유의를 확인하기 위해 t-검정을 실시 하여 p-value를 구했으며, 유의수준은 0.05로 설정하였다.
4. 감마통과율(Gamma pass rate)
4차원 선량분포의 정확성을 검증하기 위해 4차원 감마 통과율을 분석하였다. 평가를 위해 QUASARTM Respira- tory Motion Phantom(Modus Medical Devices Inc.)과 GAFCHROMICTM EBT3 Film(Ashland ISP Advanced Materials, NJ, USA)을 이용하였으며(Fig. 5), Film Scanner(EPSON Expression 10000-LX, Japan)를 이용
A. Mean Lung Dose B. Lung V5 Gy C. Lung V10 Gy
D. Lung V20 Gy E. Mean Heart Dose F. Heart Dmax
G. Heart V30 Gy H. Esophagus Dmax I. Spinal cord Dmax
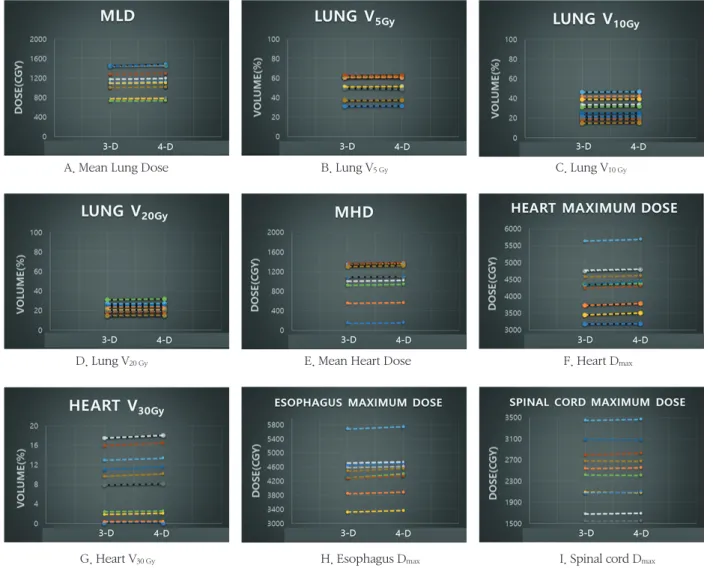
Fig. 3. Comparison of 3D parameters and 4D parameters
(A. Mean Lund Dose, B. Lung V5 Gy, C. Lung V10 Gy, D. Lung V20 Gy, E. Mean Heart Dose F. Heart Dmax , G. Heart V30 Gy, H. Esophagus Dmax, I.
Spinal cord Dmax)
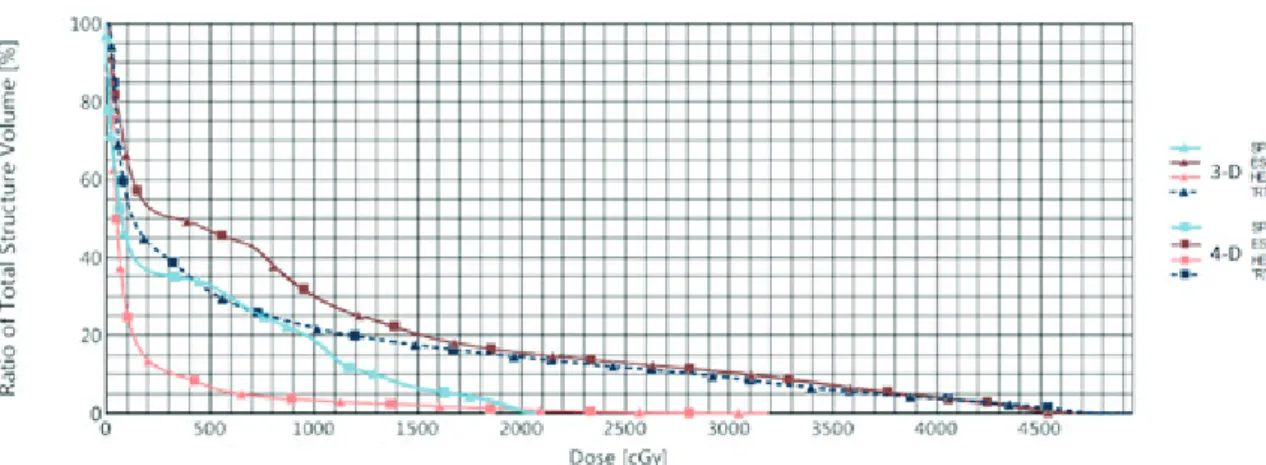
Fig. 4. Comparison DVH of 3D Dose and 4D Dose Accumulation
A. CT Simulator for Phantom Study Lightspeed RT16 CT simulator(General Electric Co, USA)
B. LINAC for Phantom Study VitalBeam(Varian, USA)
C. QUASARTM Respiratory Motion Phantom(Modus Medical Devices Inc.)
D. GAFCHROMICTM EBT3 Film(Ashland ISP Advanced Mate- rials, NJ, USA)
Fig. 5. A. CT simulator for phantom study, Litghtspeed RT 16 CT-Simulator(General electric Co, USA) B. LINAC for phantom stutdy, VitalBeam(Varian, USA)
C. QUASARTM Respiratory Motion Phantom(Modus Medical Devices Inc.), D. GAFCHROMICTM EBT3 Film (Ashland ISP Advanced Materials, NJ, USA)
Table 1. Motion Measurement of Specific Phase and Direction (Unit in ratio : cm)
Rt lung Lt lung Heart Esophagus Spinal cord
0~60 %
S-I 0.989±0.34 0.809±0.34 0.694±0.23 0.676±0.42 -0.006±0.02
A-P -0.018±0.14 0.148±0.14 0.151±0.1 0.101±0.08 0.002
L-R 0.034±0.09 -0.003±0.09 -0.018±0.45 0.04±0.07 0.001
30~60 %
S-I 0.265±0.1 0.125±0.11 0.203±0.08 0.274±0.24 -0.003±0.05
A-P 0.023±0.11 0.083±0.08 0.061±0.05 0.006±0.07 0.002±0.01
L-R 0.024±0.05 0.002±0.02 0.033±0.07 -0.007±0.05 -0.001
60~70 %
S-I -0.076±0.22 -0.006±0.14 -0.049±0.12 -0.109±0.28 0.003±0.05
A-P 0.015±0.02 0.040±0.04 0.0±0.05 -0.019±0.08 -0.002±0.01
L-R -0.017±0.04 -0.008±0.01 0.0±0.08 -0.002±0.05 0.001
30~70 % interval motion
S-I 0.468±0.13 0.256±0.09 0.29±0.09 0.521±0.21 0.060±0.04
A-P 0.094±0.06 0.131±0.06 0.096±0.04 0.121±0.05 0.013±0.01
L-R 0.039±0.04 0.027±0.01 0.093±0.05 0.068±0.03 0.007
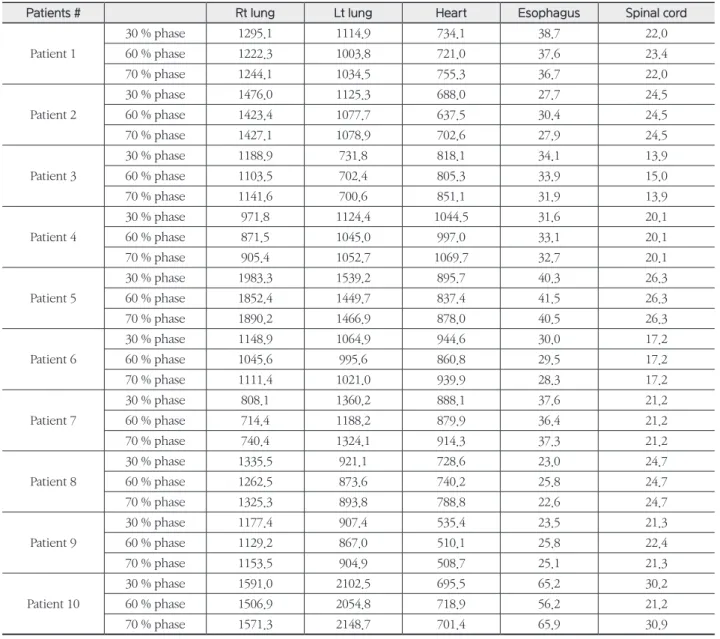
Table 2. Volume Measurement of Specific Phase (Unit in ratio : cm3)
Patients # Rt lung Lt lung Heart Esophagus Spinal cord
Patient 1
30 % phase 1295.1 1114.9 734.1 38.7 22.0
60 % phase 1222.3 1003.8 721.0 37.6 23.4
70 % phase 1244.1 1034.5 755.3 36.7 22.0
Patient 2
30 % phase 1476.0 1125.3 688.0 27.7 24.5
60 % phase 1423.4 1077.7 637.5 30.4 24.5
70 % phase 1427.1 1078.9 702.6 27.9 24.5
Patient 3
30 % phase 1188.9 731.8 818.1 34.1 13.9
60 % phase 1103.5 702.4 805.3 33.9 15.0
70 % phase 1141.6 700.6 851.1 31.9 13.9
Patient 4
30 % phase 971.8 1124.4 1044.5 31.6 20.1
60 % phase 871.5 1045.0 997.0 33.1 20.1
70 % phase 905.4 1052.7 1069.7 32.7 20.1
Patient 5
30 % phase 1983.3 1539.2 895.7 40.3 26.3
60 % phase 1852.4 1449.7 837.4 41.5 26.3
70 % phase 1890.2 1466.9 878.0 40.5 26.3
Patient 6
30 % phase 1148.9 1064.9 944.6 30.0 17.2
60 % phase 1045.6 995.6 860.8 29.5 17.2
70 % phase 1111.4 1021.0 939.9 28.3 17.2
Patient 7
30 % phase 808.1 1360.2 888.1 37.6 21.2
60 % phase 714.4 1188.2 879.9 36.4 21.2
70 % phase 740.4 1324.1 914.3 37.3 21.2
Patient 8
30 % phase 1335.5 921.1 728.6 23.0 24.7
60 % phase 1262.5 873.6 740.2 25.8 24.7
70 % phase 1325.3 893.8 788.8 22.6 24.7
Patient 9
30 % phase 1177.4 907.4 535.4 23.5 21.3
60 % phase 1129.2 867.0 510.1 25.8 22.4
70 % phase 1153.5 904.9 508.7 25.1 21.3
Patient 10
30 % phase 1591.0 2102.5 695.5 65.2 30.2
60 % phase 1506.9 2054.8 718.9 56.2 21.2
70 % phase 1571.3 2148.7 701.4 65.9 30.9
하여 필름을 분석하였다. 팬텀의 최고 위상 CT영상에 모 든 환자의 4차원 선량분포를 팬텀영상에 적용하여 선량계 산을 하였고, 실제 환자의 호흡을 팬텀에 입력한 후 실제 치료의 호흡위상(30~70 %)에서 방사선을 조사하였으며, 3 mm/3 %, 감마통과율 95 % 기준으로 평가하였다.
결 과
1. 움직임 평가 및 용적변화(Motion and Volume)
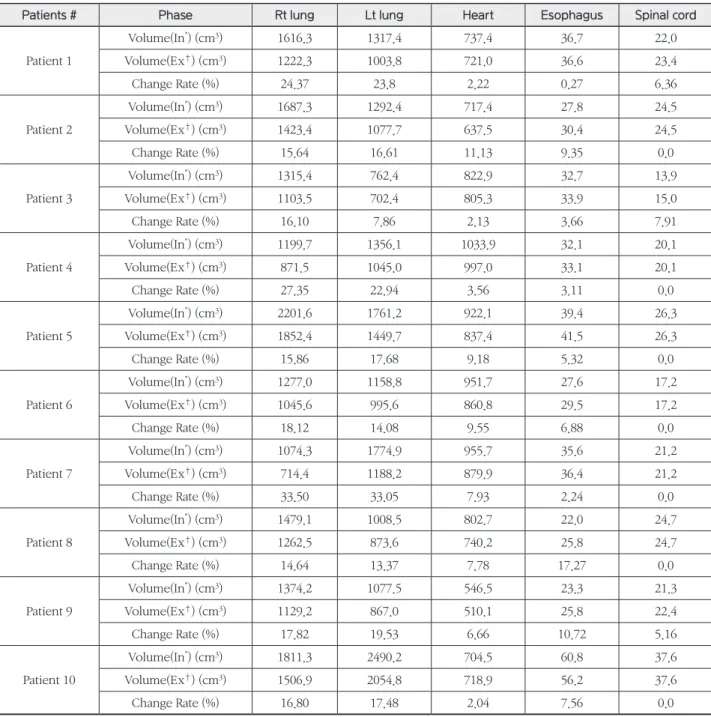
들숨구간인 0 % 위상과 날숨구간인 60 % 위상에서 각각의 정상장기의 평균움직임 측정결과 축(Superior- Inferior, S-I) 방향의 최솟값은 척수 -0.006±0.002 cm, 최댓값은 우측 폐 0.989±0.34 cm으로 측정되었으며, 전후Table 3. Volume Measurement of Inhalation and Exhalation Phase
Patients # Phase Rt lung Lt lung Heart Esophagus Spinal cord
Patient 1
Volume(In*) (cm3) 1616.3 1317.4 737.4 36.7 22.0
Volume(Ex†) (cm3) 1222.3 1003.8 721.0 36.6 23.4
Change Rate (%) 24.37 23.8 2.22 0.27 6.36
Patient 2
Volume(In*) (cm3) 1687.3 1292.4 717.4 27.8 24.5
Volume(Ex†) (cm3) 1423.4 1077.7 637.5 30.4 24.5
Change Rate (%) 15.64 16.61 11.13 9.35 0.0
Patient 3
Volume(In*) (cm3) 1315.4 762.4 822.9 32.7 13.9
Volume(Ex†) (cm3) 1103.5 702.4 805.3 33.9 15.0
Change Rate (%) 16.10 7.86 2.13 3.66 7.91
Patient 4
Volume(In*) (cm3) 1199.7 1356.1 1033.9 32.1 20.1
Volume(Ex†) (cm3) 871.5 1045.0 997.0 33.1 20.1
Change Rate (%) 27.35 22.94 3.56 3.11 0.0
Patient 5
Volume(In*) (cm3) 2201.6 1761.2 922.1 39.4 26.3
Volume(Ex†) (cm3) 1852.4 1449.7 837.4 41.5 26.3
Change Rate (%) 15.86 17.68 9.18 5.32 0.0
Patient 6
Volume(In*) (cm3) 1277.0 1158.8 951.7 27.6 17.2
Volume(Ex†) (cm3) 1045.6 995.6 860.8 29.5 17.2
Change Rate (%) 18.12 14.08 9.55 6.88 0.0
Patient 7
Volume(In*) (cm3) 1074.3 1774.9 955.7 35.6 21.2
Volume(Ex†) (cm3) 714.4 1188.2 879.9 36.4 21.2
Change Rate (%) 33.50 33.05 7.93 2.24 0.0
Patient 8
Volume(In*) (cm3) 1479.1 1008.5 802.7 22.0 24.7
Volume(Ex†) (cm3) 1262.5 873.6 740.2 25.8 24.7
Change Rate (%) 14.64 13.37 7.78 17.27 0.0
Patient 9
Volume(In*) (cm3) 1374.2 1077.5 546.5 23.3 21.3
Volume(Ex†) (cm3) 1129.2 867.0 510.1 25.8 22.4
Change Rate (%) 17.82 19.53 6.66 10.72 5.16
Patient 10
Volume(In*) (cm3) 1811.3 2490.2 704.5 60.8 37.6
Volume(Ex†) (cm3) 1506.9 2054.8 718.9 56.2 37.6
Change Rate (%) 16.80 17.48 2.04 7.56 0.0
*Inhalation Volume, †Exhalation Volume
(Anterior-Posterior, A-P) 방향의 최솟값은 척수 0.002 cm, 최댓값은 심장 0.151±0.1 cm로 측정되었다. 또한, 측 (Left-Right, L-R) 방향의 최솟값은 척수 0.001 cm, 최댓 값은 식도 0.04±0.07 cm로 측정되었다. 모든 정상장기의 축 방향, 전후방향, 측방향의 평균값은 각각 0.632±0.378 cm, 0.077±0.08 cm, 0.14±0.03 cm로 측정되었다.
실제 방사선조사 구간인 30~70 % 위상에서 정상장기의 평균 움직임 측정결과 축 방향의 최솟값은 척수 0.06±0.04 cm, 최댓값은 식도 0.52±0.21 cm로 측정되었으며, 전후 방향의 최솟값은 척수 0.013±0.01 cm, 최댓값은 좌측 폐 0.131±0.06 cm로 측정되었다. 또한, 측 방향의 최솟값은 척수 0.007 cm, 최댓값은 심장 0.093±0.05 cm로 측정되 었다. 모든 정상장기의 축 방향, 전후방향, 측방향의 평균값 은 각각 0.319±0.18 cm, 0.091±0.04 cm, 0.046±0.03 cm 로 측정되었다(Table 1).
들숨 구간인 0 % 위상과 날숨 구간인 60 % 위상의 용적 변화 분석결과 좌측 폐가 평균 24.35 % 차이로 가장 큰 변 화율을 보였으며, 척수가 평균 1.54 % 차이로 가장 작은 변화율을 보였다. 또한, 실제 방사선조사 구간인 30~70 % 위상에서는 우측 폐가 평균 3.72 % 차이로 가장 큰 변화 율을 보였으며, 척수가 평균 0.31 %의 차이로 가장 작은 변 화율을 보였다(Table 2).
2. 선량균질지수 및 처방선량지수 비교(Comparison of CI, HI)
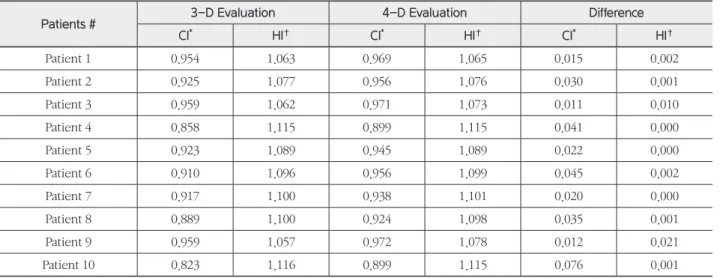
전산화치료계획에서 3차원 선량분포와 4차원 선량분포 의 PTV 선량균질지수 값과 처방선량지수 값의 최대차이 는 각각 0.076, 0.021이였다. 환자3의 선량균질지수 값의 차이가 0.011로 가장 작았으며, 환자4, 5, 7의 처방선량지 수 값의 차이는 0에 가까워 차이가 거의 없었다. 두 가지의 선량평가에서의 선량균질지수 값의 차이의 평균은 0.031±
0.02이였으며, 처방선량지수 값의 차이의 평균은 0.004였 다(Table 4).
3. 정상장기의 선량비교(Comparison of Normal Organ Dose)
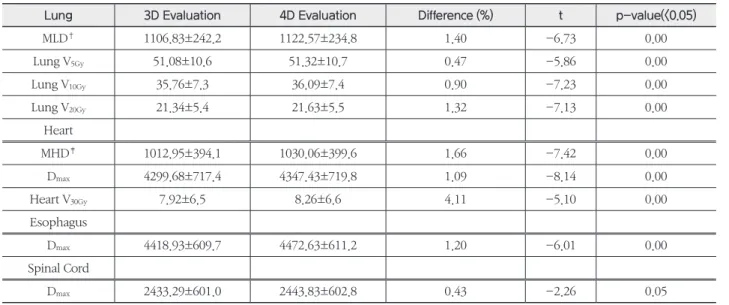
전산화치료계획에서 3차원 선량평가와 4차원 선량평가 의 비교결과 양쪽 폐의 MLD, V5Gy, V10Gy, V20Gy의 평가지 표에서 각각 최대 2.319, 0.803, 0.646, 0.533 %, 최소 0.0
%, 0.082, 0.137, 0.137 %의 차이가 발생하였으며, 각 지표 차이의 평균은 1.4, 0.47, 0.9, 1.32 %로 확인되었다. 심장의 MHD, Dmax, V30Gy의 평가지표에서는 각각 최대 1.62, 1.11, 0.34 %, 최소 0.994, 0.505, 0.005 %의 차이가 발생하였으 며, 각 지표 차이의 평균은 1.66, 1.09, 4.11 %로 확인되었 다. 또한, 식도와 척수의 Dmax는 각각 최대 2.697, 1.643 %, 최소 0.486, 0.043 %가 발생하였으며, 지표의 평균차이는 각각 1.2, 0.43 %로 확인되었다(Fig. 4, 5).
Table 4. Comparison of CI and HI
Patients # 3-D Evaluation 4-D Evaluation Difference
CI* HI† CI* HI† CI* HI†
Patient 1 0.954 1.063 0.969 1.065 0.015 0.002
Patient 2 0.925 1.077 0.956 1.076 0.030 0.001
Patient 3 0.959 1.062 0.971 1.073 0.011 0.010
Patient 4 0.858 1.115 0.899 1.115 0.041 0.000
Patient 5 0.923 1.089 0.945 1.089 0.022 0.000
Patient 6 0.910 1.096 0.956 1.099 0.045 0.002
Patient 7 0.917 1.100 0.938 1.101 0.020 0.000
Patient 8 0.889 1.100 0.924 1.098 0.035 0.001
Patient 9 0.959 1.057 0.972 1.078 0.012 0.021
Patient 10 0.823 1.116 0.899 1.115 0.076 0.001
*Conformity Index(CI), †Homogeneity Index(HI)
척수의 Dmax를 제외한 모든 평가지표에서 p-value는 0.05 이하로 통계적으로 유의한 차이를 확인하였다(Table 5).
4. 감마통과율(Gamma pass rate)
모든 환자의 감마통과율은 평균 98.1±0.42 %로 확인되 었고, 모두 기준 95 %를 통과하였다(Table 6).
결 론
본 연구에서는 폐암의 방사선치료 시 표적의 움직임이 발생하는 동시에 표적주변 정상장기에서도 움직임 및 용적 변화가 발생하여 선량차이가 생길 수 있을 것이라고 판단 하였다.
모든 위상에 정상장기의 구조물을 설정하여 정상장기의 움직임과 용적변화에 대한 평가가 이루어졌으며, 선량변화 의 상관관계에 대한 분석이 함께 이루어졌다.
최고 위상 CT영상(Top Phase CT image)에 수립된 치 료계획을 각각의 호흡동조위상 CT영상(30 %, 40 %, 50
%, 70 % Phase CT image)에 적용하여 정상장기의 선량 평가를 하였을 때 선량차이의 편차가 크다는 것을 확인하 였고, 모든 호흡동조위상이 종합된 4차원 선량평가를 하고 자 하였으며, 변형영상정합(DIR)을 이용하였다.(10)
정상장기의 움직임 및 용적변화 분석결과 전체 호흡주기 에서 모든 환자의 모든 정상장기는 축 방향으로 움직임이 가장 컸으며, 최댓값은 우측폐로 1.73 cm이였고, 우측폐의 평균움직임은 0.989±0.34 cm이였다. 최솟값은 척수가 0 cm으로 움직임이 거의 없다는 것을 확인할 수 있었다. 호 흡동조구간에서의 정상장기의 용적의 경우 10명 중 6명의 환자는 우측 폐의 변화율이 가장 컸으며, 나머지 4명은 좌 측 폐의 변화율이 가장 컸다. 10명 중 7명의 환자는 척수의 변화율이 0.001 %에 가까워 용적변화가 거의 없다는 것을 알 수 있었다.
모든 환자의 선량균질지수 값은 4차원 선량평가 시 1.0 에 가까워 더 유의한 값임을 확인할 수 있었으며, 처방선량 지수는 두 선량평가에서 차이를 보이지 않았다. 호흡에 의 한 움직임이 고려된 4차원 선량분포에서 PTV 경계부분이 Table 5. Comparison of 3-D Dose Average(SD*) and 4-D Dose Average(SD) (n=10)
Lung 3D Evaluation 4D Evaluation Difference (%) t p-value(<0.05)
MLD† 1106.83±242.2 1122.57±234.8 1.40 -6.73 0.00
Lung V5Gy 51.08±10.6 51.32±10.7 0.47 -5.86 0.00
Lung V10Gy 35.76±7.3 36.09±7.4 0.90 -7.23 0.00
Lung V20Gy 21.34±5.4 21.63±5.5 1.32 -7.13 0.00
Heart
MHD‡ 1012.95±394.1 1030.06±399.6 1.66 -7.42 0.00
Dmax 4299.68±717.4 4347.43±719.8 1.09 -8.14 0.00
Heart V30Gy 7.92±6.5 8.26±6.6 4.11 -5.10 0.00
Esophagus
Dmax 4418.93±609.7 4472.63±611.2 1.20 -6.01 0.00
Spinal Cord
Dmax 2433.29±601.0 2443.83±602.8 0.43 -2.26 0.05
*Standard Deviation, †Mean Lung Dose, ‡Mean Heart Dose
Table 6. 4-D Gamma Pass Rate (Unit in ratio : %) Patients # Gamma Pass
Rate Patients # Gamma Pass Rate
Patient 1 99.8 Patient 6 99.2
Patient 2 99.5 Patient 7 96.4
Patient 3 96.3 Patient 8 96.5
Patient 4 99.3 Patient 9 97.7
Patient 5 97.2 Patient 10 99.2
채워져 3차원 선량분포에서보다 선량이 더욱 균질한 것을 확인할 수 있었다.
정상장기는 호흡동조구간의 선량합산을 기반으로 4차 원 선량평가가 이루어졌을 때, 0.004~2.76 % 차이가 발생 하였으며, 척수를 제외한 모든 정상장기에서 두 평가방법 의 차이유의를 확인할 수 있었다. 폐암환자의 치료계획 평 가 시 정상장기의 과소평가가 이루어 질 수 있다는 사실을 본 연구를 통해 알 수 있었으며, 치료계획 평가 시 호흡에 의한 선량변화가 예상되는 경우 변형영상정합(DIR)을 이 용한 4차원 선량평가를 고려할 수 있을 것이다. 변형영상정 합(DIR)을 이용한 4차원 선량평가는 환자의 호흡에 의한 정상장기의 움직임과 용적변화를 반영하는 조금 더 현실적 인 선량평가방법이 될 것이라고 사료된다.
고 찰
정상장기의 움직임 방향, 거리, 용적변화 정도에 따른 선 량변화는 비례적으로 발생하지 않았기 때문에 정상장기의 움직임과 용적변화에 따른 선량변화의 상관관계는 알 수 없었다. 호흡동조구간에서 척수의 움직임은 축 방향으로 평균 0.06±0.04 cm으로 움직임이 거의 없다는 것을 확인 할 수 있었지만, 선량평가지표인 Dmax에서는 최대 1.61 % 의 차이가 발생한 것을 확인할 수 있었다. 이는, 호흡에 의 한 SSD 변화, 장기배열의 변화, 사용 에너지의 특성, 치료 중 오차(Intra-fraction error) 등의 많은 변수가 존재하기 때문이다.(18) 향후 환자의 병기와 상태, 표적의 위치와 크기, 정상장기의 움직임과 용적변화 등에 따른 세분화를 통해 선량변화의 상관관계에 대한 추가적인 연구가 이루어져야 방사선치료에 의한 정상장기의 부작용 확률에 조금 더 유 익한 정보를 제공할 수 있을 것이라고 사료된다.
참고문헌
1. Ross I Berbeco, Seiko Nishioka, Hiroki Shirato, George T Y Chen and Steve B Jiang : Residual mo- tion of lung tumors in gated radiotherapy with
external respiratory surrogates. Phys. Med. Biol 50 2005:3655-3667
2. A. Sam Beddar, et al : Correlation between internal fiducial tumor motion and external marker motion for live tumors im-gated with 4D-CT. International Journal of Radiation Oncology and Biology and Physics 2008(67):630-638
3. Joep C. Stroom, Ben J.M. Heijmen : Geometrical uncertainties, radiotherapy planning margins, and the ICRU-62 report. Radiotherapy and Oncology 64 2002:75-83
4. Seong-Hee Kang et al : Impact on Four-dimen- sional Dose Accumulation Using Deformable Image registration in Liver Stereotactic Body Radiotherapy.
The Korean Association for Radiation Protection 2014:196-197
5. Elke Rietzel, Ph.D, George T.Y. Chen, PhD, Noah C. Choi, M.D, Christopher G. Willet. M.D : Four- dimensional image-based treatment planning : target volume segmentation and dose calculation in the presence of respiratory motion. Int. J .Radiation Oncology Biol. Phys. 2005(16):1535-1550
6. Jing Cai, Ke Sheng, jason P. Sheehan, Stanley H.
Benedict, James M. Larner, Paul. Read : Evaluation of thoracic spinal cord motion using dynamic MRI.
Radiotherapy and Oncology. 2007:279-282
7. Nicholas Hardcastle, Wouter van Elmpt, Dirk De Ruysscher, Karl Bzdusek and Wolfgang A tome : Ac- curacy of deformable image registration for contour propagation in adaptive lung radiotherapy. Hard- castle et al. Radiation Oncology. 2013:8:243
8. S.Senan, R. Muirhead, J. R. van Sornsen de Koste : Contour Propagtion on Thoracic 4-dimensional CT Scancs in Locally-advanced Lung Cancer using Deformable Registration. I. J. Radiation Oncology.
2009(75); S466
9. Sara Thornqvist., Jorgen B. B. Petersen, Morten Hoy- er, Lise N. Bentzen & Ludvig Paul Muren : Propaga- tion of target and organ at risk contours in radio- therapy of prostate cancer using deformable image registration. Acta Oncologica. 2010;49(7):1023-1032
10. Lian Zhang, Zhi Wang, Chengyu Shi, Tengfei Long, X. George Xu : The impact of robustness of de- formable image registration on contour propagation and dose accumulation for head and neck adaptive radio therapy. Journal of applied clinical medical physics. 2018;185-194
11. K. M. Langem, Ph.D., D. T. L. Jones, PhD. : Organ motion and its management. Int.J.Radiation Oncol- ogy Biol Phys. 2001;50(1):265-278
12. Noriyuki Kadoya et al : Evaluation of vari- ous deformable image registration algorithms for thoracic images. Journal of Radiation Research.
2014;55(1):175-182
13. Seungjong Oh,Phd, Siyoung Kim,Phd : Deformable image registration in radiation therapy. Radiat Oncol J 2017;35(2):101-111
14. Hill DL, Batchelor PG, Holden M, Hawkes DJ : Medical image registration. Phys Med Biol 2001;46- R1-45
15. Ke Nie, Jean Pouliot, Eric Smith, and Cynthia Ch- uang : Performance variations among clinically available deformable image registration tools in adaptive radiotherapy - how should we evaluate and interpret the result?. Journal of applied clinical medical physics. 2016;17(2):328-340
16. U.J.Yeo, M. L. Taylor, J.R. Supple, L.Dunn, T..Kron, R.D.Franich : Is it sensible to “deform” dose ? 3D experimental validation of dose-warping. Medical Physics. 2012;39:5065-5072
17. Hardcastle, N.; Bender, E.T.: Tome, W.A.: The effect on dose accumulation accuracy of inverse-con- sistency and transitivity error reduced deformation maps. Australas. Phys. Eng. Sci. Med. 2014;37:321- 326
18. Eric E. Klein, Robert E. Drzymala, James A. Purdy, and Jeff Michalski : Errors in radiation oncology : A study in pathways and dosimetric impact. Journal of applied clinical medical physics 2005;6:81-94
4-Dimensional dose evaluation using deformable image registration in respiratory gated radiotherapy
for lung cancer
Department of Radiation Oncology, Seoul Asan Medical Center
Um Ki Cheon, Yoo Soon Mi, Yoon In Ha, Back Geum Mun
Purpose : After planning the Respiratory Gated Radiotherapy for Lung cancer, the movement and volume change of sparing normal structures nearby target are not often considered during dose evaluation. This study carried out 4-D dose evaluation which reflects the movement of normal structures at certain phase of Respiratory Gated Radiotherapy, by using Deformable Image Registration that is well used for Adaptive Radiotherapy. Moreover, the study discussed the need of analysis and established some recommendations, regarding the normal structures’s movement and volume change due to Patient’s breathing pattern during evaluation of treatment plans.
Materials and methods : The subjects were taken from 10 lung cancer patients who received Respiratory Gated Radiotherapy. Using Eclipse(Ver 13.6 Varian, USA), the structures seen in the top phase of CT image was equally set via Propagation or Segmentation Wizard menu, and the structure’s movement and volume were analyzed by Center-to Center method. Also, image from each phase and the dose distribution were deformed into top phase CT image, for 4-dimensional dose evaluation, via VELOCITY Program. Also, Using QUASARTM Phantom(Modus Medical Devices) and GAFCHROMICTM EBT3 Film(Ashland, USA), verification carried out 4-D dose distribution for 4-D gamma pass rate.
Result : The movement of the Inspiration and expiration phase was the most significant in axial direction of right lung, as 0.989±0.34 cm, and was the least significant in lateral direction of spinal cord, as -0.001 cm. The volume of right lung showed the greatest rate of change as 33.5 %. The maximal and minimal difference in PTV Confor- mity Index and Homogeneity Index between 3-dimensional dose evaluation and 4-dimensional dose evaluation, was 0.076, 0.021 and 0.011, 0.0 respectfully. The difference of 0.0045~2.76 % was determined in normal structures, using 4-D dose evaluation. 4-D gamma pass rate of every patients passed reference of 95 % gamma pass rate.
Conclusion : PTV Conformity Index was more significant in all patients using 4-D dose evaluation, but no sig- nificant difference was observed between two dose evaluations for Homogeneity Index. 4-D dose distribution was shown more homogeneous dose compared to 3D dose distribution, by considering the movement from breathing which helps to fill out the PTV margin area. There was difference of 0.004~2.76 % in 4D evaluation of normal structure, and there was significant difference between two evaluation methods in all normal structures, except spinal cord. This study shows that normal structures could be underestimated by 3-D dose evaluation.
Therefore, 4-D dose evaluation with Deformable Image Registration will be considered when the dose change is expected in normal structures due to patient’s breathing pattern. 4-D dose evaluation with Deformable Image Registration is considered to be a more realistic dose evaluation method by reflecting the movement of normal structures from patient’s breathing pattern.
▶Keyword : Lung cancer, Respiratory Gated Radiotherapy, Deformable Image Registration, 4-Dimensional Dose Evaluation