3D Building Reconstruction Using a New Perceptual Grouping Technique
Dong-Min Woo*★
, Quoc-Dat Nguyen**
Abstract
This paper presents a new method for building detection and reconstruction from aerial images. In our approach, we extract the useful building location information from the generated disparity map to obtain the segmentation of interested objects and thus reduce significantly unnecessary line segment extracted in low level feature extraction step. Hypothesis selection is carried out by using undirected graph in which close cycles represent complete rooftops hypotheses, and hypothesis are finally tested to contruct building model. We test the proposed method with synthetic images generated from Avenches dataset of Ascona aerial images. The experiment result shows that the extracted 3D line segments of the buildings can be efficiently used for the task of building detection and reconstruction from aerial images.
Key words: aerial image, segmentation, perceptual grouping, building reconstruction, 3D line
* Dept. of Information Engineering, Myongji University
** HSBC, Vietnam
★Corresponding author
※ Acknowledgment: This work was supported by the Korea Science and Engineering Foundation(KOSEF) grant funded by the Korean government (MOST)(Grant No.: R01-2007-000-20330-0).
Manuscript received Feb. 2, 2005 ; reviced Dec. 25, 2005
I. Introduction
The building detection and reconstruction from aerial images is one of the challenging tasks in computer vision. It has been used widely in various applications including traditional applications such as cartography and photo-interpretation and recent application including mission planning, urban planning, computer graphics and virtual reality.
There are two main problems needed to solve in any buildings detection approach. The interested objects need to be segmented from the background.
And fragmented line segments of the interested object’s boundaries should be grouped to human-made structures. These are challenges
because the objects of interest could be partly occluded by the presence of vegetation, shadows, road and other objects. Moreover, lines and corners of object are often fragmented and missed due to the typical failures of low level features extraction.
These tasks have been intensively studied in the field of computer vision.
Early approaches tried to use a singe image only [1], [2]. This direction has some restrictions such as inferring 3D information from one image is very difficult and there are still some ambiguities in the detected buildings that can be only resolved by feature matching in multiple images. Since, multiple aerial images can be obtained with only small extra cost. Most of the recent work in this area has focused on the multiple-view analysis [3]-[5].
Mohan and Nevatia [6] proposed an approach for detecting and describing buildings in aerial image using perceptual grouping. They demonstrated the usefulness of the structural relationships called collated features which can be explored by perceptual organization in complex image analysis.
All reasonable feature groupings are first detected and the candidates are then selected by a constraint
satisfaction network. But this approach involves all extracted line segments in the image. Consequently it costs a big computational effort. It also depends on the accurate extraction of line segments.
Huertas [7] suggested using extracted cues from the IFSAR data, while Kim [8] gets from commercial DEM (Digital Elevation Map) to solve the segmentation of interested objects problem. The extracted cues do not give us the shape of the buildings. However they can give us the idea where the buildings are located in the image.
Unfortunately, it is not easy to have IFSAR data or DEM image in all cases.
Some approaches such as Lin [2] and Noronha [4]
use hypothesize and verify paradigm based on perceptual grouping to solve the second problems.
Hypotheses are generated by a hierarchical perceptual grouping process and verified by the evidence of visible walls and expected shadows. But the system needs to make several decisions in the selection and verification process based on simplicity and intuitive judgments that affects a lot to the final result. In monocular analysis, Jaynes [9]
proposed task driven perceptual organization for extraction of rooftop. Features such as corner and linesegment are first extracted and assigned a certainty value. Then feature and their grouping are stored in a feature relation graph. Close cycles in the graph represent the grouped polygon hypotheses.
The independent set of closed groups that have maximum sum of certainty values of its parts is the final grouping choice. This approach is limited on rectangular buildings and tends to have false hypotheses in complexity images.
In this paper, we propose a new method for rectilinear building detection and reconstruction using two overlapping aerial images. We use hypothesis generation and selection based on perceptual organization strategy to solve the building detection task. The key idea is that we use the proposed suspected building regions extracted from the disparity map for obtaining the location of interested objects in the image. This building location information helps to remove the unnecessary line segments in the low level feature extraction result and thus reduces computational complexity and false hypotheses in later steps.
Additionally, hypothesis selection is carried out by graph searching for close cycles in an undirected graph. Comparing with Jaynes’s approach, our method detect corners from filtered low level features before constructing the graph whereas corners are extracted using pre-defined corner masks and each corner can take part in many different close cycles in his approach. So our system can significantly reduce computational complexity and false hypotheses. Moreover, we expand the condition required for a link between two corners to be formed and thus enable our system to detect the rectilinear buildings that Jaynes’s approach does not detect. For building reconstruction, we retrieve 3D information of the buildings using 3D triangulation with the known geometric parameters of image acquisition.
II. System Overview
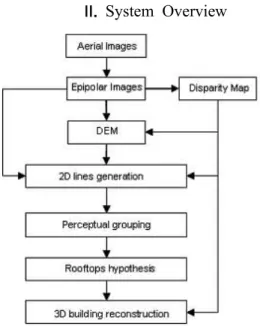
Fig. 1. System overview
Fig.1 shows the main components in our system.
The epipolar images are generated from the aerial images by epipolar resampling process. We obtain the disparity map between the epipolar pairs by stereo matching using area-based matching with non-parametric technique. From the disparity map, we generate the DEM as a 3D terrain model. The building location information extracted from
disparity map is used to remove the unnecessary line segments extracted in the low level process.
After 2D lines are generated, perceptual grouping is applied to the filtered line segments in order to obtain the structural relationship features such as parallel line segment pairs and U-shapes,. These can be used to generate rooftop hypotheses. Among the generated hypothesis, the candidate rooftop is selected by searching close cycles in the undirected graph. Finally, we retrieve 3D buildings by using 3D triangulation for each line segment of detected rooftops.
III. Generation of Suspected Building Regions
It is usually difficult to separate interested objects from 2D line segments collection obtained in low level features extraction. The boundary of interested objects, the buildings, can be partly occluded by vegetation, shadows, and other objects. In rooftop hypothesis process, these fragmented boundaries and the presence of roads, vehicles ... can make false hypotheses including unwanted rooftop and wrong shape rooftop. This causes not only significant computational effort in processing but also wrong final results. To solve this problem, the systemshould be able to detect line segments that are within or near buildings in the image. Here, we use suspected building regions which extracted from the disparity map. The suspected building regions are areas which pixel values changes in comparison with the surround area. The different of pixel values between suspected building region and surround areas indicates the different of elevation values. It indicates the existing of higher objects such as buildings, trees ... in those regions. In the other words, these regions can give us the information of where the buildings are located.
These regions could be extracted by using a simple height threshold technique. Their boundaries are extracted by convolving the disparity map with a Laplacian-of-Gaussian filter then employing connected component analysis to get zero-crossing pixels’ coordinate in the convolution output. We have LoG as an operator or convolution kernel defined as:
(1)
IV. 3D Rooftop Model Generation 1. Low level features extraction
To detect 2D lines from epipolar image, edge detection is carried out first and then 2D lines are formed from edges. We employed Canny edge detector, since it is optimal according to the criteria where edge is defined and comes up with thin edges. To obtain 2D line segment, we use Boldt algorithm [12] based on token grouping. The method extracts a basic line element, token, in terms of the properties of line A and construct 2D line using grouping process. It is efficient in detecting 2D lines of large structure appeared in urban image.
2. Grouping and filtering process
The closely parallel linear segments can be grouped, since they usually represent a linear structure of objects in image, like the border of a roof or the divider between ground terrain and building, by using a "folding space" between two line segments. If both line segments are inside the folding space, two line segments can be replaced by a single line which orientation is the longer line segment orientation and length is total length of two segments. After this process, each group of the closely overlapping and parallel line segments is represents only by one single line.
Fig.2 showed the typical case of closely parallel linear segments grouping. These linear segments are or nearly parallel lines. So the first condition is the angle between them should be from 00 to 100. If two line segments are fragmented lines from one edge, these line segments must be close and should be inside a folding space created by them.
The U shaped structure in Fig.3 is used to detect candidates for rooftop hypothesis generation. Any line segment in a set of parallel lines with aligned end is a U shaped structure candidate which is kept as input for hypothesis generation, otherwise that
line segment will be removed.
Fig. 2. Folding space
Fig. 3. U-structure 3. Corner detection
Corner is calculated as intersection of two line segments which their angle is from 800to 1000and one of them has nearest distance to another one.
We define four types of corner. They are labeled as I, II, III and IV, as shown in Fig. 4. Each corner has an attribute to indicate whether it is L-junction or T-junction. This attribute is used to decide whether two different corners have a connection or not. For example, if a corner’s label is I and type is L-junction, it connects to any type of corner.
However, it prefers connecting to a corner which label is II or IV. If that corner is T-junction, it can only connect to a corner which label is II or IV.
This rule is used in hypothesis generation to build collated features.
Fig. 4. Corner labeling
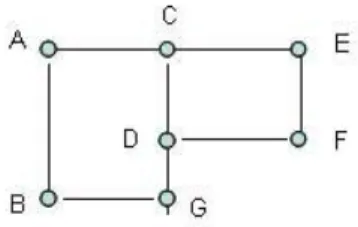
With the flexible connection between corners, our method is able to detect rectilinear rooftops. Fig. 5 show some examples of corner detection, A, B, E, F, G are L-junctions while C, D are T-junctions.
Fig. 5. Corner detection 4. Rooftop hypothesis generation
A collated feature is a sequence of perceptually grouped corners and line segments. Here, collated features are constructed from filtered line segments and corners obtained from the filtering and grouping process. That reduces computational effort and false hypotheses.
Hypotheses are formed by alternation of corners and line segments that form collated features. In a collated feature, two corners have connectivity only if they satisfy the corner relation condition and they are the nearest appropriate corner to each other.
Beside, every corner connects to only one corner on each its line segment direction. Hypothesis generation is performed by constructing the feature graph. Construction of the graph can be seen as placing corners as nodes and edges between nodes if there is the relation between the corresponding corners in the collated features. When a node is inserted into the graph, the system looks into the remaining nodes whether any node has the relation with the inserted node. If some nodes satisfy the connectivity relation rules, those nodes are inserted into the graph and the system creates an edge between them. In the example shown in Fig. 5, C is T-junction, and it can connect to D, A and E.
Meanwhile, A can connect to B, C and E but C is nearer than E towards A on the line segment AE so that A only connects to B and C.
Consequentlythere will be two collated features ACGB and CEFD in the Fig. 5.
5. Rooftop hypothesis selection
The graph is the place to store features and their groupings. Feature as corner is node in the graph and relations between corners are represented with an edge between the corresponding nodes. Closed cycles in the graph represent the rooftop candidates.
The hypothesis selection can be seen as a simple graph search problem. The close cycles in the graph are rooftops that we need to detect. Fig. 6 show a graph constructed from the example in Fig.5. Corner C and corner D are T-junctions so that there are two nodes in the graph for each corner. Node C1, C2 for corner C and node D1, D2 for corner D.
There are two close cycles C1 and C2 as shown in Fig. 6.
Fig. 6. Feature graph 6. 3D building reconstruction
3D triangulation is used to generate 3D line segments. The relationship between a point k located at in model/objects space and the projection of the point k located at
in the image of camera L is
(3)
In vector form, we have
(4) where is the model space coordinates of the focal point of camera L, is the focal length of camera L, is the scale factor for point k projected on the focal plane of camera L and is the rotation matrix between the image space coordinate system and the model space coordinate system.
We have a system of equations for five variables from each pair of points in two images. Solving that system of equations we have the real 3D
coordinates of the selected points in two images. As a result, we have 3D line segments from the corresponding 2D line segments.
V. Experimental Results
The experimental environment was set up based on Ascona aerial images of the Avenches area.
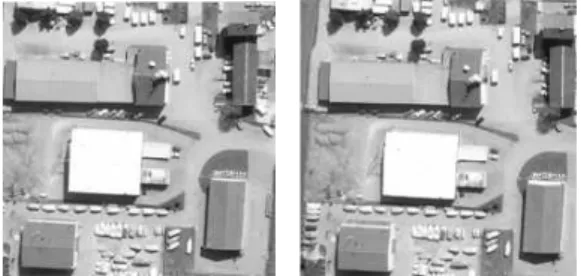
Since this area’s 3D model is supplied as a ground truth data, we can evaluate the quantitative accuracy for the 3D rooftop model generated by the proposed method. Two aerial images as shown in Fig. 7 are used as a set of stereo images for experiments.
Fig. 7. Aerial images used as a set of stereo image The result of epipolar resampling process is shown in Fig.8. We generate suspected building regions from the map to reduce unnecessary line segments.
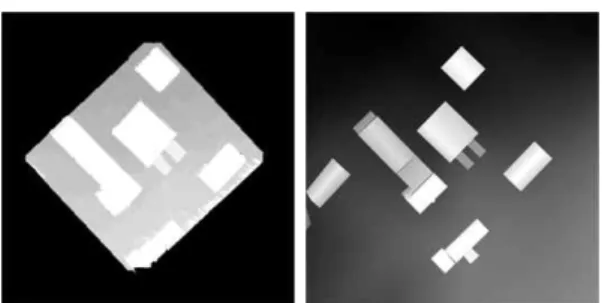
To find the accurate disparity map, we employed the multi-resolution scheme with four different resolutions, where scaled image sizes equal to original size divided by 2n, n = (0,1,2,3). The corresponding correlation window sizes are 3x3, 5x5, 7x7 and 9x9, while the census transform window sizes are 3x3, 5x5, 7x7, and 9x9. Fig. 9 shows generated DEM image [13], [14] and ground truth image.
Fig. 8. Example of epipolar images
Fig. 9. Generated DEM image and ground truth image Fig. 10 shows the line segments obtained from low level feature extraction process. The number of extracted line segment is about 1425.
Fig. 10. Example of low level extraction result
Fig. 11. Example of filtered line segments Some unnecessary line segments can be filtered out by using suspected building regions extracted from the disparity map. The result of unnecessary line segments removing is shown in Fig. 11.
Remaining line segments are about 405. Now,
perceptual filtering and grouping process is employed to obtain line segments which can be part of any U-structure group. The close parallel line segments which are inside their folding space of each other will be grouped into one representation line. The line segments which are part of a collection of line segments forming U-structure will be used to generate hypotheses in the next step.
Fig. 12 shows the line segments forming U-structures in a collection of line segments. The colors indicate which U-structure group that the line segment belongs to.
Fig. 12. Example of U-structures
Fig. 13. Example of collated features
The corners are calculated form the intersection of the line segments which satisfy two conditions:
their angle is from 850 to 950 and one of them has nearest distance to another one. Fig. 13 shows extracted corners from the line segments collection.
Using the obtained corners and line segments from the previous steps, we can build the collated features. In order to have a link between eachother, two corners must satisfy the connecting relation of corner type and the required condition of their distance. Another important rule that help to define the corner connectivity is on each line segment of a corner, there is only one corner has connection with
it. Fig. 13 shows the collated features obtained from the line segments collection.
The collated features are used to construct graph by placing a corner as a nodes and line segment two corners as edge between two nodes if there is the relation between the corresponding corners in the collated features. Closed cycles in the graph represent the possible rooftops. Hypothesis selection becomes the searching of close cycles in the graph.
Fig. 14 shows the close cycles selected from the line segments collection.
Fig. 14. Example of close cycles
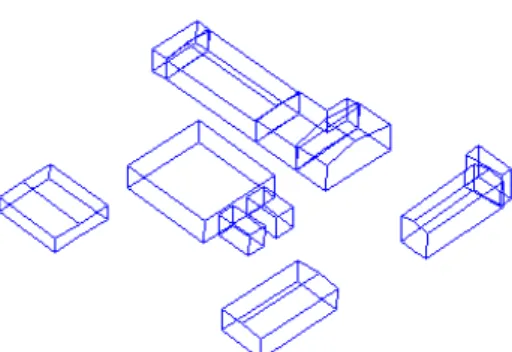
Fig. 15 shows rooftop detection result of the entire area. There is a building located near the border line of the epipolar image that the system can not detect correctly due to missing line segments in low level extraction step. The result of remaining building is very good. From the detected rooftop and the known geometric parameters of image acquisition, we reconstruct 3D building using 3D triangulation as shown in Fig. 16.
Fig. 15. Example of detected rooftops
Fig. 16. Example of 3D building reconstruction
VI. Conclusion
A new approach to detect and reconstruct buildings using perceptual organization from two aerial images has been suggested. Low level feature extraction is not applied in the original images but from the epipolar images that help to reduce the search effort in image matching process. The proposed suspected building regions are used to remove the unnecessary line segments before generating rooftop hypotheses help reducing computational complexity and false hypotheses.
Using undirected feature graph, the selection of rooftop hypotheses becomes a simple graph searching for close cycles. Experimental result shows that the proposed method can be very effectively utilized for the rectilinear structures of urban area.
References
[1] A. Huertas and R. Nevatia, "Detecting Buildings in Aerial Images", Computer Vision, Graphics and Image Processing, vol.41, no.2, pp.131-152, 1988.
[2] C.A. Lin and R. Nevatia, "Building Detection and Description from a Single Intensity Image", Computer Vision and Image Understanding, vol.72, no.2, pp.101-121, 1998.
[3] A. Fischer, T. Kolbe, F. Lang, A. Cremers, W.
Forstner, L. Plumer, and V. Steinhage, "Extracting Buildings from Aerial Images Using Hierarchical Aggregation in 2D and 3D", Computer Vision and Image Understanding, vol.72, no.2, pp.185-203, 1998.
Dong-Min Woo (Nember)
1980 : BS degree in Electronic Engineering, Yonsei University.
1982 : MS degree in Electronic Engineering, Yonsei University.
1987 : PhD degree in Electrical Engineering, Case Western Reserve University.
1990~present : Professor, Myongji University [4] S. Noronha and R. Nevatia, "Detection and
Modeling of Buildings from Multiple Aerial Images", IEEE Transaction on Pattern Analysis and Machine Intelligence, vol.23, no.5, pp.501-518, 2001.
[5] R. Collins, C. Jaynes, Y.Q. Cheng, X. Wang, F.
Stolle, E. Riseman, and A. Hanson, "The Ascender System: Automated Site Modeling from Multiple Aerial Images", Computer Vision and Image Understanding, vol.72, no.2, pp.143-162, 1998.
[6] R. Mohan and R. Nevatia, “Using Perceptual Organization to Extract 3D Structure”, Trans. Pattern Analysis and Machine Intelligence, vol.11, no.11, pp.1121-1139, 1989.
[7] A. Huertas, Z. Kim and R. Nevatia, “Use of Cues from Range Data for Building Modeling”, Proc.
DARPA Image Understanding Workshop, pp.577-582, 1998.
[8] Z. Kim and R. Nevatia, “Automatic description of complex buildings from multiple images”, Computer Vision and Image Understanding, vol.96, pp.60-95, 2004.
[9] C. Jaynes, F. Stolle and R. Collin, “Task driven perceptual organization for extraction of rooftop polygons”, IEEE Workshop on Application of Computer Vision, pp.152-159, 1994.
[10] R. Zabih, J. Woodfill, “A non-parametric approach to visual correspondence”, Submitted to IEEE Transactions on Pattern Analysis and Machine Intelligence.
[11] J. Banks, M. Bennamoun and P. Corke
“Non-parametric technique for fast and robust stereo matching”, IEEE TENCON – Speech and Image Technologies for Computing and Telecommunication, pp.365-368, 1997.
[12] M. Boldt, R. Weiss, E. Riseman, “Token-based Extraction of Straight Lines”, IEEE Trans. Systems Man Cybernetics, vol.19, pp.1581-1594, 1989.
[13] M. Hannah, “A System for Digital Stereo Image Matching”, Photogrammetric Engineering and Remote Sensing, vol.55, pp.1765-1770, 1989.
[14] H. Schultz, “Terrain Reconstruction from Widely Separated Images”, Proceeding of SPIE, vol.2486, pp.113-122, 1995.
BIOGRAPHY
Quoc-Dat Nguyen
2003 : BE degree in Electrical Engineering, Ho Chi Minh University of Technology..
2008 : MS degree in Information Engineering, Myongji University.
2008~present : System Engineer, HSBC Vietnam