801
"J. Korean Soc. Radiol., Vol. 12, No. 7, December 2018"
Analysis of the Dead Layer Thickness effect and HPGe Detector by Penelope Simulation
Eun-Sung Jang,1 Hyo-Yeong Lee2,*
1Department of Radiation Oncology, Kosin University Gospel Hospital
2Department of Radiological Science, Dong-Eui University
Received: November 26, 2018. Revised: December 26, 2018. Accepted: December 31, 2018
ABSTRACT
Germanium crystals have a dead layer that causes efficiency deterioration because the layer is not useful for detection but strongly weakens the photons. Thus, when the data provided by the manufacturer is used in the detector simulation model, there is a slight difference between the calculated efficiency and the measured efficiency.The shape and dimensions of the high purity germanium (HPGe) detector were determined by CT scans to accurately characterize the shape for the Monte Carlo roll simulation. It is found that the adjustment of the dead layer is a good match with the relative deviation of ± 3% between the measurement efficiency and the simulation efficiency at the energy range of 50 - 1500 keV. Simulation data were compared by varying the thickness of the dead layer. The new Monte Carlo simulations were compared with the experimental results to obtain new blank layer thicknesses. The difference in dead layer results for the 1.5 mm thick end cap simulation model in 1.4 and 1.6 mm thick End Cap simulation models was a systematic error due to the accuracy of the end cap dimensions. After considering all errors including statistical errors and systematic errors, the thickness of the detector was calculated as 1.02 ± 0.14 mm. Therefore, it was confirmed that the increase in the thickness of the dead layer causes the effect to be effected on the efficiency reduction.
Keywords: Dead layer, HPGe detector, PENELOPE, point source
Ⅰ. INTRODUCTION
게르마늄 결정은 층이 검출에 유용하지 않지만, 광자를 강하게 약화하기 때문에 효율성 저하를 일으 키는 불감층을 가지고 있다. 이 비활성 계층의 두께는 광자가 점점 흡수되는 전이 영역의 존재 때문에 잘 알려지지 않았다. 따라서 제조업체가 제공하는 데이 터를 검출기 시뮬레이션 모델에 사용하면 계산된 효 율성과 측정된 효율성 사이에 약간의 큰 차이가 나타 난다.[1] 몬테카를로 방법은 추정된 효율과 실험 효율 사이의 최소 차이를 얻기 위해 필요한 총 불활성 게르마늄 층 두께와 활성 볼륨을 결정하기 위해 HPGe 검출기의 보정을 적용한다.[1-4] 표준 교정 감
마선 에 포함된 133Ba 방사성 핵종에 대해 계산 및 측정을 했다. 본 연구에서는 P형 동축 HPGe 검출 기의 내부 불감층의 두께를 평가하는 절차가 설명 되었다. 설험 측정은 선원에서 검출기까지 5cm 및 10cm 거리의 표준 점 선원 133Ba, 152Eu로 수행하였 다. 고순도 게르마늄(high purity germanium, HPGe) 검출기의 모양과 치수는 몬테카를로 시뮬레이션을 위해 형상을 정확하게 특성화하기 위해 CT촬영을 통해 결정하였다. 불감층 두께 증가가 효율 감소과 정에 미치는 영향을 연구하고자 한다. 불감층 두께 에 변화를 주어 시뮬레이션 데이터를 비교하였다.
Ⅱ. MATERIAL AND METHODS
https://doi.org/10.7742/jksr.2018.12.7.801
* Corresponding Author: Hyo-Yeong Lee E-mail: [email protected] Tel: +82-51-890-2679
1. Detector geometry
p형 HPGe 검출기를 이용한 감마 분광계 GMC 30185가 사용되었다. closed- ended coaxial type이며 제조사에서 제공한 데이터는 Table 1과 Fig. 1에 나타 내었으며 검출기는 컴퓨터 단층촬영(computer tomography)으로 스캔하여 측정치와 비교하였다.
Table 1. Detector dimensions as specified by the manufacturer and as optimised by Monte Carlo simulations.
Miscellaneous Detector Assembly Dimensions Detector parameter Dimension Optimized
Mount Cup, Length A 94 mm 108 mm
End cap to Crystal
Gap B 3 mm 3 mm
Mount Cup Base C 3.2 mm 3.2 mm
End Cap Window D 1.3 mm 1.3 mm
Insulator/shield E 0.03/ 0.03 mm 0.03/ 0.03 mm Outside Contact
Layer F 1.3 mm 2 mm
Hole Contact Layer G 0.3 microns 1.3 mm Mount Cup Wall H 0.76 mm 0.76 mm
End Cap Wall I 1.3 mm 1.3 mm
Note) PENELOPE: Penetration and Energy Loss of Positrons and Electrons.
Fig. 1. Characteristics of HPGe detector as provided by the manufacturer.
2. Disposition of the detector by Monte Carlo of PENELOPE
시뮬레이션은 크리스털 반경 3mm, 길이 94mm, 내부
구멍 반경 1. 3mm의 P 모양 폐쇄 동축형 HPGe 검 출기에 대해 수행되었다.[4-5] 검출기 앤드 캡은 두께 3mm, 반경 0.76mm ,길이 94mm의 Al으로 제작되었다.
앤드 캡에서 크리스털까지의 거리는 0.5cm 이다.
검출기 시스템은 원통형 대칭이다.[5] 이 파라미터에 대한 시뮬레이션 결과의 의존성을 관찰하기 위해 검출기 모델에 불감층 두께 변화를 시켰다. 대칭축에 배치된 점 선원 고려했다. 첫 번째 실행은 50~400 keV 사이의 에너지스펙트럼, 피크 및 효율의 평가로 구성되었다. 일반적으로 각 시뮬레이션에 대해 최종 적으로 133Ba 선원의 시뮬레이션 결과를 얻기 위해 불감층의 두께를 0mm에서 2.0mm까지 스캔했다.
3. The Systematic errors
133Ba, 152Eu 점 선원은 여러 개의 광전자 피크가 있는 불감층을 측정할 수 있다. 낮은 에너지에서 높은 에너지로 Table 2에 나와 있다.
Table 2. Gamma ray intensities of a 133Ba ,152Eu source
Energy/keV Intensity/ %
53.16 2.14
79.61 2.65
81.0 32.95
160.61 0.64
276.40 7.16
302.85 18.34
356.01 62.05
383.85 8.94
867.38 4.25
1112.08 13.44
1408.1 20.86
낮은 에너지 광자는 높은 에너지 광자와 비교하면 표면에서 상호 작용할 가능성이 높으며 표면 이벤 트는 광전자 피크에 전혀 기여하지 않는다. 불감층의 두께가 다르면 감마선에 대한 광전자 봉우리의 강도 비율이 서로 다른 에너지를 갖게 됨을 의미한다.
불감층 두께를 측정하는 단계는 다음과 같다. 첫째, 실험에서 서로 다른 광전자 피크의 비율을 얻기 위해 차폐체 없이 133Ba가 사용되었다. 두 번째로 불감층 두께를 제외한 모든 파라미터가 알려져 있기 때문에 일련의 불감층 두께가 각각 비율의 시뮬레이션 결
"J. Korean Soc. Radiol., Vol. 12, No. 7, December 2018"
과를 얻는 것으로 가정했다. 마지막으로 불감층 두 께는 실험 데이터와 시뮬레이션 데이터를 비교하여 도출되었다. 실험에서 그림 2와 같이 콜리메이터 되지 않은 133Ba, 152Eu 선원을 검출기 끝 캡 0.5mm 위에 놓았다. 133Ba 선원과 앤드 캡 사이의 거리변 화에 따른 격장방법을 이용하여 측정하였다.
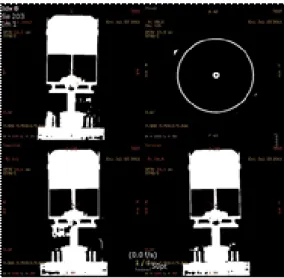
Fig. 2. CT radiogram of the detector system.
4. experimental process
133Ba, 152Eu 점 선원은 여러 개의 광전자 피크가 있는 불감층을 측정할 수 있다. 낮은 에너지에서 높은 에너지로 Table 2에 나와 있다. 낮은 에너지 광자는 높은 에너지 광자와 비교하면 표면에서 상호 작용할 가능성이 높으며 표면 이벤트는 광전자 피 크에 전혀 기여하지 않는다. 불감층의 두께가 다르면 감마선에 대한 광전자 봉우리의 강도 비율이 서로 다른 에너지를 갖게 됨을 의미한다. 불감층 두께를 측정하는 단계는 다음과 같다. 첫째, 실험에서 서로 다른 광전자 피크의 비율을 얻기 위해 차폐체 없이
133Ba가 사용되었다. 두 번째로 불감층 두께를 제외한 모든 파라미터가 알려져 있기 때문에 일련의 불감 층 두께가 각각 비율의 시뮬레이션 결과를 얻는 것 으로 가정했다. 마지막으로 불감층 두께는 실험 데 이터와 시뮬레이션 데이터를 비교하여 도출되었다.
실험에서 그림 와 같이 콜리메이터 되지 않은
133Ba, 152Eu선원을 검출기 끝 캡 0.5mm 위에 놓았다.
133Ba, 152Eu선원과 앤드 캡 사이의 거리변화에 따른 격장방법을 이용하여 측정하였다.
Ⅲ. RESULT
1. Data analysis
Fig. 2에서 CT 촬영 사진으로부터 반지름을 결정 했다. 상단 가장자리 1.8mm, 하단 가장자리 3mm 전반적으로 측정의 크기는 2% 이내에서 잘 일치하 였다. 제조사에서 제공한 불감층의 두께는 0.6mm 이다. 이 결과는 이 에너지 간격에서 지연된 신호의 기여로 설명할 수 있는 데드층 두께 효과가 관측됨을 의미한다. 또한, 이 에너지 영역에서 측정된 스펙트 럼은 PENELOPE 코드에 의해 계산된 것보다 높았다.
1.02mm의 데드 레이어의 두께를 유도하기 위해 실험 데이터와 시뮬레이션 결과 사이의 일치가 달성 되었습니다. 0.535(15) MM의 결과는 검출기의 중앙 부분에 대해 0.540(10) MM 값과 일치했다.
2. Simulation data analysis
제조사에서 제공한 데이터를 기준으로 Penelope code를 사용하여 에너지 및 효율을 일치시켰다. 또한 불감층의 내부 일부분 두께, 즉 0.51에서 0.53mm까지 변경했다. 불감층의 상면 그리고 측면에서도 0.5325의 일정한 두께를 가지고 있음을 확인하여 매우 잘 일치하였다. 따라서 전체적으로 불감층 변 화에 관한 실험은 불감층이 거의 균질하다는 것을 Fig. 3에서 확인하였다.
Fig. 3. The simulation spectrum of the 133Ba source.
The distance between the source and end-cap is 10 mm, and the dead layer thickness is assumed to be 1.0 mm.
Fig. 4. Peak efficiency curves for several values of the thickness of the dead layer.
전체 에너지 피크 효율에서 내측 불감층 두께의 역할은 Penelope 코드에 의해 설명되며, 효율 곡선의 기울기 계수는 불감층 두께와 선형 관계가 있음이 관찰되었다. 불감층의 조정은 50–1500 keV의 에너 지 범위에서 측정 효율과 시뮬레이션 효율 사이의
± 3%이내에서 잘 일치됨을 Fig. 4에서 확인하였다.
3. Systematic errors data analysis
몬테카롤로 시뮬레이션 결과를 실험 결과와 비교 하여 새로운 불감층 두께를 얻었다. 1.4와 1.6 mm 두께의 End Cap 시뮬레이션 모델에서 1.5mm 두께의 End Cap 시뮬레이션 모델에 대한 불감층 두께 결과의 차이는 End Cap 치수의 정확성으로 인한 체계적인 오류였음을 확인했다. 통계적 오류와 체계적 오류를 포함한 모든 오류를 고려한 후, 검출기의 불감충 두 께는 1.02±0.14 mm로 도출되었다.
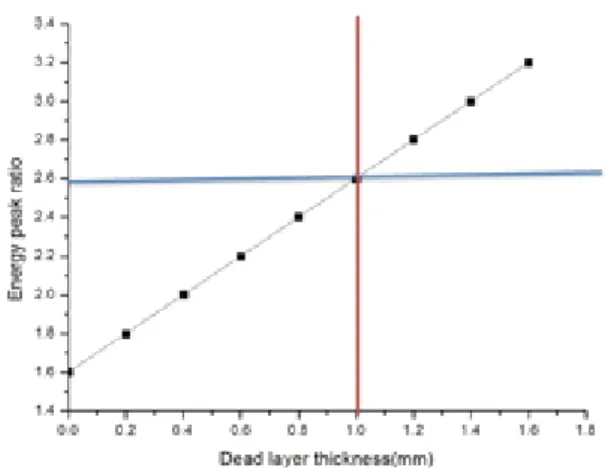
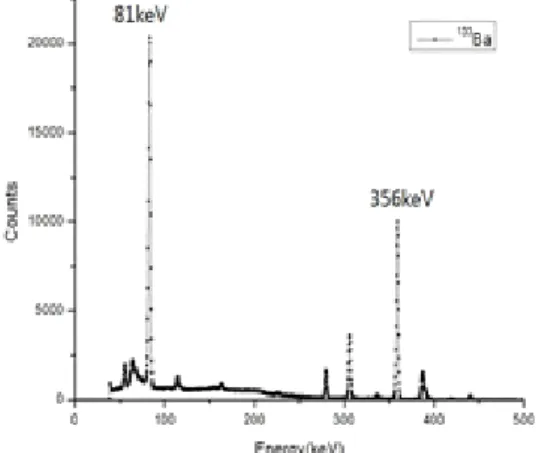
Fig. 5에서 상부와 하부에서의 낮은 반응은 결정의 라운딩 때문에 Al 링의 위치에서의 낮은 반응은 구 조에 상응함을 확인하였다. 또한. Fig. 6에 나타난 것과 같이 시뮬레이션의 통계적 오류 막대가 있는 다양한 불감층의 두께의 점은 81 keV 광전자 피크와 356 keV 광전자 피크 사이의 이벤트 수의 비율을 보여준다. 수평대역은 실험 데이터에서 측정한 비 율을 나타내며, 수직 대역은 시뮬레이션 데이터를 비교하여 불감층의 두께를 결정한다. 불감층의 두 께가 달라지면 감마선에 대한 광전자 피크의 강도 비율이 다른 에너지를 갖게 됨을 의미한다.
Fig. 5. Determination of the thickness of the dead layery the source point of 5 mm. The black points are from the simulation providing the ratio of the number of events on the 81 keV photoelectron peak to that in the 356 keV photoelectron peak. The horizontal band is from the experimental data. The vertical band determines the dead layer thickness by comparing the experimental ratio and simulation fitting line. The error bars for the simulation points are smaller than the data point size and invisible in the plot.
Fig. 6. An experimental spectrum of the 133Ba source. The distance between the source and end-cap is 5 mm, and the dead layer thickness is assumed to be 1.0 mm
4. Experimental data analysis
Fig. 7에서 알 수 있듯이 276.40 kev의 입사 광선의 약 7%는 검출기의 불감층에서 흡수된다.
1112.08keV의 13%는 같은 불감층의 두께로 흡수
"J. Korean Soc. Radiol., Vol. 12, No. 7, December 2018"
된다. 검출기 깊이 9.4 mm까지 276.40 keV의 63%는 이미 1112 keV 방사선의 46%에 대해 흡수되어 있다.
1112 keV 약 절반이 검출기의 상부에 흡수된다. 흡 수된 구멍 깊이의 효과는 1112keV의 감마선보다 더 커질 것이다. 따라서 불감층의 영향은 276.4 keV의 감마선에서 더 커지고 구멍 깊이의 영양은 1112 keV에서 더 커짐을 확인하였다.
Fig. 7. Mapping of fraction of gamma ray absorbed at different layers in the detector.
Ⅳ. DISCUSSION & CONCLUSION 불감층의 두께 측정과 몬테카롤로 시뮬레이션의 비 교를 통해 측정 결과를 재현하는 불감층 변형(Vari ation)을 HPGe 검출기 모델에 구현할 수 있다[6-10].
상대 효율의 감소는 불감층 두께에 선형적으로 의존하며, 이 두 파라미터는 작동시간대 선형적으로 증가한다. 불감층 두께의 증가는 효율성 감소에 영 향을 미치는 것을 확인하였다.
Reference
[1] J. Boson, G. Agren, L. Johansson, "A detailed investigation of HPGe detector response for improved Monte Carlo efficiency calculations," Nuclear
Instruments and Methods in Physics. Vol. 587, No.
2, pp. 304-314. 2008.
[2] P. Dryak, P. Kovar, "Experimental and MC
determination of HPGe detector efficiency in the 40–
2754 keV energy range for measuring point source geometry with the source to detector distance of 25
cm," Applied Radiation Isotopes, Vol. 64, No. 10, pp. 1346–1349, 2006.
[3] E. Andreotti, M. Hult, G. Marissens, G. Lutter, A.
Garfagnini, S. Hemmer, K. Von Sturm,
"Deterrmination of dead-layer variation in HPGe detector," Applied Radiation Isotopes, Vol. 87, No. 4, pp. 331-335, 2014.
[4] Huy N.Q., Binh D.Q., An V.X., "Study on the increase of inactive germanium layer in a high-purity germanium detector after a long time operation applying MCNP code," Nuclear Instrumnets and Methods in Physics, Vol. 537, No. 3, pp. 384-388, 2006.
[5] Huy N.Q. et al., "The influence of dead layer thickness increase on efficiency decrease for a coaxial HPGe p-type detector," Nuclear Instrumnets and Methods in Physics, Vol. 621, No. 1, pp.
390-394, 2010.
[6] J. Rodenas, A. Pascual, I. Zarza, V. Serradell, J.
Ortiz, L. Ballesteros, "Analusis of the influence of germanium dead layer on detector calibration simulation for environmental radioactive samples using the Monte Carlo method," Nuclear Instrumets and Methods in Physics, Vol. 496, No. 2, pp.
390-399, 2003.
[7] W. Sowa, E. Martini, K. Gehrcke, P. Marschner, M.J. Naziry. "Uncertainties of in situ gamma spectrometry for environmental monitoring," Radiat.
Prot. Dosim., Vol. 27, No. 2, pp. 93, 1989.
[8] K. Rybacck, P. Jacob, R. Meckbach, "In-situ determination of deposited radionuclide activities:
Improved method using derived depth disrtibution from the measured photon spectra," Health Phys., Vol. 62, No. 6, pp. 519-528, 1992.
[9] TTH. Loan, VN. Ba, THN, Thy, HTN. Hong.
"Validation for Monte Carlo simulation of characteristics of gamma spectrometer using HPGe GMX35p470 detector by MCNP5 and Geant4 codes,"
Journal of Science Ho Chi Minh city University, Vol. 3 No. 81, pp. 27-33. 2016.
[10] TTH. Loan, DN. Phung, TT. Thanh, TA. Khnah, MV. Nhon, "Monte Carlo simulation of HPGe detectorresponse function with using MCNP code,"
Communication Physics, Vol. 17, No 1, pp. 59-64, 2007.
Penelope Simulation에 의한 불감층 두께 효과 및 HPGe 검출기 분석
장은성,1 이효영2,*
1고신대학교 복음병원 방사선종양학과
2동의대학교 방사선학과
게르마늄 결정은 검출에 유용하지 않지만, 광자를 강하게 약화하기 때문에 효율성 저하를 일어키는 불감 층을 가지고 있다. 따라서 제조업체가 제공하는 데이터를 검출기 시뮬레이션 모델에 사용하면 계산된 효율 성과 측정된 효율성 사이에 약간의 큰 차이가 나타난다. 고순도 게르마늄(HPGe) 검출기의 모양과 치수는 CT 스캔을 통해 몬테카롤롤 시뮬레이션을 위해 형상을 정확하게 형상화하였다. 이 결과 불감층 두께 증가 가 효율 감소과정에 미치는 영향을 연구하고자 한다. 불감층의 조정은 50 – 1500 keV의 에너지 범위에서 측정 효율과 시뮬레이션 효율 사이의 ± 3%의 상대편차와 함께 좋은 일치임을 확인하였다. 불감층 두께에 변화를 주어 시뮬레이션 데이터를 비교하였다. 몬테카롤로 시뮬레이션 결과를 실험 결과와 비교하여 새로 운 불감층 두꼐를 얻었다. 1.4와 1.6 mm 두께의 End Cap 시뮬레이션 모델에서 1.5mm 두께의 End Cap시뮬 레이션 모델에 대한 불감층 두꼐 결과의 차이는 End Cap 치수의 정확성으로 인한 체계적인 오류였다. 통계 적 오류와 체계적 오류를 고려한 후, 검출기의 불감충 두께는 1.02±0.14 mm로 도출되었다. 따라서 불감층 두께의 증가는 효율성 감소에 영향을 미치는 것을 확인하였다.
중심단어: 불감층, 고순도 게르마늄 검출기, PENELOPE, 점선원
성명 소속 직위
(제1저자) 장은성 고신대학교 복음병원 방사선종양학과 방사선사
(교신) 이효영 동의대학교 방사선학과 교수
연구자 정보 이력