Original Article
Dosimetric Effects of Low Dose 4D CT Using a
Commercial Iterative Reconstruction on Dose Calculation in Radiation Treatment Planning: A Phantom Study
Hee Jung Kim, Sung Yong Park, Young Hee Park, Ah Ram Chang
Department of Radiation Oncology, Soonchunhyang University Hospital, Seoul, Korea
Copyright © 2017 Korean Society of Medical Physics
CCThis is an Open-Access article distributed under the terms of the Creative Commons Attribution Non-Commercial License (http://creativecommons.org/licenses/by- nc/4.0) which permits unrestricted non-commercial use, distribution, and reproduction in any medium, provided the original work is properly cited.
Introduction
In recent years, many studies considering the respiratory motion during radiation treatment has been published.1-3) Since the normal breathing can cause the motion artifact when scanning the simulation CT and patients are hard to maintain a stable breath-hold, the most effective method is to generate the CT volume images for the entire respiratory cycle of free-breathing. The most common method is referred to as 4-dimensional CT (4D CT) that is correlated to the respiratory signal acquiring by the external surrogate such as Varian Real-time Position ManagementTM (RPM) system (Varian Medical Systems Inc, Palo Alto, CA, USA) or Philips Bellows belt system (Philips Medical Systems,
Cleveland, OH, USA). The 4D CT is based on a very slow scanning and retrospectively the acquired data is binned for each phase. Due to this acquisition process of 4D CT, the use of higher CT imaging dose or CT dose is necessary than the conventional CT.4-7)
To adhere to ALARA (as low as reasonably achievable) principle in CT imaging, several novel reconstruction algorithms have been introduced in order to reduce the dose from CT scanning and to improve the image quality.8-10) As one of them, Philips provides a 4th gene ration iterative reconstruction algorithm, iDose (Philips Medical Systems, Cleveland, OH, USA).11-13) Although the image contrast increment by using the retrospective reconstruction algorithm is beneficial for a diagnostic CT, the verification
Progress in Medical Physics 28(1), March 2017 https://doi.org/10.14316/pmp.2017.28.1.27 pISSN 2508-4445, eISSN 2508-4453
We investigated the effect of a commercial iterative reconstruction technique (iDose, Philips) on the image quality and the dose calculation for the treatment plan. Using the electron density phantom, the 3D CT images with five different protocols (50, 100, 200, 350 and 400 mAs) were obtained. Additionally, the acquired data was reconstructed using the iDose with level 5. A lung phantom was used to acquire the 4D CT with the default protocol as a reference and the low dose (one third of the default protocol) 4D CT using the iDose for the spine and lung plans. When applying the iDose at the same mAs, the mean HU value was changed up to 85 HU. Although the 1 SD was increased with reducing the CT dose, it was decreased up to 4 HU due to the use of iDose. When using the low dose 4D CT with iDose, the dose change relative to the reference was less than 0.5% for the target and OARs in the spine plan. It was also less than 1.1% in the lung plan. Therefore, our results suggests that this dose reduction technique is applicable to the 4D CT image acquisition for the radiation treatment planning.
Keywords: Low dose 4D CT, Iterative reconstruction, Treatment planning, CT dose reduction Received 24 March 2017
Revised 28 March 2017 Accepted 28 March 2017
Corresponding author Ah Ram Chang
([email protected]) Tel: 82-2-709-9412 Fax: 82-2-709-9092
PMP
of the HU changes is required to use for the dose calcula- tion in treatment planning using the correlation table of HU to material density.
The 4D CT has been commonly used for the radiation treatment planning. Thus, the purpose of this study is to quantify the image quality change due to the low dose 4D CT scanning with the commercial iterative reconstruction algorithm using a phantom. The effect on the dose distribution was also evaluated.
Materials and Methods
The CIRS electron density phantom (Computerized Imaging Reference Systems, Inc., Norfolk, VA, USA) with various density materials (e.g., lung 0.2 g/cc, lung 0.5 g/
cc, adipose 0.96 g/cc, breast 0.99 g/cc, muscle 1.06 g/cc, liver 1.07 g/cc, bone 1.16 g/cc, and bone core 1.53 g/cc) and the CIRS Xsight® lung tracking phantom were used. All CT images for this study was acquired by Philips Brilliance Big Bore CT scanner (Philips Medical Systems, Cleveland, OH, USA). The scanner default protocol provided by a manufacturer is the use of 120 kVp and 350 mAs. To compare the HU values depending on the CT imaging dose, five different protocols (50 mAs, 100 mAs, 200 mAs, 350 mAs and 400 mAs) was applied in order to acquire the CT images of the electron density phantom. After that, the iDose with level 5 was applied to the acquired data.
To perform the treatment planning for lung and spine target, the CT images of the lung phantom were acquired using the default 4D CT scan protocol (600 mAs) without applying iDose and the low dose protocol (200 mAs) with applying iDose with level 5. The iDose algorithm was applied retrospectively after CT scanning.
For the spine and lung planning, the Pinnacle v9.6 treatment planning system (Philips Healthcare, Fitchburg, WI, USA) and the 6 MV photon beam were used. The 2-dimensional (2D) parallel-opposite anterior-posterior (AP-PA) plan and the volumetric modulated arc therapy (VMAT) plan were performed for the spine target. The 3-dimensional conformal radiotherapy (3D-CRT) plan and VMAT plan were also performed for the lung target. The prescription dose was 30 Gy in 10 fractions for the spine plans and 60 Gy in 30 fractions for the lung plans.
The maximum, minimum, mean and 1 standard deviation (1 SD) of HU were evaluated and the HU changes on the CT images after applying iDose were calculated. To delineate the region of interests inside the various density materials and to calculate that HUs, the MIM software (MIM Software Inc., Cleveland, OH, USA) was used.
Results
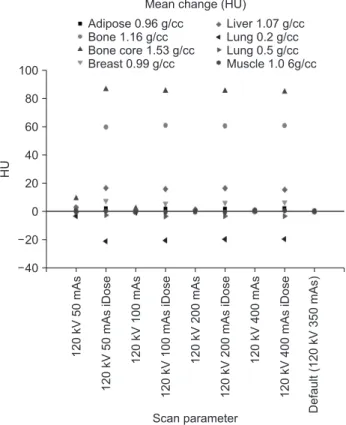
Overall, as the tube current-time product (mAs) increased, the maximum HU was increased and the minimum HU was decreased. As shown in Fig. 1, the mean HU was changed due to the CT dose reduction and the use of iDose. The amount of the change had a range from -21 HU to 87 HU. When using the same current (mAs), the mean change had a range from -20 HU to 85HU. The HU had no change (0 HU) in the muscle 1.06 g/cc, but it had a maximum change (85 HU) in the bone core 1.53 g/cc. In the lowest density material (lung 0.2 g/cc), it showed 19 HU change on average.
Fig. 2 shows that as the CT dose decreases, the 1 SD increased by up to 20 HU but it significantly decreased by
HU
100
80
60
40
20
0
20
40
Scan parameter
120kV50mAs 120kV50mAsiDose 120kV100mAs 120kV100mAsiDose 120kV200mAs 120kV200mAsiDose 120kV400mAs 120kV400mAsiDose Default(120kV350mAs)
Mean change (HU)
Liver 1.07 g/cc Lung 0.2 g/cc Lung 0.5 g/cc Muscle 1.0 6g/cc Adipose 0.96 g/cc
Bone 1.16 g/cc Bone core 1.53 g/cc Breast 0.99 g/cc
Fig. 1. Mean change in HU depending on the CT scan parameter for different density materials relative to the default scan parameter.
up to 4 HU due to the use of iDose (p-value <0.001).
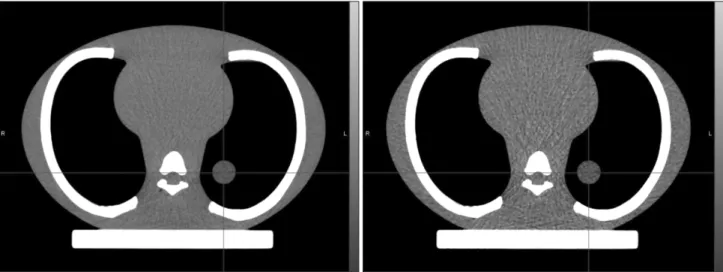
Two 4D CT images of the lung phantom were acquired using the default scan parameter (600 mAs) without iDose and the low dose scan parameter (200 mAs) with iDose
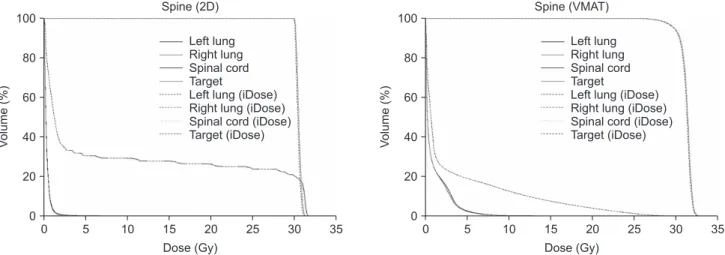
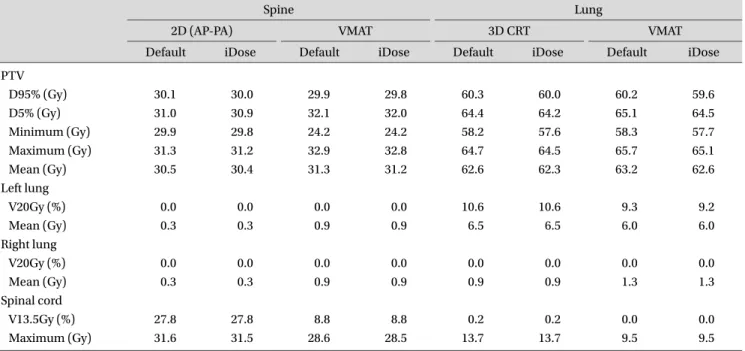
(Fig. 3). The dose-volume histograms (DVHs) are shown in Fig. 4, 5, 6 and 7. Table 1 shows the dose-volumetric parameters from DVHs for PTV and OARs. For the spine 2D and VMAT plan, the maximum dose differences relative to the prescription dose were less than 0.5%. For the lung 3D conformal and VMAT plan, they were less than 1.1%.
Discussion
The CT radiation dose depends on the tube current (mA) and slice scan time and it is proportioned to the tube current-time product (mAs). In the result of this study, the 1 SD referred to as the image noise was increased with decreasing the CT dose. However, the use of a commercial iterative reconstruction algorithm, iDose, changed the HU values. From decreasing the 1 SD, the image noise was improved. This result is similar as the literatures.11-14) Although the HU was increased in the high density material like bone, the dose change in the plans for the spine target was less than 0.5%. For the lung plans considering the low density around the target (known as a heterogeneity), the change due to the iDose was less than 1.1%. The above results demonstrate that by using the iDose the clinically acceptable quality 4D CT images could be obtained even if the CT dose is reduced to one third. Future studies using the patient 4D CT images would be helpful to investigate the optimal tube current-time product that might be changed depending on the CT scanning area of the body.
HU
Scan parameter 25
20
15
10
5
0
5
10
120kV50mAs 120kV50mAsiDose 120kV100mAs 120kV100mAsiDose 120kV200mAs 120kV200mAsiDose 120kV400mAs 120kV400mAsiDose Default(120kV350mAs)
1 Standard deviation change (HU) Liver 1.07 g/cc Lung 0.2 g/cc Lung 0.5 g/cc Muscle 1.06 g/cc Adipose 0.96 g/cc
Bone 1.16 g/cc Bone core 1.53 g/cc Breast 0.99 g/cc
Fig. 2. 1 Standard deviation change in HU depending on the CT scan parameter for different density materials relative to the default scan parameter.
Fig. 3. 4D CT images of the lung phantom acquired using the default scan parameter (600 mAs) without iDose (left) and the low dose scan parameter (200 mAs) with iDose (right).
Although the iDose has a level from 1 to 7, the level 5 of the iDose was used in this study. As the iDose level increases, the strength of noise decreases independent of the CT dose. However, the noise is increased associated with a dose reduction. The net change in noise is determined from a combination of the dose reduction and the iDose level. For that reason, in this study, the one third dose reduction and iDose level of 5 was selected by using the relevant multiplication factor table for the estimation of the net change in noise. Since the image quality related to the noise strength depends on the iDose level, a detailed investigation for the different iDose level would be necessary if the dose is reduced differently comparing to this study ( one third of the default protocol).
In this study, a single CT-to-density table was used for dose calculation on both images with and without iDose.
For example, like pediatric patients, some cases should use the low energy X-ray. In fact, since the attenuation coefficient is dependent on the X-ray energy and the material density, the HU is significantly changed as shown in Fig. 6. The effect of the use of iDose could be different depending on the X-ray energy. In this study, as a simple test, the 90 kVp CT was compared to the default protocol 120 kVp CT. Fig. 6 shows that the mean and 1 SD change in HU due to the use of iDose were increased with decreasing the energy from 120 kVp to 90 kVp. Compared to the default protocol, the HU was changed up to 347 HU depending on the kVp and mAs. It was also changed up to 109 HU due to
0 100
80
60
40
20
Volume(%)
Dose (Gy) Spine (2D)
0
Left lung Right lung Spinal cord Target
Left lung (iDose) Right lung (iDose) Spinal cord (iDose) Target (iDose)
35 30 25 20 15 10
5 0
100
80
60
40
20
Volume(%)
Dose (Gy) Spine (VMAT)
0
Left lung Right lung Spinal cord Target
Left lung (iDose) Right lung (iDose) Spinal cord (iDose) Target (iDose)
35 30 25 20 15 10 5
Fig. 4. DVH comparison between the dose calculations on the CT images reconstructed with and without using iDose for the Spine 2D parallel-opposite (AP-PA) and VMAT plan.
0 100
80
60
40
20
Volume(%)
Dose (Gy) Lung (3D)
0
Left lung Right lung Spinal cord Target
Left lung (iDose) Right lung (iDose) Spinal cord (iDose) Target (iDose)
0 100
80
60
40
20
Volume(%)
Dose (Gy) Lung (VMAT)
0
Left lung Right lung Spinal cord Target
Left lung (iDose) Right lung (iDose) Spinal cord (iDose) Target (iDose)
70 65 60 55 50 45 40 35 30 25 20 15 10
5 5 10 15 20 25 30 35 40 45 50 55 60 65 70
Fig. 5. DVH comparison between the dose calculations on the CT images reconstructed with and without using iDose for the Lung 3D conformal and VMAT plan.
the use of iDose. Thus, when a single CT-to-density table is applied to the dose calculation for the different energy CT scan, the calculated dose can be inaccurate more than the result of this study. After applying the CT-to-density table
depending on the X-ray energy, the optimal tube current- time product when using the iDose should be determined.
HU
Scan parameter
120kV50mAs 120kV50mAsiDose 120kV100mAs 120kV100mAsiDose 120kV200mAs 120kV200mAsiDose 120kV400mAs 120kV400mAsiDose Default(120kV350mAs) Mean (HU)
1,500
1,000
500
0
500
1,000
90kV400mAs
90kV200mAs
90kV100mAs
90kV50mAs 90kV400mAsiDose
90kV200mAsiDose
90kV100mAsiDose
90kV50mAsiDose
Liver 1.07 g/cc Lung 0.2 g/cc Lung 0.5 g/cc Muscle 1.06 g/cc Adipose 0.96 g/cc
Bone 1.16 g/cc Bone core 1.53 g/cc Breast 0.99 g/cc
HU
Scan parameter
120kV50mAs 120kV50mAsiDose 120kV100mAs 120kV100mAsiDose 120kV200mAs 120kV200mAsiDose 120kV400mAs 120kV400mAsiDose Default(120kV350mAs) 1 Standard deviation change (HU)
60
50
40
30
20
10
0
10
90kV400mAs
90kV200mAs
90kV100mAs
90kV50mAs 90kV400mAsiDose
90kV200mAsiDose
90kV100mAsiDose
90kV50mAsiDose
Liver 1.07 g/cc Lung 0.2 g/cc Lung 0.5 g/cc Muscle 1.06 g/cc Adipose 0.96 g/cc
Bone 1.16 g/cc Bone core 1.53 g/cc Breast 0.99 g/cc
Fig. 6. Mean and 1 standard deviation changes in HU when using the x-ray energy of 90 kVp.
Table 1. Dose-volumetric parameters of target (PTV) and normal tissues (left and right lung, spinal cord) for spine and lung plan.
Spine Lung
2D (AP-PA) VMAT 3D CRT VMAT
Default iDose Default iDose Default iDose Default iDose
PTV
D95% (Gy) 30.1 30.0 29.9 29.8 60.3 60.0 60.2 59.6
D5% (Gy) 31.0 30.9 32.1 32.0 64.4 64.2 65.1 64.5
Minimum (Gy) 29.9 29.8 24.2 24.2 58.2 57.6 58.3 57.7
Maximum (Gy) 31.3 31.2 32.9 32.8 64.7 64.5 65.7 65.1
Mean (Gy) 30.5 30.4 31.3 31.2 62.6 62.3 63.2 62.6
Left lung
V20Gy (%) 0.0 0.0 0.0 0.0 10.6 10.6 9.3 9.2
Mean (Gy) 0.3 0.3 0.9 0.9 6.5 6.5 6.0 6.0
Right lung
V20Gy (%) 0.0 0.0 0.0 0.0 0.0 0.0 0.0 0.0
Mean (Gy) 0.3 0.3 0.9 0.9 0.9 0.9 1.3 1.3
Spinal cord
V13.5Gy (%) 27.8 27.8 8.8 8.8 0.2 0.2 0.0 0.0
Maximum (Gy) 31.6 31.5 28.6 28.5 13.7 13.7 9.5 9.5
Conclusion
In this study, the HU change and the dosimetric change on the 4D CT due to the use of the commercial iterative reconstruction algorithm (iDose) were analyzed. Although, in general, the 4D CT needs the radiation exposure much more than 3D CT, the iDose could reduce the imaging dose less than the conventional 3D CT dose with the default protocol, preserving the image quality. The effect of HU change due to the use of the iDose for the low dose 4D CT on the dose calculation was clinically acceptable.
Conflicts of Interest
The authors have nothing to disclose.
Availability of Data and Materials
All relevant data are within the paper and its supporting information files.
References
1. Balter JM, Ten Haken RK, Lawrence TS, Lam KL, and Robertson JM. Uncertainties in CT-based radiation therapy treatment planning associated with patient breathing. Int J Radiat Oncol Biol Phys. 1996;36:167-174.
2. Keall PJ, Starkschall G, Shukla H, Forster KM, Ortiz V, Stevens CW, et al. Acquiring 4D thoracic CT scans using a multislice helical method. Phys Med Biol. 2004;49:2053- 2067.
3. Ohara K, Okumura T, Akisada M, Inada T, Mori T, Yokota H, et al. Irradiation synchronized with respiration gate. Int J Radiat Oncol Biol Phys. 1989;17:853-857.
4. Hubbard P, Callahan J, Cramb J, Budd R, and Kron T.
Audit of radiation dose delivered in time-resolved four- dimensional computed tomography in a radiotherapy department. J Med Imaging Radiat Oncol. 2015;59:346- 352.
5. Low DA, Nystrom M, Kalinin E, Parikh P, Dempsey JF,
Bradley JD, et al. A method for the reconstruction of four- dimensional synchronized CT scans acquired during free breathing. Med Phys. 2003;30:1254-1263.
6. Matsuzaki Y, Fujii K, Kumagai M, Tsuruoka I, and Mori S.
Effective and organ doses using helical 4DCT for thoracic and abdominal therapies. J Radiat Res. 2013;54:962-970.
7. Mori S, Ko S, Ishii T, and Nishizawa K. Effective doses in four-dimensional computed tomography for lung radiotherapy planning. Med Dosim. 2009;34:87-90.
8. Hara AK, Paden RG, Silva AC, Kujak JL, Lawder HJ, and Pavlicek W. Iterative reconstruction technique for reducing body radiation dose at CT: feasibility study. AJR Am J Roentgenol. 2009;193:764-771.
9. Kim Y, Kim YK, Lee BE, Lee SJ, Ryu YJ, Lee JH, et al. Ultra- low-dose CT of the thorax using iterative reconstruction:
evaluation of image quality and radiation dose reduction.
American Journal of Roentgenology. 2015;204:1197-1202.
10. Raman SP, Johnson PT, Deshmukh S, Mahesh M, Grant KL, and Fishman EK. CT dose reduction applications:
available tools on the latest generation of CT scanners.
Journal of the American College of Radiology. 2013;10:37- 41.
11. Arapakis I, Efstathopoulos E, Tsitsia V, Kordolaimi S, Economopoulos N, Argentos S, et al. Using “iDose4”
iterative reconstruction algorithm in adults' chest–
abdomen–pelvis CT examinations: effect on image quality in relation to patient radiation exposure. The British journal of radiology. 2014;87:20130613.
12. Mehta D, Thompson R, Morton T, Dhanantwari A, and Shefer E. Iterative model reconstruction: simultaneously lowered computed tomog raphy radiat ion dose and improved image quality. Med Phys Int J. 2013;2:147-155.
13. Olsson M-L, and Norrgren K, An investigation of the iterative reconstruction method iDose4 on a Philips CT Brilliance 64 using a Catphan 600 phantom. SPIE Medical Imaging. 2012. 831348.
14. Li H, Lee D, Low D, Gay H, Michalski J, and Mutic S. SU- E-J-167: Iterative Reconstruction Techniques for Radiation Therapy CT Simulations: A Phantom Study. Medical Physics. 2013;40:189-189.