Early screening programs for lung cancer using com- puted tomography (CT) are widespread. In low dose screening CT, too many small nodules are detected, and
the only accurate method of differentiating lung cancer from other benign nodules is tissue biopsy. However, this method is invasive and is difficult to perform in the case of small lung nodules of less than 1 cm in diameter.
Measurement of the volume doubling time (VDT) of the nodule on serial CT plays a helpful role in differentiat- ing growing tumors from stable benign lesions (1).
In most lung cancer screening techniques involving CT, a low dose protocol is used. If the scan parameters - tube amplitude, tube current, scan thickness, table mov- ing pitch - are susceptible to affect the measured volume
Measurement error of spiral CT Volumetry:
Influence of Low Dose CT Technique
1Tae Gyu Lee, M.D.2, Myung Jin Chung, M.D., Sung Bum Cho, M.D.2, Jae Min Cho, M.D., Seog Joon Kim, M.D.2, Sang Hyun Baik, M.D.2
1Department of Radiology and Center for Imaging Science, Sungkyunkwan University School of Medicine, Samsung Medical Center
2Department of Radiology, Eulji University Eulji General Hospital This work was supported by Korea Research Foundation Grant. (KRF- 2001-003-F00161)
Received May 11, 2004 ; Accepted May 30, 2004
Address reprint requests to : Myung Jin Chung, M.D., Department of Radiology, Samsung Medical Center, 50, Ilwon-dong, Kangnam-gu, Seoul 135-710, Korea.
Tel. 82-2-3410-2519 Fax. 82-2-3410-2559
Purpose: To examine the possible measurement errors of lung nodule volumetry at the various scan parameters by using a small nodule phantom.
Materials and Methods: We obtained images of a nodule phantom using a spiral CT scanner. The nodule phantom was made of paraffin and urethane and its real volume was known. For the CT scanning experiments, we used three different values for both the pitch of the table feed, i.e. 1:1, 1:15 and 1:2, and the tube current, i.e. 40 mA, 80 mA and 120 mA. All of the images acquired through CT scanning were reconstructed three dimensionally and measured with volumetry software. We tested the correlation between the true volume and the measured volume for each set of parameters using linear regression analysis.
Results: For the pitches of table feed of 1:1, 1:1.5 and 1:2, the mean relative errors were 23.3%, 22.8% and 22.6%, respectively. There were perfect correlations among the three sets of measurements (Pearson’s coefficient = 1.000, p < 0.001). For the tube currents of 40 mA, 80 mA and 120 mA, the mean relative errors were 22.6%, 22.6% and 22.9%, respectively. There were perfect correlations among them (Pearson’s coefficient = 1.000, p < 0.001).
Conclusion: In the measurement of the volume of the lung nodule using spiral CT, the measurement error was not increased in spite of the tube current being decreased or the pitch of table feed being increased.
Index words :Lung, nodule
Computed tomography (CT), helical
Computed tomography (CT), experimental studies
of the nodule, (they must be precisely set/the influence of these parameters must be accurately known?), in or- der to obtain accurate measurements of the VDT.
Therefore, we designed this study in order to examine the possible measurement error of lung nodule volume- try for the various scan parameters using a small nodule phantom.
Materials and Methods
Lung nodule phantom
We fabricated artificial small nodules using paraffin wax, because it is soft and easy to mold. However, be- cause pure paraffin shows a CT attenuation of -200 - -150 Hounsfield Units (HUs), we adjusted the CT at- tenuation of the paraffin to that of soft tissue (17-65 HU, mean 34 HU) by mixing it with a small amount of oily CT contrast material (Lipiodol, Guerbet, France).
Small nodules with a diameter of 5-10-mm were made by hand using the prepared paraffin-Lipiodol mixture.
Because we did not have an apparatus which was sensi- tive enough to measure small nodules with a volume of less than 1 ml, we used an indirect method. First, we made large blocks of paraffin-Lipiodol mixture, each with a length of 10-cm. Next, we measured the precise volume and weight of each block. From these measure- ments, we were able to calculate the specific gravity of the mixture (0.92 g/cm3). In this way, we were able to determine the precise volume of each nodule, by weigh- ing it on an electronic scale and then dividing the weight by the specific gravity.
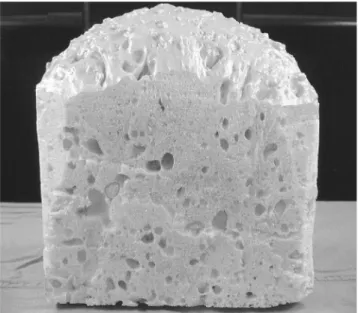
To imitate the lung nodule around the pulmonary vas- culature, we stuck the tip of a toothpick into the nodule (Fig. 1). The true volume of the nodules varied from 496 mm3to 4747 mm3 and the mean value was 1488±967 mm3.
We made the supporting structure of urethane foam.
The CT attenuation of the urethane foam was very low (about -1000 HU) and similar to that of aerated lung parenchyma, in spite of its having sufficient bearing power. We placed twenty nodules in a box filled with urethane foam and then hardened the foam.
CT scanning
A volume spiral scan and continuous thin section re- construction are needed for CT volumetry. The CT scanning of the phantom was performed with a single detector spiral CT (Hi-Speed Advantage; GE Medical Systems, Milwaukee, U.S.A.). The CT scans were ob-
tained using fixed parameters consisting of a 3-mm beam collimation, 1-second gantry rotation time, 120 kV tube amplitude, 200-mm field of view (FOV), and 512 by 512 matrixes. Scans were performed using three tube current values,120-mAs, 80-mAs and 40-mAs, with a fixed table pitch of 1:2, and with three table pitch val- ues, 1:1, 1:1.5 and 1:2 with a fixed tube current of 80- mAs. Two-dimensional images, with a 3-mm thickness and 33% Z-axis overlap, were reconstructed from the raw data of each scan using a high spatial frequency re- construction algorithm.
Reconstruction of three-dimensional image and volume measurement
From the root axial images, three-dimensional volume rendering images were generated using commercial per- sonal computer based software (Rapidia v2.0; Infinitt Co., Seoul, Korea) (Fig. 2).
We produced a preliminary version of volume mea- suring software and installed it in Rapidia program.
Using the erode & dilate method, this program could re- move the attached vessel and measure the discrete vol- ume of the selected nodule automatically (Fig. 3).
Nodule segmentation in this program was based on the continuous pixel threshold method (2). Therefore, we could set the low threshold used for nodule segmen- tation before measuring the volume. However, the mea- sured volume of the nodule is known to vary according to the threshold value (3), and a threshold from -400
Fig. 1. Exterior view of the lung nodule phantom. The support- ing structure is made of urethane foam and the artificial nod- ules are contained within it.
HU to -600 HU is recommended for lung volumetry (4). Thus, we tested the measurement accuracy under three conditions (low thresholds of -300 HU, -500 HU and -700 HU).
From the results of these measurements, the relative errors were calculated by means of the following equa- tion:
Relative error=(measured volume-true volume) / true volume×100 (%)
We tested the correlation between the measured vol- ume and true volume and that between the different
sets of measured volumes using linear regression analy- sis.
Results
Measurement error induced by varying the selection threshold
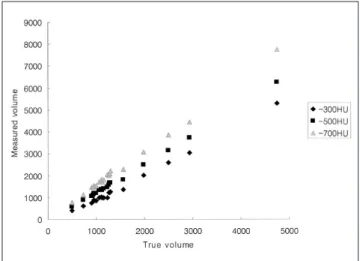
As a baseline study, we used one scan set (tube ampli- tude, 120-kVp; tube current, 80-mAs; 1:1 pitch of table feed) for the test of measurement accuracy for the three different threshold values. The relationships between the true volume and the measured volume when vary- ing the selection threshold of CT attenuation between the three values of -300 HU, -500 HU and -700 HU, are illustrated in Fig. 4. Their root data and the results of the linear regression analysis are summarized in Table 1 and Table 2.
At the threshold of -300 HU, the measured nodule volumes tended to be smaller than the true volumes, ex- cept in the case of large nodules with a volume of more than 2000 mm3. The relative errors varied from 2.7% to 14.6% and showed a mean value of 6.5±3.9%. The Pearson’s correlation coefficient was 0.998 (p < 0.001).
At the threshold of -500 HU, the measured nodule vol- umes were consistently bigger than the true volumes.
The relative errors varied from 16.3 to 31.8% and showed a mean value of 23.7 ± 4.5 %. The Pearson’s correlation coefficient was 0.999 (p < 0.001). At the threshold of -700 HU, the measured nodule volumes were consistently bigger than the true values. The rela- tive error was as much as 53.3±5.1%. The Pearson’s Fig. 2. Three-dimensional volume image of lung nodule phan-
tom. The supporting structure made of urethane foam shows a very low attenuation, similar to that of lung parenchyma, and was made to vanish by narrowing the threshold range of the volume rendering method. Note the multiple nodules with lin- ear tails.
Fig. 3. Automatic measurement of nodule volume by volume- try software. The targeted nodule is segmented automatically and painted with a dark color (arrow). Note the expressed vol- ume above the targeted nodule.
Fig. 4. Concordance of volume measurement between the three sets by attenuation thresholds. The numerical values are in units of mm3.
correlation coefficient was 0.999 (p < 0.001).
The mean value of the relative error was smallest at the threshold of -300 HU. However, the standard error for the estimation was smallest at the threshold of -500 HU.
Measurement error induced by varying the pitch of the table feed
Based on the above result, the following measure- ments were made with a selection threshold of -500 HU. The relationships between the true volume and the measured volume for the three table pitch values of 1:1, 1:1.5 and 1:2 are illustrated in Fig. 5. The results of the linear regression analysis are summarized in Table 3.
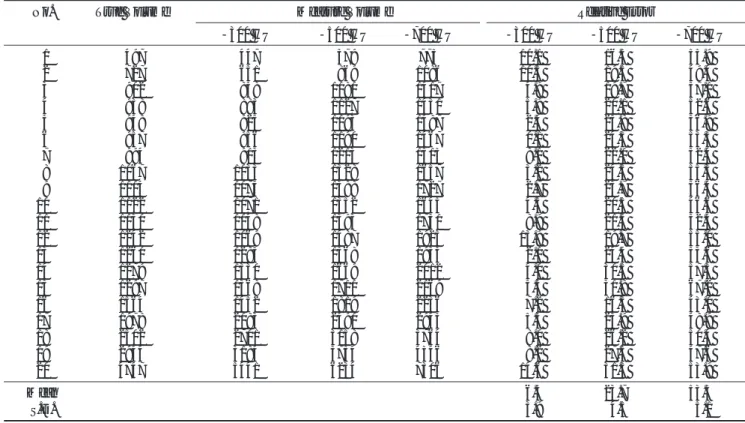
Table 1. The Change of Measured Volume when Varying the Selection Threshold of CT Attenuation (tube amplitude, 120kVp; tube cur- rent, 80mAs; 1:1 pitch of table feed).
No. True Volume Measure Volume Relative Error
-300 HU -500 HU -700 HU -300 HU -500 HU -700 HU
01 0497 0447 0579 775 10.1 16.5 55.9
02 0727 0651 0869 1086 10.5 19.5 49.4
03 0902 0858 1080 1417 04.9 19.7 57.1
04 0938 0883 1127 1431 05.9 20.1 52.6
05 0948 0925 1193 1487 02.4 25.8 56.9
06 0957 0956 1190 1467 00.1 24.3 53.3
07 0994 0913 1213 1515 08.1 22.0 52.4
08 1067 1033 1328 1657 03.2 24.5 55.3
09 1104 1074 1388 1727 02.7 25.7 56.4
10 1122 1071 1352 1645 04.5 20.5 46.6
11 1150 1048 1395 1751 08.9 21.3 52.3
12 1242 1069 1487 1925 13.9 19.7 55.0
13 1260 1285 1568 1935 02.0 24.4 53.6
14 1279 1330 1669 2012 04.0 30.5 57.3
15 1297 1368 1710 2169 05.5 31.8 67.2
16 1564 1452 1819 2236 07.2 16.3 43.0
17 1978 2083 2490 2945 05.3 25.9 48.9
18 2502 2701 3158 3764 08.0 26.2 50.4
19 2944 3184 3754 4346 08.2 27.5 47.6
20 4747 5441 6234 7306 14.6 31.3 53.9
Mean 06.5 23.7 53.3
S.D. 03.9 04.5 05.1
Abbreviations - S.D: Standard deviation, HU: Hounsfield unit
Fig. 5. Concordance between the volume measurement for the three sets of data obtained by varying the pitch of table feed.
The units of the numerical values are mm3.
Fig. 6. Concordance between the volume measurement for the three sets of data obtained by varying the tube current. The units of the numerical values are mm3.
The mean values of the relative error in measuring the nodule volume were 23.3%, 22.8% and 22.6% for the pitches of 1:1, 1:1.5 and 1:2, respectively. The results were similar for all settings, showing a high correlation (Pearson’s correlation coefficient=0.998, p < 0.001).
The standard error in the linear regression analysis was smallest with a pitch of 1:1.5 (E=35.42). The correla- tions between the three sets were all perfect (Pearson’s correlation coefficient=1.000, p < 0.001).
Measurement error induced by varying the tube current The relationships between the true volume and the measured volume for the three values of the tube cur- rent, 40-mAs, 80-mAs and 120-mAs, are illustrated in Fig. 6. The results of the linear regression analysis are summarized in Table 4.
The mean values of the relative error in measuring the nodule volume were 22.6%, 22.6% and 22.9% for the tube current values of 40-mAs, 80-mAs and 120-mAs, respectively. The results were similar in all settings, showing a high correlation (Pearson’s correlation coeffi- cient=0.998, p < 0.001). The standard error in the lin- ear regression analysis was smallest with a current of 120-mAs (E=35.36). The correlations between the three sets were all perfect (Pearson’s correlation coefficient=
1.000, p < 0.001).
Discussion
Many researchers have studied early screening pro- grams for lung cancer using CT, in order to evaluate its usefulness and determine the ideal protocol to use (5, 6).
Despite the denials made by some investigators con- cerning the clinical benefits of lung cancer screening CT (7), its usage is quite frequent because no alternative screening program has yet been introduced.
Henschke, et al. (8) reported that lung nodules were found in 23% of the asymptomatic group of subjects on CT examination. If a small nodule is detected on low dose screening CT and the nodule is too small for transthoracic needle biopsy, the possible choices for the clinician are close observation or open lung biopsy.
However, most nodules detected by screening CT are benign (9). Especially in Korea, the higher prevalence of tuberculosis has meant that physicians were presented with many active or inactive granulomas in the lung.
Thus, invasive studies should be limited, in spite of the difficulty in differentiating early lung cancer from be- nign nodules using screening CT. For accurate and sen- sitive follow up, the measurement of VDT on serial CT Table 2. Correlations between True Values and Measured Values for different values of the Selection Threshold of CT Attenuation
Pearson Correlation Adjusted R square Std. Error for estimation Significance
True value vs. -300 HU 0.998 0.996 60.8 < 0.001
True value vs. -500 HU 0.999 0.998 41.4 < 0.001
True value vs. -700 HU 0.999 0.997 50.5 < 0.001
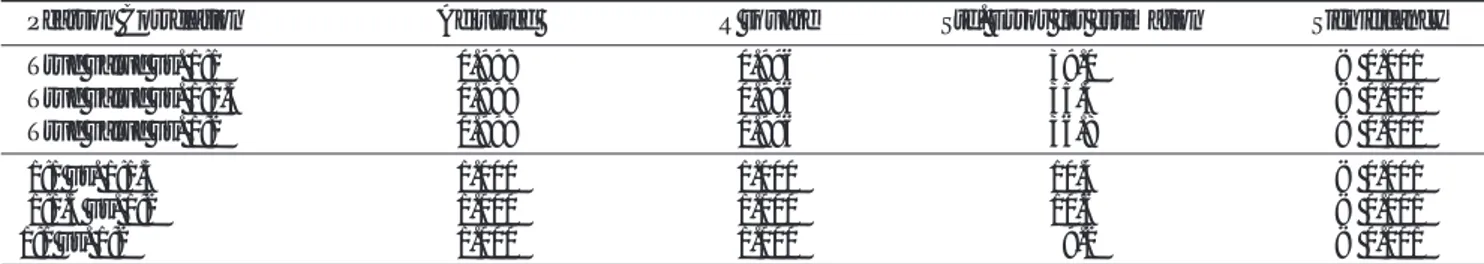
Table 3. Correlations between True Volumes and Three Sets of Measured Volumes for different values of the Pitch of Table Feed Pearson Correlation Adjusted R square Std. Error for estimation Significancy
True value vs. 1:1 0.998 0.996 39.0 < 0.001
True value vs. 1:1.5 0.998 0.996 35.4 < 0.001
True value vs. 1:2 0.998 0.996 36.8 < 0.001
1:1 vs. 1:1.5 1.000 1.000 10.4 < 0.001
1:1.5 vs. 1:2 1.000 1.000 10.6 < 0.001
1:1 vs. 1:2 1.000 1.000 09.2 < 0.001
Table 4. Correlations between True Values and Measured Values for different values of the Tube Current
Pearson Correlation Adjusted R square Std. Error for estimation Significance
True value vs. 40 mAs 0.998 0.996 36.4 < 0.001
True value vs. 80 mAs 0.998 0.996 36.8 < 0.001
True value vs. 120 mAs 0.998 0.996 35.4 < 0.001
40 mAs vs. 80 mAs 1.000 1.000 06.2 < 0.001
80 mAs vs. 120 mAs 1.000 1.000 06.6 < 0.001
40 mAs vs. 120 mAs 1.000 1.000 04.2 < 0.001
can play a helpful role in diagnosing a growing tumor.
Hasegawa et al observed small lung cancers using the screening CT program and obtained VDTs of 52 days to 1733 days (mean 452±381 days) (1). Tumor growth is expected to occur on the basis of an exponential model (10). Therefore, if the follow up CT scan is performed within a six months interval, the nodule should exhibit a less than 10 % change in volume on the follow up CT for sensitive cancer screening. By using multidetector CT (MDCT), the entire lung volume can be scanned with 1-1.5 mm thin sections during a single breath hold and, consequently, this technique is now recommended as the standard for low dose lung cancer screening pro- grams (11). If thin section MDCT is performed as a low dose technique, lung nodule volumetry can be done without additional volume scanning. Normally, the im- age noise is increased and the image contrast decreased when using a lower tube current and a higher table pitch (12) and, consequently, the measurement error is likely to be increased. Therefore, the use of a high-dose technique with thin section images was recommended, in order to obtain accurate lung nodule volumetry.
However, the higher radiation exposure induced by high-dose thin section spiral CT is not recommended for cancer screening programs involving repetitive CT ex- aminations. A study of the image deterioration caused by using low dose CT was published by Hong, et al (13).
They reported that the coronary arterial calcium score and calcium volume were not changed, in spite of the tube current being decreased. In line with their result, the measurement error in our study was not changed when the tube current was varied or when the table movement pitch was increased. However, this result was different from that of Ko et al (12). This difference may have been caused by the different nodule sizes of the two studies and the presence of semisolid nodules.
The nodules used in the study of Ko et al. were less than 5 mm in diameter and 61 mm3in volume. The smallest nodule in our study was 8 mm in diameter and 497mm3 in volume. In spite of the fact that no significant differ- ence in volume was found between the real volumes and those measured using the low dose technique in this study, measurement errors may occur in small nodules of less than 5 mm in diameter. Therefore, we assert that CT volumetry of small lung nodules with the low dose CT technique is no less accurate than that using the con- ventional high dose technique, as long as the size of the nodule is greater than 0.5 ml.
The measured nodule volumes were somewhat differ-
ent from the true volumes in our study. Though the mean results obtained with a threshold of -300 HU (rel- ative error=6.5±3.9%) were the closest to the true val- ues, and the mean results obtained with a threshold of - 500 HU (relative error=23.7±4.5%) were bigger than those obtained with a threshold of -300 HU and were farther from the true values, the smallest correlation co- efficient was obtained with the threshold of -500 HU.
We suggest that good correlativity is more important than the absolute error, when attempting to detect and compare the difference in volume during serial follow- up.
In conclusion, we were able to confirm that the mea- surement error was not increased, in spite of the tube current being decreased and the table movement pitch being increased. Therefore, the volume measurement of lung nodules using low dose screening CT data consti- tutes an acceptable method of following up patients with small nonspecific lung nodules.
References
1. Hasegawa M, Sone S, Takashima S, et al. Growth rate of small lung cancers detected on mass CT screening. Br J Radiol 2000;73:
1252-1259
2. Hedlund LW, Anderson RF, Goulding PL, Beck JW, Effman EL, Putman CE. Two methods for isolating the lung area of a CT scan for density information. Radiology 1982;144:353-357
3. Lee HJ, Han JK. A study of parameters in spiral CT volumetry us- ing balloon phantoms. J Korean Radiol Soc 2001;45:221-228 4. Kemerink GJ, Lamers RJ, Pellis BJ, Kruize HH, van Engelshoven
JM. On segmentation of lung parenchyma in quantitative comput- ed tomography of the lung. Med Phys 1998;25:2432-2439
5. Diederich S, Wormanns D, Heindel W. Lung cancer screening with low-dose CT. Eur J Radiol 2003;45:2-7
6. Garg K, Keith RL, Byers T, et al. Randomized controlled trial with low-dose spiral CT for lung cancer screening: feasibility study and preliminary results. Radiology 2002;225: 506-510
7. Mahadevia PJ, Fleisher LA, Frick KD, Eng J, Goodman SN, Powe NR. Lung cancer screening with helical computed tomography in older adult smokers: a decision and cost-effectiveness analysis. JA- MA 2003;289:313-322
8. Henschke CI, McCauley DI, Yankelevitz DF, et al. Early lung can- cer action project: overall design and findings from baseline screening. Lancet 1999;354:99-105
9. Swensen SJ. CT screening for lung cancer. AJR Am J Roentgenol 2002;179:833-836
10. Usuda K, Saito Y, Sagawa M, et al. Tumor doubling time and prog- nostic assessment of patients with primary lung cancer. Cancer 1994;74:2239-2244
11. Henschke CI, Yankelevitz DF, McCauley DI, Libby DM, Pasmantier MW, Smith JP. Guidelines for the use of spiral com- puted tomography in screening for lung cancer. Eur Respir J Suppl 2003;39:45s-51s
12. Ko JP, Rusinek H, Jacobs EL, et al. Small pulmonary nodules: vol- ume measurement at chest CT-phantom study. Radiology
2003;228:864-870
13. Hong C, Bae KT, Pilgram TK, Suh J, Bradley D. Coronary artery
calcium measurement with multi-detector row CT: in vitro assess- ment of effect of radiation dose. Radiology 2002;225:901-906
대한영상의학회지 2004;51:69-75
나선식 CT 부피측정기의 측정오차: 저선량 CT의 영향1
1성균관대학교 삼성서울병원 영상의학과
2을지의과대학교 을지병원 진단방사선과
이태규2・정명진・조성범2・조재민・김석준2・백상현2
목적: 소폐결절의 악성도 평가를 위한 성정 속도 계산시 저선량 CT를 이용한 측정의 정확성을 평가하고자 하였 다.
대상과 방법: 파라핀과 우레탄 폼을 이용하여 실제 부피를 알고 있는 결절들의 모형을 제작한 후 나선식 CT로 스 캔하여 결절의 영상을 얻었다. 스캔시 테이블의 이동속도를 1:1, 1:1.5, 1:2로 증가시켜 보았고, 관전류를 120 mAs, 80 mAs, 40 mAs로 줄여 보았다. 이 영상들을 3차원적으로 재구성한 후 부피 측정 소프트웨어(Rapidia, Infinitt, Seoul, Korea)를 이용하여 측정한 부피와 실제 부피간의, 그리고 각 조건 별로 측정한 부피 간의 일치도를 비교 하였다.
결과: 테이블 이동속도를 1:1, 1:1.5, 1:2로 증가시켰을 때 실제부피와의 평균 상대오차는 23.3%, 22.8%, 22.6%
로 유의한 차이가 없었다. 세 조건에서의 측정부피간에는 완벽한 일치를 나타내었다(Pearson’s coefficient = 1.000, p<0.001). 관전류를 40 mAs, 80 mAs, 120 mAs로 증가시켰을 때 평균 상대오차는 22.6%, 22.6%, 22.9%로 역 시 차이가 없었으며 세 측정부피간에 완벽한 일치를 나타내었다(Pearson’s coefficient = 1.000, p<0.001).
결론: CT 스캔 시 적용한 선량의 상당한 감소와 테이블 이동 속도의 증가에도 불구하고 측정 오차는 유의하게 증 가하지 않았다. 따라서 폐암 검진을 위한 CT 스크리닝 검사 시 저선량 CT로 직접 소폐결절의 추적 부피 측정을 하여도 무방할 것이다.