Introduction
The posterior root of the medial meniscus (MM) can serve as an anchor to the bone for the meniscus; it prevents excessive loading and tensile stress during knee motion and load bearing
1). Medial meniscus posterior root tear (MMPRT) is defined either as a complete radial tear that is located within 9 mm of the MM
posterior insertion or bony avulsions of the root attachment
2,3). MMPRT can occur especially in middleaged or older female patients after a single episode of a popping sensation during light daily activities, such as squatting and going up or down stairs
4). MMPRT effectively results in increased intraarticular pressure on the medial compartment of the knee during joint loading, which ultimately can lead to the development of arthritis
5).
MM extrusion (MME) is a frequent finding on magnetic reso
nance imaging (MRI) in patients with an MMPRT. MME is the result of considerable disruption of the circumferential collagen fibers, which causes the loss of ability to resist hoop strain
6). MME is also associated with femorotibial joint space narrowing
7), severity of osteoarthritis (OA) as reflected by the radiographic Kellgren–Lawrence grade
8,9), and degenerative joint disease
10). MME of ≥3 mm is considered abnormal pathologic extrusion correlated with the severity of chondral lesions in the medial compartment
11). Furumatsu et al.
12)found that MME increased
TimeDependent Increase in Medial Meniscus
Extrusion after Medial Meniscus Posterior Root Tear Analyzed by Using Magnetic Resonance Imaging
Yoshiki Okazaki, MD, Takayuki Furumatsu, MD, PhD, Yasunori Shimamura, MD, PhD, Kenta Saiga, MD, PhD, Hideki Ohashi, MD, Takahiko Uchino, MD, Yusuke Kamatsuki, MD, Yuki Okazaki, MD, and
Toshifumi Ozaki, MD, PhD
Department of Orthopaedic Surgery, Okayama University Graduate School, Okayama, Japan
Purpose: Medial meniscus posterior root tear (MMPRT) causes progression of medial meniscus extrusion (MME). This study aims to calculate the progression rate of MME based on findings in two preoperative magnetic resonance imaging (MRI) scans and determine the associated factors.
Materials and Methods: We retrospectively reviewed 33 patients (27 females and 6 males; mean age, 60 years) who underwent MRI twice, at a mean interval of 48 days. We measured the medial meniscus body width, medial joint space width (MJSW), and MME. The MME progression rate was derived from regression analysis of the increase in MME (ΔMME) between the two MRI scans. In addition, the correlations of the MME increase rate with age, body mass index, femorotibial angle, and MJSW were evaluated.
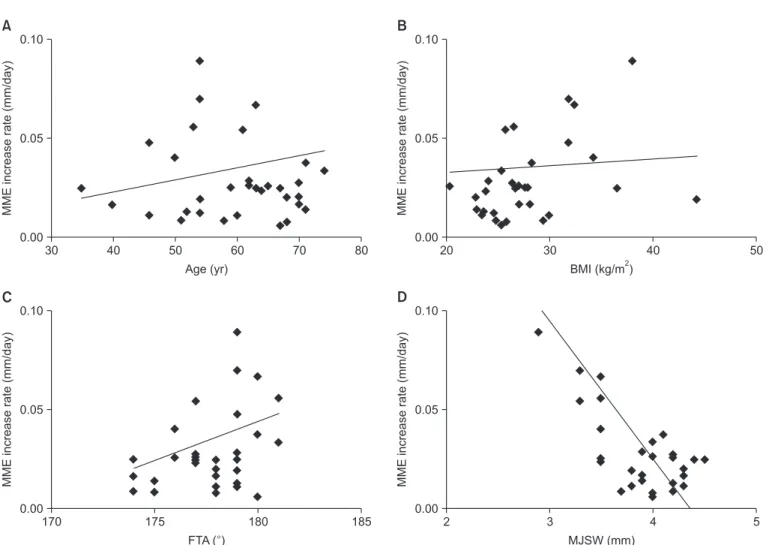
Results: The mean MME increased from 3.4 mm to 4.5 mm (p<0.001). A good correlation was observed between ΔMME and the interval of MRI scans (R2=0.621), and the MME progression rate was 0.020 mm per day. A moderate correlation was observed between the MME increase rate and the MJSW (R2=0.432).
Conclusions: The MME progression rate was rapid in MMPRT and narrowing of the MJSW was associated with the progression of MME.
Level of Evidence: V, Crosssectional study
Keywords: Medial meniscus, Root tear, Extrusion, Magnetic resonance imaging, Risk factors pISSN 2234-0726 · eISSN 2234-2451
Knee Surgery & Related Research
Received September 21, 2018; Revised January 1, 2019;
Accepted February 7, 2019
Correspondence to: Takayuki Furumatsu, MD, PhD
Department of Orthopaedic Surgery, Okayama University Graduate School, 251 Shikatacho, Kitaku, Okayama 7008558, Japan Tel: +81862357273, Fax: +81862239727
Email: [email protected]u.ac.jp
120
This is an Open Access article distributed under the terms of the Creative Commons Attribution NonCommercial License (http://creativecommons.org/licenses/bync/4.0/) which permits unrestricted noncommercial use, distribution, and reproduction in any medium, provided the original work is properly cited.
Copyright © 2019 KOREAN KNEE SOCIETY
www.jksrr.org
progressively within 12 months after the onset of symptomatic MMPRT. They also reported that the extent of MME was corre
lated with the duration of a symptomatic MMPRT after a painful popping event and a good correlation was observed between the MME measurement and the duration from injury to MRI exami
nation
13). However, these studies were not longitudinal studies based on serial MRI examinations of the same patients. There
fore, the understanding of the timedependent increase of MME in the same patient remains unclear.
To the best of our knowledge, this is the first study to analyze the MME increase in MMPRT patients who underwent MRI twice before surgery. We aimed to investigate the correlation be
tween the MME increase and the time interval of MRI examina
tions to identify the progression speed of MME, and determine the factors associated with rapid progression of MME among the four factors including age, body mass index (BMI), femorotibial angle (FTA), and medial joint space narrowing. Our hypotheses were as follows: (1) the MME increase would positively correlate with the interval between the first and second MRI examinations and (2) the four abovementioned factors would be associated with rapid progression of MME.
Materials and Methods
1. Study Subjects
From December 2014 to March 2018, 71 patients at Okayama University Hospital were found to possibly have MMPRT accord
ing to characteristic MRI findings (ghost/cleft/radial tear signs
of the MM posterior root within 9 mm from the attachment, and the giraffe neck sign
14)). Of those, we excluded patients with Kellgren–Lawrence grade 3 or higher OA or Outerbridge grade 3 or higher cartilage degeneration. Thus, 40 patients were initially enrolled in the study. We conducted second MRI in them to ex
amine cartilage lesions and bone edema just before surgery. The Institutional Review Board of Okayama University (no. 1857) approved this study, and written informed consent was obtained from all patients before the second MRI. Later, we excluded patients without a memory of painful popping event, because MMPRTs without the event were associated with more severe de
generative changes in the articular cartilage than those with the event
4). Patients with a history of previous meniscal surgery were also excluded. Ultimately, 33 patients were included in this study (Fig. 1). Medical records and preoperative standing radiographs were reviewed retrospectively to examine age, sex, height, body weight, BMI, and FTA. Patient demographics are shown in Table 1.
2. MRI-based Measurements
MRI was performed using Achieva 1.5 T (Philips, Amsterdam, The Netherlands) with a knee coil. Standard sequences included sagittal (repetition time [TR]/echo time [TE]: 742/18), coronal (TR/TE: 637/18), and axial (TR/TE: 499/18) T2weighted fast
field echo with a 20° flip angle. Slice thickness was 3 mm with a 0.6mm gap. Field of view was 16 or 17 cm with an acquisition matrix size of 205×256 (or 200×368)
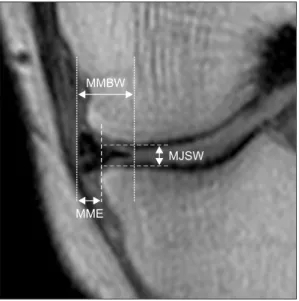
15). The MM body width (MMBW), medial joint space width (MJSW), and MME were as
sessed on the coronal plane showing maximal meniscal extrusion (Fig. 2). MMBW was measured from the inner margin to the outer margin of the MM. MME was defined as the distance be
tween the medial edge of the tibial plateau and the outer margin
Table 1. Demographic and Clinical Characteristics
Characteristic Value
No. of patients/knees 33/33
Sex, male/female 6/27
Age (yr) 59.8±9.7 (35–74)
Height (m) 1.58±0.07 (1.46–1.75)
Body weight (kg) 69.9±15.6 (51–112)
Body mass index (kg/m2) 27.9±5.1 (23.0–44.3)
Femorotibial angle (°) 177.8±1.9 (174–181)
Duration from injury to first MRI (day) 45.4±59.3 (1–197) Interval between first and second MRIs (day) 47.8±40.1 (2–155) Values are presented as number only or mean±standard deviation (range).
MRI: magnetic resonance imaging.
Second MRI
before arthroscopic surgery (n=40) First MRI suggesting the presence of MMPRT (n=71)
Final analysis (n=33)
Additional exclusion (n=7)
Without a memory of painful popping event (n=5)
Previous meniscal surgery (n=2) Exclusion criteria (n=31)
Kellgren Lawrence grade >3 (n=16) Cartilage damage
(Outerbridge grade >3) (n=10) Refused participation (n=5)
Fig. 1. Flow chart detailing the study protocol. MRI: magnetic resonance imaging, MMPRT: medial meniscus posterior root tear.
of the MM
16). Osteophytes were excluded in the determination of the tibial margin. The MJSW was measured as the minimum distance between the femoral and tibial margins. To validate the MRI measurements, we assessed interobserver and intra
observer reliabilities using the intraclass correlation coefficient (ICC). Four orthopedic surgeons (Yo.O., T.U., Y.K., and Yu.O.) retrospectively examined the MRI scans in a blinded manner.
The ICC was calculated for each MRI parameter using twoway, random, single measures with absolute agreement.
In addition, we calculated the increase of MME (ΔMME) be
tween the first and second MRI examinations and performed linear regression analysis to assess the correlation of ΔMME with the interval of MRI examinations. We defined the bestfit regression coefficient as the MME progression speed. The MME increase rate was also calculated as ΔMME divided by the inter
val of MRI examinations. The correlations of MME increase rate with age, BMI, FTA, and MJSW were also evaluated.
3. Statistical Analysis
The changes in MRI measurements between the first and sec
ond MRI scans were evaluated using the Wilcoxon signedrank test. Data are presented as mean±standard deviation. Significance was set at p<0.05. Power and statistical analyses were performed using EZR (Saitama Medical Center, Saitama, Japan), which is a
graphical user interface for R (R Foundation for Statistical Com
puting, Vienna, Austria). Sample size was estimated for a mini
mal statistical power of 80% (α=0.05). Linear regression analysis was used to evaluate Pearson’s correlation coefficient. A good correlation was represented by R
2≥0.60; moderate correlation, by
R2≥0.40; and poor correlation, by R
2<0.40.
Results
On MRIbased measurements, MMBW and MJSW showed no significant differences between the first and second MRI ex
aminations (p=0.066 and 0.260, respectively; Table 2). The mean MME significantly increased from 3.4±1.1 mm to 4.5±1.1 mm between the two MRI examinations. The values of interobserver and intraobserver reliabilities were excellent (ICC≥0.91) for all MRI measurements. A good correlation was observed between ΔMME and the time interval of MRI (R
2=0.621). The regression analysis was calculated as follows: ΔMME (mm)=0.020 (mm/
Fig. 2. Magnetic resonance imaging (MRI)based measurements of the medial meniscus body width (MMBW), medial joint space width (MJSW), and medial meniscus extrusion (MME) (left knee). The mea
surement was performed on the coronal plane image showing maximal MME. The vertical lines show the inner and outer borders of the medial meniscus. A vertical dashed line denotes the tibial medial margin. The MJSW was measured as the minimum distance between the femoral and tibial margins (the horizontal dashed lines).
Table 2. Mean Differences between the First and Second MRI Examinations
Variable First MRI Second MRI pvalue
MMBW (mm) 8.7±1.2 9.2±1.4 0.066
MJSW (mm) 3.8±0.4 3.7±0.5 0.260
MME (mm) 3.4±1.1 4.5±1.1 <0.001*
Values are presented as mean±standard deviation.
MRI: magnetic resonance imaging, MMBW: medial meniscus body width, MJSW: medial joint space width, MME: medial meniscus extrusion.
*Significance was determined with use of Wilcoxon signedrank test (p<
0.05).
0 4
2
MRI interval (days) 0
MME(mm)
150
30 60 90 120
Fig. 3. Correlation between the increase in medial meniscus extrusion (ΔMME) and the time interval of magnetic resonance imaging (MRI) scans, with a Pearson’s correlation coefficient (R2=0.621). The regression equation was linear: ΔMME (mm)=0.020 (mm/day)×MRI interval (day).