경기도내 유통 과실류의 잔류농약 위해평가(2006~2010)
도영숙* ・ 김중범 ・ 강석호 ・ 김난영 ・ 엄미나 ・ 박용배 ・ 오문석 ・ 윤미혜 경기도보건환경연구원 보건연구기획팀, 수원농산물검사소
(Received on May 18, 2012. Revised on May 25, 2012. Accepted on June 1, 2012)
Risk assessment of pesticide residues in fruits collected in Gyeonggi-do, Korea from 2006 to 2010
Young-Sook Do*, Jung-Beom Kim, Suk-Ho Kang, Nan-Young Kim, Mi-Na Um, Yong-Bae Park, Mun-Seok Oh, and Mi-Hye Yoon
Health Research & Planning Team, Suwon Agricultural Products Inspection Center, Gyeonggi-do Institute of Health & Environment
The monitoring of pesticide residues was performed on 33 fruit commodities collected in Gyeonggi-do, Korea from 2006 to 2010. Pesticide residues were detected in 431 samples (16.8%) of total 2,558 samples and violated in 12 samples (0.5%). Annual detection rate showed 6.9%~19.4% with the rate of violation of 0.3%~0.9%.
Twenty three samples (69.7%) of 33 commodities were detected and 4 samples (12.1%) were violated. Eight pesticides (EPN, dicofol, carbaryl, procymidone, methidathion, prothiofos, fenitrothion and phenthoate) were violated and 62 pesticides were detected. Chloropyrifos was detected most frequently. The rate of detection and violation of citrus fruits in fruits showed the highest level. Organophosphorus pesticides (35%) and insecticide (57%) were detected most frequently. The hazard index (%ADI) of chronic dietary risk assessment by deterministic approach showed that the lower limit value and upper limit value for the whole population were 0.0000~0.7526 and 0.0000~1.3237 respectively. For the only consumer group, the lower limit value and upper limit value were 0.0006~9.7801 and 0.0058~15.9258 respectively. Therefore the hazard index for the whole population and the only consumer group were evaluated as a safe level.
Key words Pesticide residues, Fruits, Risk assessment Abstract
*Corresponding author: Tel. +82-31-250-2581 Fax. +82-31-250-2588, E-mail. [email protected]
서 론
과실류는 식물성 식품 중 곡류, 채소류 다음으로 우리나라 국민 1인당 1일 섭취량이 많은 식품군이다(KNHANES Ⅳ -3, 2009). 특히 과실류에는 carotenoids, anthocyanins 등 항산화 성분이 풍부한 각종 phytochemicals를 다량 함유하 고 있어 항암, 항노화식품으로서 최근 중요성이 부각되고 있 다(Lee et al., 2004; Kim et al., 2009; Kim et al., 2011).
과실류는 재배기간이 대체로 길고 재배과정 중 발생하는 각 종 병충해 방제와 품질향상을 위해 다양한 농약이 사용되어 지고 있다. 농약은 오 ・ 남용으로 농산물에 과다 잔류할 경우 그 독성으로 인해 인체에 유해하게 작용할 수 있다. 잔류성에 는 형태적 특징, 기후, 살포방법, 작용특성, 재배방법 등이 영 향을 미친다. 특히 활발한 FTA 체결, 기상 악화로 인한 국내 과일의 작황 저조, 수입 과실류의 선호도 증가로 인한 수입 과실류의 유통도 증가되고 있는 추세이다(KCS, 2011). 수입 과실류의 경우는 저장 및 수송기간이 길어 재배과정 중 뿐만 아니라 수확 후에도 부패나 변질을 방지하기 위한 농약이 사
85
ORIGINAL ARTICLE / RESIDUE Open Access
용되어지고 있다(Yang et al., 2006). 따라서 소비자는 국내
・ 외에서 생산되어 우리나라에서 유통되는 농산물 중의 잔류 농약에 대해 막연한 불안감을 가지게 된다. 실제로 농산물에 대한 소비자 인식조사에서 유해물질 중 농약의 안전성에 대 한 우려가 가장 높게 나타났다(NAQS, 2009).
농산물 중 잔류농약은 세척, 가공, 조리 과정 중에 제거될 수 있다(Hwng et al., 2011; Foodnara, 2011). 특히 과실류 의 경우 농약이 껍질에 대부분 잔류되므로 껍질 제거로 평균 91%의 유기인계 농약 제거 효과가 있으며(Lee et al., 2010), 두꺼운 껍질을 가진 과실일수록 껍질제거만으로도 농약섭취 량을 현저히 줄일 수 있다(Cho et al., 2011). 그러나 과실류 에 적용되는 농약은 수십 가지 이며 침투성 약제 일수록 과육 중에도 잔류가 용이하고, 농약에 따라 세척과 조리 과정 중에 도 쉽게 제거 되지 않기 때문에(Kwon, 2007) 과실류 중 잔 류농약의 안전성을 입증하기 위해서는 식이섭취에 따른 위해 평가 자료가 충분히 제시되어야 한다.
위해평가는 위험확인, 위험결정, 노출평가와 위해도 결정 의 4단계로 이루어진다(WHO, 2002). 노출평가는 노출기간 에 따라 만성식이노출평가와 급성식이노출평가로 구분되며 실제적인 결과를 얻기 위하여 목적과 비용에 따라 단계적인 접근법으로 노출량을 추정한다(WHO, 2009). 점추정치를 이 용한 결정론적(deterministic) 접근법과 결정론적 접근법에서 위해가 있다고 인정될 때는 보다 진보된 확률분포 모델을 사 용한 확률론적(statistical) 접근법으로 노출평가를 수행한다.
결정론적 접근법은 오염물질의 평균농도나 중간농도를 평균 식이 섭취량과 곱하고 평균체중으로 나누어 추정하는 방법으 로 단순하고 쉽게 계산 할 수 있다는 장점이 있다. 위해도 결 정은 노출량을 인체안전기준으로 나누어 산출하여 인체안전 기준을 초과 하면 위해가 있다고 판단한다. 잔류농약의 위해 평가 결과는 평균농도, 식이섭취량과 평균체중의 신뢰도에 따라 영향이 커지므로 광범위하고 정확한 자료는 필수적이 다. 우리나라의 유통 농산물 중 잔류농약에 대한 위해평가는 1990년대 중반 이후부터 꾸준히 시도되고 있으며, 대체로 위 해평가 결과 위해도는 낮아 안전한 수준인 것으로 나타났다 (Lee et al., 2001; Kim, 2009). 과실류에 대한 위해평가는 한 등(2002)이 대전시 노은 농수산물도매시장에서 포도, 귤, 배, 사과, 딸기와 복숭아 등 6종 120건을 대상으로 실시하여 보고한 것으로 위해도가 1.221%이하로 낮게 나타났다. 그러 나 위해평가자 마다 모니터링 자료의 범위, 식이 섭취량과 평 균체중 등의 적용이 달라 결과를 비교하는데 어려움이 발생한다.
우리나라는 최근 농산물 중의 안전성 확보를 위해 기존의 국립농산물품질관리원 뿐만 아니라 지방식품의약품안전청,
각 시도 보건환경연구원에서 잔류농약 감시활동을 광범위하 게 펼치고 있다. 그러나 각 검사기관에서 생산되는 모니터링 자료는 분산되어 있어 식이섭취 위해평가 자료로 충분히 활 용되지 못하고 있다. 식이 섭취량은 국민건강영양조사 자료 나 식품수급표 등을 활용하고 있으나 잔류농약 위해평가를 위한 보다 정확한 섭취량 자료가 필요하다.
본 연구는 경기도내 농산물검사소에서 유통 과실류에 대 해 2006년부터 2010년까지 모니터링한 자료 2,558건을 분 석하여 실태를 파악하고, 실제 소비자 섭취에 따른 만성식이 위해평가를 실시하여 소비자와의 위해 커뮤니케이션과 잔류 농약허용기준 설정 등의 기초 자료로 제공하고자 하였다.
재료 및 방법
시료
시료는 2006년부터 2010년까지 경기도내 31개 시군 지역 의 백화점, 대형 유통마트, 재래시장, 도매시장 등지에서 유 통되는 과실류 33품목, 2,558건을 대상으로 하였다. 2006년 115건, 2007년 160건, 2008년 450건, 2009년 1,065건, 2010년 768건으로 소분류별로는 감귤류 408건(15.9%), 열 대과일류 370건(14.5%), 인과류 907건(35.5%), 장과류 570 건(22.3%), 핵과류 303건(11.8%)이었다. 경기도내 도매시장 에 위치한 수원, 구리, 안양, 안산농산물검사소에서 각 관할 지역에서 수집한 과실류에 대하여 2006년과 2007년에 183 종, 2008년과 2009년에 206종, 2010년에 218종의 농약을 분석하였다(Table 1).
시약 및 기구
농약 표준품은 Dr. Ehrenstorfer (Germany), Wako (Japan) 제품을 사용하였다. 추출 및 분석용 용매로 acetonitrile과 dichloromethan은 Burdick & Jacson와 JT & Bakers (U.S.A) 를 사용하였고, methanol, n-hexane과 acetone은 잔류농약 분석용 Wako (Japan)제품을 사용하였다. 분리․정제용 SPE 카트리지는 GC 분석용으로 florisil (1000 mg/6 mL, Applied Separation, USA), HPLC 분석용으로 NH2 (1000 mg/6 mL, Phenomenex, USA)를 사용하였다.
시료의 분쇄는 Robot Coupe Blixer 5V (MS, USA)를 사 용하였으며, Omni Macro ES homogenizer (Omni international, U.S.A)로 잔류농약을 추출하였다. 농축기는 TurboVapⓇ LV (Caliper Life Sciences, U.S.A)를 사용하였다.
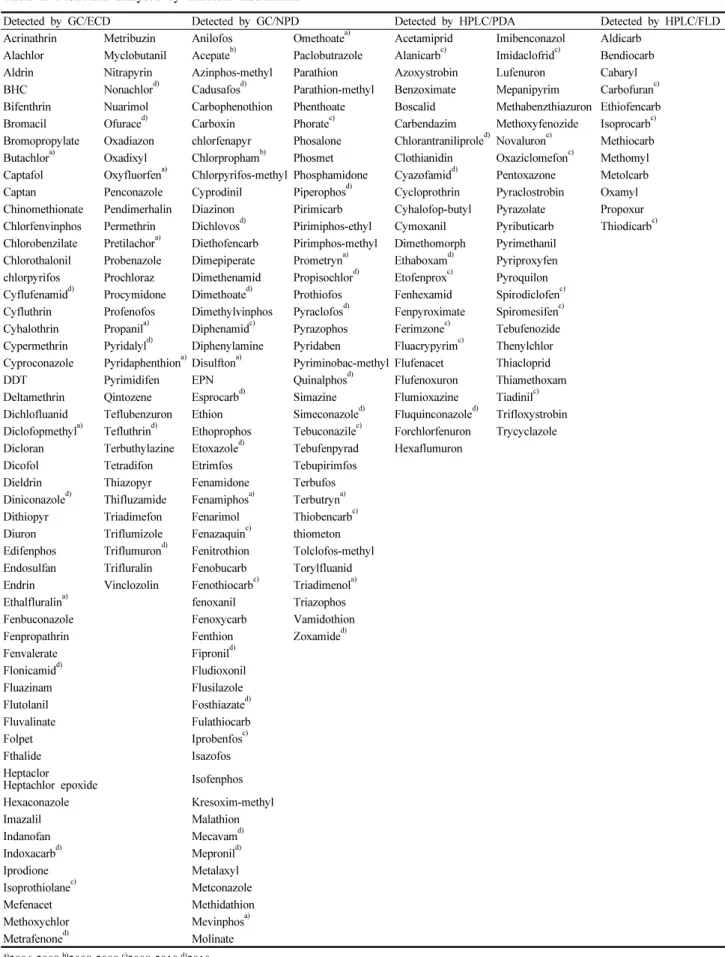
Table 1. Pesticides analysed by different instruments
Detected by GC/ECD Detected by GC/NPD Detected by HPLC/PDA Detected by HPLC/FLD
Acrinathrin Metribuzin Anilofos Omethoatea) Acetamiprid Imibenconazol Aldicarb Alachlor Myclobutanil Acepateb) Paclobutrazole Alanicarbc) Imidaclofridc) Bendiocarb
Aldrin Nitrapyrin Azinphos-methyl Parathion Azoxystrobin Lufenuron Cabaryl
BHC Nonachlord) Cadusafosd) Parathion-methyl Benzoximate Mepanipyrim Carbofuranc) Bifenthrin Nuarimol Carbophenothion Phenthoate Boscalid Methabenzthiazuron Ethiofencarb Bromacil Ofuraced) Carboxin Phoratec) Carbendazim Methoxyfenozide Isoprocarbc) Bromopropylate Oxadiazon chlorfenapyr Phosalone Chlorantraniliproled) Novaluronc) Methiocarb Butachlora) Oxadixyl Chlorprophamb) Phosmet Clothianidin Oxaziclomefonc) Methomyl Captafol Oxyfluorfena) Chlorpyrifos-methyl Phosphamidone Cyazofamidd) Pentoxazone Metolcarb Captan Penconazole Cyprodinil Piperophosd) Cycloprothrin Pyraclostrobin Oxamyl Chinomethionate Pendimerhalin Diazinon Pirimicarb Cyhalofop-butyl Pyrazolate Propoxur Chlorfenvinphos Permethrin Dichlovosd) Pirimiphos-ethyl Cymoxanil Pyributicarb Thiodicarbc) Chlorobenzilate Pretilachora) Diethofencarb Pirimphos-methyl Dimethomorph Pyrimethanil
Chlorothalonil Probenazole Dimepiperate Prometryna) Ethaboxamd) Pyriproxyfen chlorpyrifos Prochloraz Dimethenamid Propisochlord) Etofenproxc) Pyroquilon Cyflufenamidd) Procymidone Dimethoated) Prothiofos Fenhexamid Spirodiclofenc) Cyfluthrin Profenofos Dimethylvinphos Pyraclofosd) Fenpyroximate Spiromesifenc) Cyhalothrin Propanila) Diphenamidc) Pyrazophos Ferimzonec) Tebufenozide Cypermethrin Pyridalyld) Diphenylamine Pyridaben Fluacrypyrimc) Thenylchlor Cyproconazole Pyridaphenthiona)Disulftona) Pyriminobac-methyl Flufenacet Thiacloprid
DDT Pyrimidifen EPN Quinalphosd) Flufenoxuron Thiamethoxam
Deltamethrin Qintozene Esprocarbd) Simazine Flumioxazine Tiadinilc) Dichlofluanid Teflubenzuron Ethion Simeconazoled) Fluquinconazoled) Trifloxystrobin Diclofopmethyla) Tefluthrind) Ethoprophos Tebuconazilec) Forchlorfenuron Trycyclazole Dicloran Terbuthylazine Etoxazoled) Tebufenpyrad Hexaflumuron
Dicofol Tetradifon Etrimfos Tebupirimfos
Dieldrin Thiazopyr Fenamidone Terbufos
Diniconazoled) Thifluzamide Fenamiphosa) Terbutryna) Dithiopyr Triadimefon Fenarimol Thiobencarbc) Diuron Triflumizole Fenazaquinc) thiometon Edifenphos Triflumurond) Fenitrothion Tolclofos-methyl Endosulfan Trifluralin Fenobucarb Torylfluanid Endrin Vinclozolin Fenothiocarbc) Triadimenola)
Ethalfluralina) fenoxanil Triazophos
Fenbuconazole Fenoxycarb Vamidothion
Fenpropathrin Fenthion Zoxamided)
Fenvalerate Fipronild)
Flonicamidd) Fludioxonil
Fluazinam Flusilazole
Flutolanil Fosthiazated)
Fluvalinate Fulathiocarb
Folpet Iprobenfosc)
Fthalide Isazofos
Heptaclor
Heptachlor epoxide Isofenphos
Hexaconazole Kresoxim-methyl
Imazalil Malathion
Indanofan Mecavamd)
Indoxacarbd) Mepronild)
Iprodione Metalaxyl
Isoprothiolanec) Metconazole
Mefenacet Methidathion
Methoxychlor Mevinphosa)
Metrafenoned) Molinate
a)2006-2009,b)2008-2009,c)2008-2010,d)2010
Table 2. ADI values used for the chronic risk assessment Pesticide ADI
(mg/kg) Pesticide ADI (mg/kg) Azinphos-methyl 0.005 Fenvalerate 0.02
Azoxystrobin 0.2 Fludioxonil 0.4 Bifenthrin 0.01 Folpet 0.1 Boscalid 0.04 Fthalide 0.04 Bromacil 0.013 Hexaconazole 0.005
Captan 0.1 Imazalil 0.03 Carbaryl 0.008 Imidacloprid 0.06 Carbendazim 0.03 Iprodione 0.06 Carbofuran 0.002 Kresoxim-methyl 0.4
Carboxin 0.008 Metconazole 0.01 Chlorfenapyr 0.026 Methidathion 0.001 Chlorfenvinphos 0.0005 Myclobutanil 0.03
Chlorothalonil 0.02 Novaluron 0.01 Chlorpyrifos 0.01 Parathion 0.004
Cyhalothrin 0.02 Permethrin 0.05 Cypermethrin 0.05 Phenthoate 0.003
Cyprodinil 0.03 Phosmet 0.01 Deltamethrin 0.01 Prochloraz 0.01 Diazinon 0.005 Procymidone 0.1
Dicofol 0.002 Prothiofos 0.0015 Dimethomorph 0.2 Pyridaben 0.01
Endosulfan 0.006 Pyrimethanil 0.2 EPN 0.0014 Tebuconazole 0.03 Etrimfos 0.003 Tebufenpyrad 0.0021 Fenazaquin 0.05 Teflubenzuron 0.01 Fenitrothion 0.005 Tetradifon 0.06 Fenobucarb 0.01 Thiodicarb 0.03 Fenothiocarb 0.0075 Triadimefon 0.03 Fenoxanil 0.0069 Trifloxystrobin 0.04 Fenpropathrin 0.03 Triflumizole 0.05 Fenthion 0.007 Vinclozolin 0.01
Fig. 1. Annual results of pesticide residues (2006~2010).
잔류농약 분석방법
시료는 식품공전 일반시험법의 다종농약다성분 분석법에 의해 전처리 한 후 기기분석하였다. GC 분석 대상 농약에 대 하여 GC-NPD와 GC-µECD (Agilent 6890, 7890, USA)로 정량분석하고, GC-MS (Agilent 5973, USA), GC-TOFMS (Leco Pegasus HT, Singapore)를 이용하여 정성분석하였 다. HPLC 분석 대상 농약은 HPLC-PDA (Waters UPLC, USA), HPLC-FLD (Waters FLD2475, USA)를 이용하여 정량분석하고, UPLC-MSMS (Waters, USA)를 이용하여 정성분석하였다.
위해평가 방법
소비자들의 과실류 섭취에 따른 농약별 만성식이 위해도 를 알아보기 위해 결정론적 방법으로 노출량을 산출하고 위 해도를 평가하였다. 과실류 품목별 섭취량은 2009년도 국민 건강영양조사(질병관리본부)자료를 활용하여 SPSS와 Excel 프로그램으로 전국민 평균과 섭취자군 평균에 대하여 각각 산출하였다. 농약 잔류량 평균치는 검출된 모든 농약의 불검 출률이 60% 이상이므로 불검출건에 대하여 하한치(LOD=0) 와 상한치(LOD=0.01) 두 가지로 산출하였다(Lee, 2002).
우리나라 국민의 평균체중은 농산물 중 잔류농약 기준설정을 위한 위해평가시 적용되는 55kg을 적용하였다. 만성식이 노 출량(EDI, estimated daily intake)은 농약 잔류량에 각 식품 섭취량을 곱하고 평균체중으로 나누어 합한 값으로 계산하였 다. 농약별 노출량(EDI)을 일일섭취허용량(ADI)으로 나누어 위해도(%ADI)를 구하였고, 수식은 다음과 같다(KIFDS, 2011).
만성식이노출량(EDI, mg/kgbw/day) =
평균체중
평균잔류량 × 식품일일섭취량
위해도(%ADI) = ×
위해도 산출을 위한 검출된 농약별 ADI는 2011년 식품의 약품안전청 잔류농약 데이터베이스를 참고하였으며 Table 2 와 같다.
결과 및 고찰
연도별 결과
2006년부터 2010년까지 경기도내 유통 과실류의 잔류농약
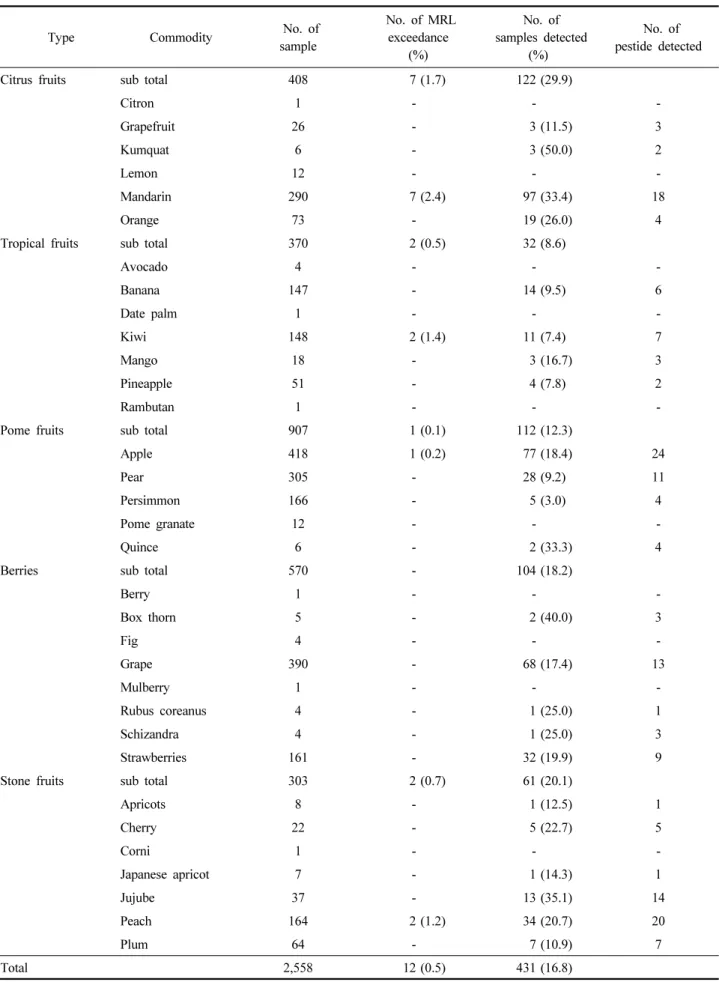
Table 3. Results of pesticide residues by fruit commodity (2006~2010)
Type Commodity No. of sample
No. of MRL exceedance
(%)
No. of samples detected
(%)
No. of pestide detected
Citrus fruits sub total 408 7 (1.7) 122 (29.9)
Citron 1 - - -
Grapefruit 26 - 3 (11.5) 3
Kumquat 6 - 3 (50.0) 2
Lemon 12 - - -
Mandarin 290 7 (2.4) 97 (33.4) 18
Orange 73 - 19 (26.0) 4
Tropical fruits sub total 370 2 (0.5) 32 (8.6)
Avocado 4 - - -
Banana 147 - 14 (9.5) 6
Date palm 1 - - -
Kiwi 148 2 (1.4) 11 (7.4) 7
Mango 18 - 3 (16.7) 3
Pineapple 51 - 4 (7.8) 2
Rambutan 1 - - -
Pome fruits sub total 907 1 (0.1) 112 (12.3)
Apple 418 1 (0.2) 77 (18.4) 24
Pear 305 - 28 (9.2) 11
Persimmon 166 - 5 (3.0) 4
Pome granate 12 - - -
Quince 6 - 2 (33.3) 4
Berries sub total 570 - 104 (18.2)
Berry 1 - - -
Box thorn 5 - 2 (40.0) 3
Fig 4 - - -
Grape 390 - 68 (17.4) 13
Mulberry 1 - - -
Rubus coreanus 4 - 1 (25.0) 1
Schizandra 4 - 1 (25.0) 3
Strawberries 161 - 32 (19.9) 9
Stone fruits sub total 303 2 (0.7) 61 (20.1)
Apricots 8 - 1 (12.5) 1
Cherry 22 - 5 (22.7) 5
Corni 1 - - -
Japanese apricot 7 - 1 (14.3) 1
Jujube 37 - 13 (35.1) 14
Peach 164 2 (1.2) 34 (20.7) 20
Plum 64 - 7 (10.9) 7
Total 2,558 12 (0.5) 431 (16.8)
Fig. 2. Percentage of pesticide detected by chemical classification.
Fig. 3. Percentage of pesticide detected by use.
모니터링결과는 Fig. 1과 같았다. 시료는 2006년부터 2010 년까지 각각 115건(4.5%), 160건(6.3%), 450건(17.6%), 1,065건(41.6%), 768건(30.0%)건으로 총 2,558건이었다. 연 도별 검출률은 2007년이 6.9%로 가장 낮았고, 2009년이 19.4%로 가장 높게 나타났으며, 5년간 16.8%로 나타났다. 부 적합률은 2010년이 0.3%로 가장 낮았고, 2006년과 2008년 에 0.9%로 가장 높았으며 5년간 0.5%로 나타났다. 부산지역 의 모니터링 결과(Kwon et al., 2010)와 비교해 보면 경기도 내 유통 과실류의 검출률과 부적합률은 상대적으로 낮게 나타 났다. 과실류는 채소류에 비해 부적합률이 현저히 낮은 경향 이 있는데 채소류에 비해 과실류가 단위 중량당 표면적이 작 기 때문인 것으로 판단된다(Hwang et al., 2008). 연간 검출률 과 부적합률의 차이는 기후 변화로 인한 병충해의 발생양상과 잔류농약허용기준의 개정 등에 기인하는 것으로 추정된다.
품목별 결과
과실류의 품목별 잔류농약 모니터링 결과는 Table 3과 같 다. 소분류별 검출률은 감귤류(29.9%), 핵과류(20.1%), 장과 류(18.2%), 인과류(12.3%), 열대과일류(8.6%) 순으로 나타 났다. 부적합률은 감귤류(1.7%), 핵과류(0.7%), 열대과일류 (0.5%), 인과류(0.1%) 순으로 나타났으며 장과류에서는 부 적합이 발생하지 않았다. 과실류 33품목 중 23품목(69.7%) 에서 잔류농약이 검출되었고, 부적합은 감귤 7건(2.4%), 키 위 2건(1.2%), 복숭아 2건(1.2%), 사과 1건(0.2%) 등 4품목 (12.1%)에서 발생하였다. 검출률 30%이상 상위 품목은 금 귤, 구기자, 대추, 감귤, 모과 순으로 주로 감귤류와 핵과류에 서 높게 나타났다. 2007년 서울시의 보고(Shin et al., 2007) 에서도 과실류 중 감귤류의 검출률과 부적합률이 가장 높게 나타나 본 모니터링 결과와 일치하였다. 감귤류은 껍질이 두 꺼워 껍질을 제거한 가식부에서는 잔류농약이 거의 검출되지 않으므로 안전하나(Yang et al., 2006; Cho et al., 2011), 껍 질을 말려 한약재나 차로 음용할 경우는 세척 등에 주의하여 야 한다. 품목별 검출된 농약 성분수는 사과(24종), 복숭아 (20종), 감귤(18종), 대추(14종), 포도(13종), 배(11종) 순으 로 나타나 사과에서 가장 다양한 농약이 검출되었다. 주목할 만한 점은 해당 작물에 적용 불가한 농약들이 다양하게 검출 되었는데 농민들이 농약 사용시 작물에 사용 할 수 있는 농약 을 골라 사용하기보다는 병충해에 적용 가능한 농약을 우선 시 하기 때문인 것으로 짐작된다. 올바른 농약 사용을 위해서 는 농촌의 고령화를 감안하여 농약사용지침서와 농약병의 표 시사항도 알아보기 쉽도록 개선하고, 이를 준수하도록 철저 한 교육이 이루어져야 한다.
농약 성분별 결과
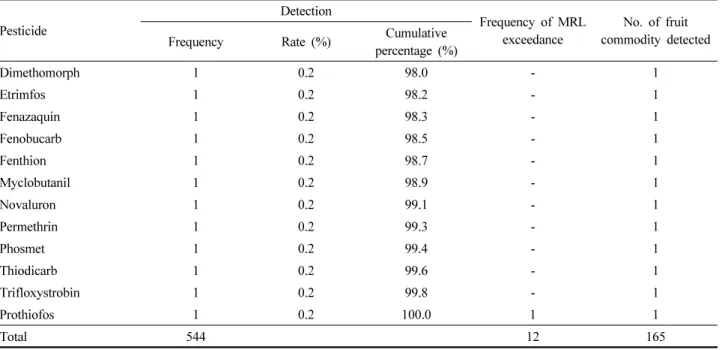
농약별 모니터링 결과는 Table 4와 같다. 2006년부터 2010년까지 농약 236종 검사결과 62종에서 544회 검출되었 고, 8종에서 부적합이 12회 발생하였다. 검출빈도가 가장 많 은 농약은 chlorpyrifos로 전체 검출빈도의 16.9%를 차지했 다. Procymidone, fenitrothion, tebuconazole, phenthoate, chlorothalonil, iprodione, endosulfan 등을 포함한 20여종 의 농약이 전체 검출의 80%를 차지했다. Chlorpyrifos는 나 방이나 진딧물 방제에 사용되는 독성이 강한 유기인계 살충 제로 사과, 감귤, 배, 복숭아 등에 적용하도록 되어있으나 (KCPA, 2011), 대추, 구기자, 자두 등에서도 검출되었다.
Chlorpyrifos의 부적합 발생은 없었으나 다른 유기인계 농약 들과 누적 위해성을 나타낼 수 있고(Lee et al., 2001; Trine et al., 2010), 토양에서 60∼120일간 지속되어 서서히 분해 되므로 사용시기와 사용량을 철저히 지키도록 지도해야 할 것이다(Jeong et al., 2004). Procymidone은 잿빛곰팡이에 사용되며 딸기, 토마토, 포도, 복숭아 등에 적용되는 디카복 시이미드계 살균제지만 감귤, 살구, 배 등에서도 검출되었다.
농약의 계통별 검출빈도는 유기인계(35%)가 가장 많았고, 디 카복시이미드계(11%), 유기염소계(11%), 피레스로이드계 (9%), 트이라졸계(8%) 순으로 이들이 전체의 74%를 차지했 다(Fig. 2).
Table 4. Results of pesticide residues by pesticides (2006~2010) Pesticide
Detection
Frequency of MRL exceedance
No. of fruit commodity detected Frequency Rate (%) Cumulative
percentage (%)
Chlorpyrifos 92 16.9 16.9 - 11
Procymidone 56 10.3 27.2 1 6
Fenitrothion 35 6.4 33.6 1 5
Tebuconazole 30 5.5 39.2 - 4
Phenthoate 26 4.8 43.9 1 5
Chlorothalonil 23 4.2 48.2 - 7
Iprodione 22 4.0 52.2 - 7
Endosulfan 16 2.9 55.1 - 6
Kresoxim-methyl 14 2.6 57.7 - 4
EPN 14 2.6 60.3 4 5
Dicofol 13 2.4 62.7 2 1
Boscalid 12 2.2 64.9 - 5
Imazalil 12 2.2 67.1 - 3
Cyprodinil 12 2.2 69.3 - 2
Fenvalerate 11 2.0 71.3 - 7
Fenpropathrin 11 2.0 73.3 - 3
Methidathion 11 2.0 75.4 1 3
Cypermethrin 10 1.8 77.2 - 7
Hexaconazole 10 1.8 79.0 - 4
Bifenthrin 9 1.7 80.7 - 4
Imidacloprid 9 1.7 82.4 - 1
Tetradifon 7 1.3 83.6 - 6
Fludioxonil 7 1.3 84.9 - 2
Pyrimethanil 7 1.3 86.2 - 2
Fenothiocarb 6 1.1 87.3 - 1
Carbaryl 6 1.1 88.4 1 3
Cyhalothrin 5 0.9 89.3 - 5
Teflubenzuron 5 0.9 90.3 - 2
Azoxystrobin 3 0.6 90.8 - 2
Prochloraz 3 0.6 91.4 - 2
Triadimefon 3 0.6 91.9 - 1
Azinphos-methyl 2 0.4 92.3 - 2
Chlorfenapyr 2 0.4 92.6 - 2
Fenoxanil 2 0.4 93.0 - 2
Fthalide 2 0.4 93.4 - 2
Parathion 2 0.4 93.8 - 2
Pyridaben 2 0.4 94.1 - 2
Tebufenpyrad 2 0.4 94.5 - 2
Triflumizole 2 0.4 94.9 - 2
Deltamethrin 2 0.4 95.2 - 1
Diazinon 2 0.4 95.6 - 1
Folpet 2 0.4 96.0 - 1
Metconazole 2 0.4 96.3 - 1
Vinclozolin 2 0.4 96.7 - 1
Bromacil 1 0.2 96.9 - 1
Captan 1 0.2 97.1 - 1
Carbendazim 1 0.2 97.2 - 1
Carbofuran 1 0.2 97.4 - 1
Carboxin 1 0.2 97.6 - 1
Chlorfenvinphos 1 0.2 97.8 - 1
Table 4. Continued Pesticide
Detection
Frequency of MRL exceedance
No. of fruit commodity detected Frequency Rate (%) Cumulative
percentage (%)
Dimethomorph 1 0.2 98.0 - 1
Etrimfos 1 0.2 98.2 - 1
Fenazaquin 1 0.2 98.3 - 1
Fenobucarb 1 0.2 98.5 - 1
Fenthion 1 0.2 98.7 - 1
Myclobutanil 1 0.2 98.9 - 1
Novaluron 1 0.2 99.1 - 1
Permethrin 1 0.2 99.3 - 1
Phosmet 1 0.2 99.4 - 1
Thiodicarb 1 0.2 99.6 - 1
Trifloxystrobin 1 0.2 99.8 - 1
Prothiofos 1 0.2 100.0 1 1
Total 544 12 165
부적합 발생 농약은 procymidone, fenitrothion, phenthoate, EPN, dicofol, methidathion, carbaryl, prothiofos 등 8종으 로 유기인계가 전체 부적합의 50% 이상을 차지했다.
유기인계 농약은 급성독성이 강한 농약으로 분해 속도가 빨 라서 광범위하게 사용되어지고 있어 검출률이 높은 것으로 판 단된다. 농약의 용도별 검출빈도는 살충제가 56.6%로 가장 많 았고, 살균제 43.2%, 제초제가 0.2% 순으로 나타났다(Fig. 3).
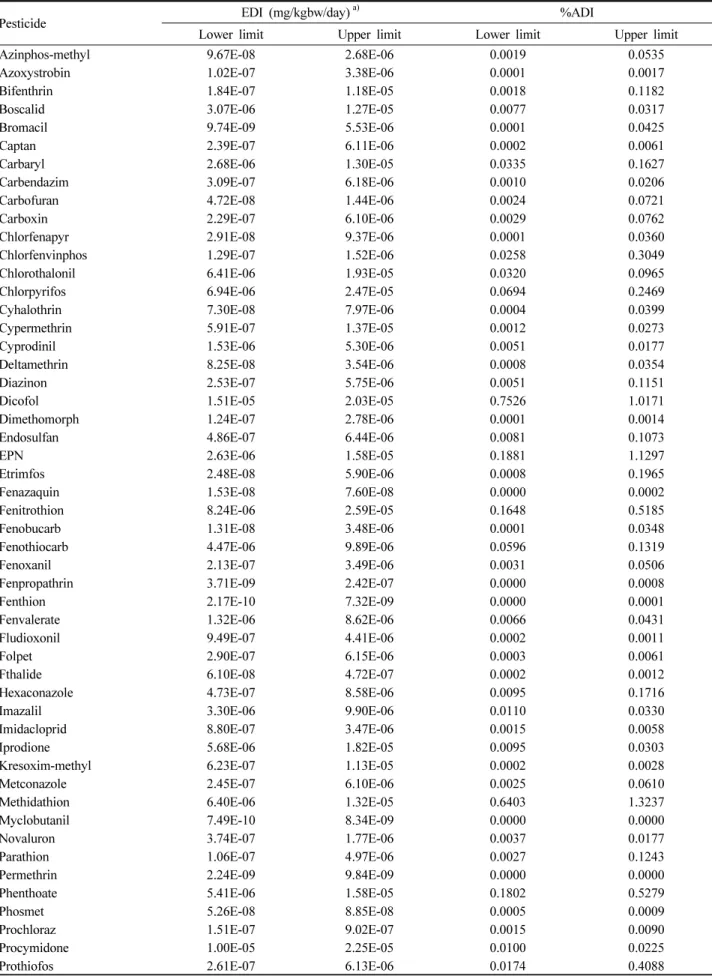
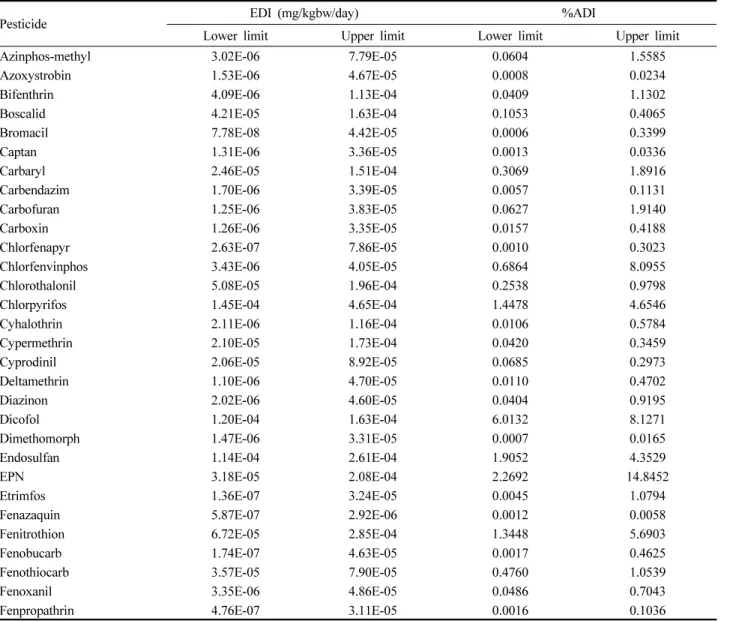
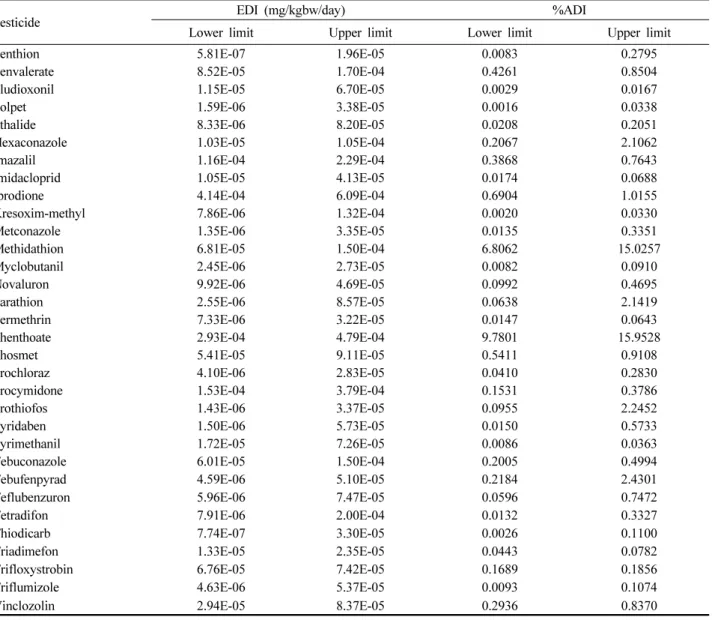
위해평가 결과
과실류의 섭취에 따른 위해도를 알아보기 위해 검출된 농 약 62종에 대하여 결정론적 방법으로 만성식이 노출량을 산 출하고 위해도를 평가하였다(Table 5, 6). 위해평가지침서에 는 농약별 평균 잔류량 계산시 불검출률이 60% 이상인 경우 하한과 상한치 두 가지로 평가하도록 되어 있다. 본 연구에 사용된 잔류농약 데이터는 4곳의 연구실 자료를 수집하여 수 행한 post assessment로서 평균 잔류량 계산시 불검출건에 대하여 하한치는 LOD=0을 적용하였고, 상한치는 LOD=0.01 을 일률적으로 적용하였다(Lee, 2002). 식이섭취량 적용에도 가공계수를 적용하지 않아 본 위해평가 결과는 잔류농약 농 도와 식품 섭취량 산출에 약간의 불확실성이 존재한다.
위해평가 결과 위해도(%ADI)는 전국민의 하한치가 0.0000
∼0.7526%로 나타났고 dicofol이 최고치였으며 다음으로 위 해도 0.1%이상 농약은 methidathion, EPN, phenthoate와 fenitrothion 순이었다. 상한치는 0.0000∼1.3237%로 meth- idathion이 가장 높았고 위해도 0.5% 이상 농약은 EPN,
dicofol, phenthoate와 fenitrothion 순으로 나타났다. 섭취자 만을 대상으로 한 위해도는 하한치 0.0006∼9.7801%였고, 1.0% 이상 농약은 phenthoate, methidathion, dicofol, EPN, endosulfan, chlorpyrifos와 fenitrothion 순으로 나타났다.
상한치는 0.0058∼15.9528%로 5% 이상 농약은 phenthoate, methidathion, EPN, dicofol, chlorfenvinphos, fenitrothion 순으로 나타났다. 한 등(2002)의 보고에서도 6종의 주요 과 실에 대한 잔류농약 위해도는 1/2 LOD를 적용한 결과 최고 치가 dicofol이 1.221%로 나타나 본 연구의 전국민 상한치 와 유사한 결과를 보였다.
위해도가 상대적으로 높은 이들 농약은 독성이 강해 ADI 가 낮기 때문인 것으로 여겨진다(Kim et al., 2006). 섭취자 군의 위해도는 전국민에 대하여 10배 이상으로 나타났으며 섭취자군의 개별 식품 섭취량의 차이로 농약의 위해도 순위가 전국민과 일치하지는 않았다. 개별 과실의 위해도가 10%를 넘는 경우는 없었으며 각각에서 최고치인 dicofol, methidathion, phenthoate에서 기여도가 높은 과실은 한 등(2002)의 연구에 서와 같이 감귤이었다. 그러나 대체로 감귤은 껍질째 분석되 어지지만 껍질을 벗겨 섭취하게 되므로 이를 감안하면 과실 류의 섭취에 따른 위해도는 더 낮아져 안전한 것으로 판단된 다. 과실류 중 위해도가 높은 농약의 대부분은 독성이 강한 유기인계 농약으로 위해도를 낮추기 위해서는 이들에 대한 사용지도와 관리가 철저히 이루어져야 할 것으로 판단된다.
앞으로 소비자가 신뢰 할 수 있는 보다 정확한 위해평가를 위해서는 다양한 식품에 대한 섭취량 자료, 가공계수 자료와
Table 5. Results of the chronic dietary risk assessment for the whole population
Pesticide EDI (mg/kgbw/day)a) %ADI
Lower limit Upper limit Lower limit Upper limit
Azinphos-methyl 9.67E-08 2.68E-06 0.0019 0.0535
Azoxystrobin 1.02E-07 3.38E-06 0.0001 0.0017
Bifenthrin 1.84E-07 1.18E-05 0.0018 0.1182
Boscalid 3.07E-06 1.27E-05 0.0077 0.0317
Bromacil 9.74E-09 5.53E-06 0.0001 0.0425
Captan 2.39E-07 6.11E-06 0.0002 0.0061
Carbaryl 2.68E-06 1.30E-05 0.0335 0.1627
Carbendazim 3.09E-07 6.18E-06 0.0010 0.0206
Carbofuran 4.72E-08 1.44E-06 0.0024 0.0721
Carboxin 2.29E-07 6.10E-06 0.0029 0.0762
Chlorfenapyr 2.91E-08 9.37E-06 0.0001 0.0360
Chlorfenvinphos 1.29E-07 1.52E-06 0.0258 0.3049
Chlorothalonil 6.41E-06 1.93E-05 0.0320 0.0965
Chlorpyrifos 6.94E-06 2.47E-05 0.0694 0.2469
Cyhalothrin 7.30E-08 7.97E-06 0.0004 0.0399
Cypermethrin 5.91E-07 1.37E-05 0.0012 0.0273
Cyprodinil 1.53E-06 5.30E-06 0.0051 0.0177
Deltamethrin 8.25E-08 3.54E-06 0.0008 0.0354
Diazinon 2.53E-07 5.75E-06 0.0051 0.1151
Dicofol 1.51E-05 2.03E-05 0.7526 1.0171
Dimethomorph 1.24E-07 2.78E-06 0.0001 0.0014
Endosulfan 4.86E-07 6.44E-06 0.0081 0.1073
EPN 2.63E-06 1.58E-05 0.1881 1.1297
Etrimfos 2.48E-08 5.90E-06 0.0008 0.1965
Fenazaquin 1.53E-08 7.60E-08 0.0000 0.0002
Fenitrothion 8.24E-06 2.59E-05 0.1648 0.5185
Fenobucarb 1.31E-08 3.48E-06 0.0001 0.0348
Fenothiocarb 4.47E-06 9.89E-06 0.0596 0.1319
Fenoxanil 2.13E-07 3.49E-06 0.0031 0.0506
Fenpropathrin 3.71E-09 2.42E-07 0.0000 0.0008
Fenthion 2.17E-10 7.32E-09 0.0000 0.0001
Fenvalerate 1.32E-06 8.62E-06 0.0066 0.0431
Fludioxonil 9.49E-07 4.41E-06 0.0002 0.0011
Folpet 2.90E-07 6.15E-06 0.0003 0.0061
Fthalide 6.10E-08 4.72E-07 0.0002 0.0012
Hexaconazole 4.73E-07 8.58E-06 0.0095 0.1716
Imazalil 3.30E-06 9.90E-06 0.0110 0.0330
Imidacloprid 8.80E-07 3.47E-06 0.0015 0.0058
Iprodione 5.68E-06 1.82E-05 0.0095 0.0303
Kresoxim-methyl 6.23E-07 1.13E-05 0.0002 0.0028
Metconazole 2.45E-07 6.10E-06 0.0025 0.0610
Methidathion 6.40E-06 1.32E-05 0.6403 1.3237
Myclobutanil 7.49E-10 8.34E-09 0.0000 0.0000
Novaluron 3.74E-07 1.77E-06 0.0037 0.0177
Parathion 1.06E-07 4.97E-06 0.0027 0.1243
Permethrin 2.24E-09 9.84E-09 0.0000 0.0000
Phenthoate 5.41E-06 1.58E-05 0.1802 0.5279
Phosmet 5.26E-08 8.85E-08 0.0005 0.0009
Prochloraz 1.51E-07 9.02E-07 0.0015 0.0090
Procymidone 1.00E-05 2.25E-05 0.0100 0.0225
Prothiofos 2.61E-07 6.13E-06 0.0174 0.4088
Table 5. Continued
Pesticide EDI (mg/kgbw/day)* %ADI
Lower limit Upper limit a) Lower limit Upper limit
Pyridaben 1.14E-07 3.60E-06 0.0011 0.0360
Pyrimethanil 1.38E-06 4.83E-06 0.0007 0.0024
Tebuconazole 2.09E-06 9.10E-06 0.0070 0.0303
Tebufenpyrad 5.51E-07 6.13E-06 0.0263 0.2920
Teflubenzuron 3.87E-07 7.62E-06 0.0039 0.0762
Tetradifon 7.72E-07 1.92E-05 0.0013 0.0320
Thiodicarb 1.41E-07 6.01E-06 0.0005 0.0200
Triadimefon 1.64E-07 2.90E-07 0.0005 0.0010
Trifloxystrobin 2.79E-06 3.07E-06 0.0070 0.0077
Triflumizole 9.58E-08 9.37E-07 0.0002 0.0019
Vinclozolin 2.16E-07 6.17E-07 0.0022 0.0062
a)EDI : Estimated daily intake
Table 6. Results of the chronic dietary risk assessment for the only consumers
Pesticide EDI (mg/kgbw/day) %ADI
Lower limit Upper limit Lower limit Upper limit
Azinphos-methyl 3.02E-06 7.79E-05 0.0604 1.5585
Azoxystrobin 1.53E-06 4.67E-05 0.0008 0.0234
Bifenthrin 4.09E-06 1.13E-04 0.0409 1.1302
Boscalid 4.21E-05 1.63E-04 0.1053 0.4065
Bromacil 7.78E-08 4.42E-05 0.0006 0.3399
Captan 1.31E-06 3.36E-05 0.0013 0.0336
Carbaryl 2.46E-05 1.51E-04 0.3069 1.8916
Carbendazim 1.70E-06 3.39E-05 0.0057 0.1131
Carbofuran 1.25E-06 3.83E-05 0.0627 1.9140
Carboxin 1.26E-06 3.35E-05 0.0157 0.4188
Chlorfenapyr 2.63E-07 7.86E-05 0.0010 0.3023
Chlorfenvinphos 3.43E-06 4.05E-05 0.6864 8.0955
Chlorothalonil 5.08E-05 1.96E-04 0.2538 0.9798
Chlorpyrifos 1.45E-04 4.65E-04 1.4478 4.6546
Cyhalothrin 2.11E-06 1.16E-04 0.0106 0.5784
Cypermethrin 2.10E-05 1.73E-04 0.0420 0.3459
Cyprodinil 2.06E-05 8.92E-05 0.0685 0.2973
Deltamethrin 1.10E-06 4.70E-05 0.0110 0.4702
Diazinon 2.02E-06 4.60E-05 0.0404 0.9195
Dicofol 1.20E-04 1.63E-04 6.0132 8.1271
Dimethomorph 1.47E-06 3.31E-05 0.0007 0.0165
Endosulfan 1.14E-04 2.61E-04 1.9052 4.3529
EPN 3.18E-05 2.08E-04 2.2692 14.8452
Etrimfos 1.36E-07 3.24E-05 0.0045 1.0794
Fenazaquin 5.87E-07 2.92E-06 0.0012 0.0058
Fenitrothion 6.72E-05 2.85E-04 1.3448 5.6903
Fenobucarb 1.74E-07 4.63E-05 0.0017 0.4625
Fenothiocarb 3.57E-05 7.90E-05 0.4760 1.0539
Fenoxanil 3.35E-06 4.86E-05 0.0486 0.7043
Fenpropathrin 4.76E-07 3.11E-05 0.0016 0.1036
Table 6. Continued Pesticide
EDI (mg/kgbw/day) %ADI
Lower limit Upper limit Lower limit Upper limit
Fenthion 5.81E-07 1.96E-05 0.0083 0.2795
Fenvalerate 8.52E-05 1.70E-04 0.4261 0.8504
Fludioxonil 1.15E-05 6.70E-05 0.0029 0.0167
Folpet 1.59E-06 3.38E-05 0.0016 0.0338
Fthalide 8.33E-06 8.20E-05 0.0208 0.2051
Hexaconazole 1.03E-05 1.05E-04 0.2067 2.1062
Imazalil 1.16E-04 2.29E-04 0.3868 0.7643
Imidacloprid 1.05E-05 4.13E-05 0.0174 0.0688
Iprodione 4.14E-04 6.09E-04 0.6904 1.0155
Kresoxim-methyl 7.86E-06 1.32E-04 0.0020 0.0330
Metconazole 1.35E-06 3.35E-05 0.0135 0.3351
Methidathion 6.81E-05 1.50E-04 6.8062 15.0257
Myclobutanil 2.45E-06 2.73E-05 0.0082 0.0910
Novaluron 9.92E-06 4.69E-05 0.0992 0.4695
Parathion 2.55E-06 8.57E-05 0.0638 2.1419
Permethrin 7.33E-06 3.22E-05 0.0147 0.0643
Phenthoate 2.93E-04 4.79E-04 9.7801 15.9528
Phosmet 5.41E-05 9.11E-05 0.5411 0.9108
Prochloraz 4.10E-06 2.83E-05 0.0410 0.2830
Procymidone 1.53E-04 3.79E-04 0.1531 0.3786
Prothiofos 1.43E-06 3.37E-05 0.0955 2.2452
Pyridaben 1.50E-06 5.73E-05 0.0150 0.5733
Pyrimethanil 1.72E-05 7.26E-05 0.0086 0.0363
Tebuconazole 6.01E-05 1.50E-04 0.2005 0.4994
Tebufenpyrad 4.59E-06 5.10E-05 0.2184 2.4301
Teflubenzuron 5.96E-06 7.47E-05 0.0596 0.7472
Tetradifon 7.91E-06 2.00E-04 0.0132 0.3327
Thiodicarb 7.74E-07 3.30E-05 0.0026 0.1100
Triadimefon 1.33E-05 2.35E-05 0.0443 0.0782
Trifloxystrobin 6.76E-05 7.42E-05 0.1689 0.1856
Triflumizole 4.63E-06 5.37E-05 0.0093 0.1074
Vinclozolin 2.94E-05 8.37E-05 0.2936 0.8370
잔류농약 모니터링 데이터가 충분히 제공되어져야 한다. 경 기도내 유통 과실류의 위해평가 결과는 안전한 수준으로 나 타나 막연한 우려를 가진 소비자들에 대한 교육과 홍보가 활 발히 진행되어야 할 것이며 앞으로도 꾸준한 감시활동을 통 해 안전성을 확보해 나아가야 할 것이다.
Literature Cited
Agrochemicals Use Guide Book (2011) Korea Crop protetion Association.
Cho, Y. S., J. B. Kang, Y. H. Kim, J. A. Jeong, J. W. Huh, S. H. Lee, Y. S. Lim, H. J. Bea, H. G. Kang and J.H. Lee (2011) A survey on pesticide of imported fruits circulated
Gyeonggido. The Report of Gyeonggi-do Institute of Health & Environment 24:85~93.
Food Code, KFDA.
Guidelines for the Risk Assessment (2011) NIFDS.
Han, K. T., H. J. Park, K. S. Lee, I. J. Kim, K. S. Kim and S. M. Cho (2002) Pesticide residue survey and risk assessemnt of fruit in Daejeon. Korean Journal of Environmental Agriculture 21(4):279~285.
http://fse.foodnara.go.kr/residue/index.jsp, 2011.
Hwang, K. H., C. Y. Lee, E. S. Lee, J. H. Uhm, S. H. Han, K. S. Kim, J. H. Kim and S. G. Park (2008) Trend of pesticide residues from agricultural products in Garak wholesale market(2004∼2008). Report of S.I.H.E., 44:35~43.
Hwang, L. H., I. S. Cho, M. J. Kim, T. H. Cho, Y. H. Park, H. W. Park, K. A. Park, H. J. Kim and M. S. Kim (2011) Removal of pesticide residue during the preparation of Baechu Kimchi and Perilla Leaf Pickle. J. Fd. Hyg. Safety
26(4):403~409.
Jeong, Y. H., J. E. Kim, J. H. Kim, Y. D. Lee, C. H. Lim and J. H. Huh (2004) The Latest Pesticides p140. Sigmapress Co.
KCS(Korea Customes Service, 2011) Major Imports Fruits Trends.
Kim, J. Y., C. R. Lee, K. H. Cho, J. H. Lee and K. T. Lee (2009) Antioxidative and Lp-PLA2 inhibitory activities in 29 fruits and vegetables. Korean Journal of Food Preservation 16(4):512~517.
Kim, K. I., H. T. Kim, K. S. Kyung, C. W. Jin, C. H. Jeong, M. S. Ahn, S. W. Sim, S. S. Yun, Y. J. Kim, K. G. Lee, K. D. Lee, W. J. Lee and J. B. Lim (2006) Monitoring of pesticide residues in peppers from farmgate and pepper powder from wholesale market in Chungbuk area and their risk assessment. The Korean Journal of Pesticide Science 10(1):15~21.
Kim, M. J. and E. J. Park (2011) Feature analysis of different in vitro antioxidant capacity assays and their application to fruit and vegetable samples. Journal of the Korean Society of Food Science and Nutrition 40(7):1053~1062.
Kwon, C. H. (2007) Charaterizatim of dissipatim and dietribution of pesticide residues in vegetables and fruits grown in the fields. Daegu University. Ph D. Thesis.
Kwon, S. M., E. H. Park, J. M. Kang, H. C. Jo, S. H. Jin, P.
J. Yu, B. S. Ryu and J. H. Jeong (2010) Pesticide residues survey on agricultural products before auction at whole market in Busan area during 2006∼2008. The Korean Journal of Pesticide Science 14(2):86~94.
Lee, H. D., K. S. Kyung, H. Y. Kwon, Y. B. Ihm, J. B. Kim, S. S. Park and J. E. Kim (2004) Residue characteristics of Hexaconazole and Chlorothalonil in several fruits. The Korean Journal of Pesticide Science 8(2):107~111.
Lee, H. M., J. Y. Han, E. Y. Yoon, H. M. Kim, I. G. Hwang, Choi, D. M. Choi, K. B. Lee, K. P. Won, I. S. Song, S.
E. Park and D. C. Shin (2001) Cumulative risk assessment
of Organophosphorus pesticides in the diet. J. Fd. Hyg.
Safety 16(1):21~26.
Lee, M. G. (2002) Cumulative risk assessment and predictive modeling of pesticide residues in foods. Andong National University. p.5.
Lee, M. G., J. H. Shim, S. H. Ko and H. R. Chung (2010) Research trends on the development of scientific evidence on the domestic maximum residue limits of pesticides.
Food Science and Industry 6:41~66.
Lee, S. C., C. Heo, S. H. Lee, H. P. Kim and M. Y. Heo (2004) Antioxidative activity and protection of oxidative chromosomal damage by vegetables, fruits extract and their functional liquid formulation. Yakhak Hoeji 48(2):111~116.
NAQS (2009), Consumer Awareness Survey Results Related to Agri-food Qualily Control.
Shin, J. M., I. Y. Kim, M. S. Hong, S. J. Jeon, O. J. Tu, Y.
J. Lee, K. Y. Shin and S. G. Park (2007) Status of pesticide residues in agricultural products collected in Gangseo area of seoul in 2007. Report of S.I.H.E. 43:101~112.
The Fourth Korea National and Nutrition Examination Survey(KNHANES Ⅳ-3), 2009, Korea Centers for Disease Conntrol and Prevention.
Trine, K. R., C. L. John and M. Otto (2010) Risk assessment of mixtures of pesticides. Regulatory Tox. & Pharm. 56:
174~192.
WHO (2002) WHO Global Strategy for Food Safety – Safe Food for Better Health.
WHO (2009) Environmental Health Criteria 240 Principles and Methods for the Risk Assessment of Chemicals in Food.
Yang, Y. S., J. M. Seo, J. P. Kim, M. S. Oh, J. K. Chung and E. S. Kim (2006) A survey on pesticide residues of imported agricultural products circulated in Gwangju. Journal of Food Hygiene and Safety 21(2):52~59.
경기도내 유통 과실류의 잔류농약 위해평가(2006~2010)
도영숙* ・ 김중범 ・ 강석호 ・ 김난영 ・ 엄미나 ・ 박용배 ・ 오문석 ・ 윤미혜 경기도보건환경연구원 보건연구기획팀, 수원농산물검사소
요 약 2006년부터 2010년까지 경기도내에서 유통되는 과실류 33품목에 대하여 잔류농약 모니터링을 수행하였다. 총 2,558건 중 431건(16.8%)에서 잔류농약이 검출되었으며, 12건(0.5%)에서 잔류허용기준(MRLs)을 초과하였다. 연간 검출 률은 6.9∼19.4%, 부적합률은 0.3∼0.9%였다. 23품목에서 62종의 잔류농약이 검출되었고, 4품목에서 8종의 농약이 부적합 발생하였다. Chlorpyrifos의 검출빈도가 가장 높았다. 과실류 중 감귤류가 검출률과 부적합률 모두 가장 높았다. 검출빈도는 유기인계 농약이(35%) 가장 많았고, 용도별로는 살충제가(57%) 가장 많았다. 결정론적 만성식이위해평가 결과 위해도 (%ADI)는 전국민 하한치와 상한치가 각각 0.0000∼0.7526과 0.0000∼1.3237이었고, 섭취자군에서는 각각 0.0006∼
9.7801과 0.0058∼15.9528로 나타나 전국민과 섭취자군 모두에서 안전한 수준으로 나타났다.
색인어 잔류농약, 과실류, 위해평가