2008 한국암반공학회춘계학술발표회 / 2008.3.20
Ubiquitous Monitoring by Precise Vision Metrology for Observational Design and Construction Method
in Tunnels
(터널의 정보화 설계시공을 위한 정밀 화상계측법을 이용한 유비쿼터스 계측관리)
Jae-Yun Hwang (황재윤) Policy Research Institute, Busan Metropolitan Council, Busan, 611735, Korea
(부산광역시의회 정책연구실)
1. Introduction
For the purpose of evaluation of the safety of tunnels and underground spaces, m onitoring is carried out to catch the behavior of rock engineering structures. The properties of a rock m ass are im portant factors relevant to the design and construction of rock engineering structures (Ohnishi, 1999; Ohnishi, 2002; Hw ang and Sato, 2004; Hw ang, 2006). M onitoring is a key elem ent for observational design and construction m ethod in tunnels (Hw ang, 2003; Hw ang et al. 2004).
M easurem ent can help determ ine the discontinuity characteristics, the behavior of rock m ass, the depth of the loosened zone, in-situ m odulus, and other item s that m ay be dealt w ith in design.
In the case of tunnel m easurem ent, convergence m easure and electro -optical distance m easuring instrum ents are usually used for inner displacem ent survey and crow n settlem ent survey respectively. W ith an electro-optical distance m easuring instrum ent, the m achine cost is high and m ovem ent of the m achine is difficult. W ith convergence m easure, survey operation cost is high and set of bolt in advance is needed. In addition, w hen m easurem ents of m any points are needed, these m ethods can not be used effectively. The m any disadvantages of these m ethods m ake it preferable for a new m ethod to appear.
2. Advantages of vision metrology
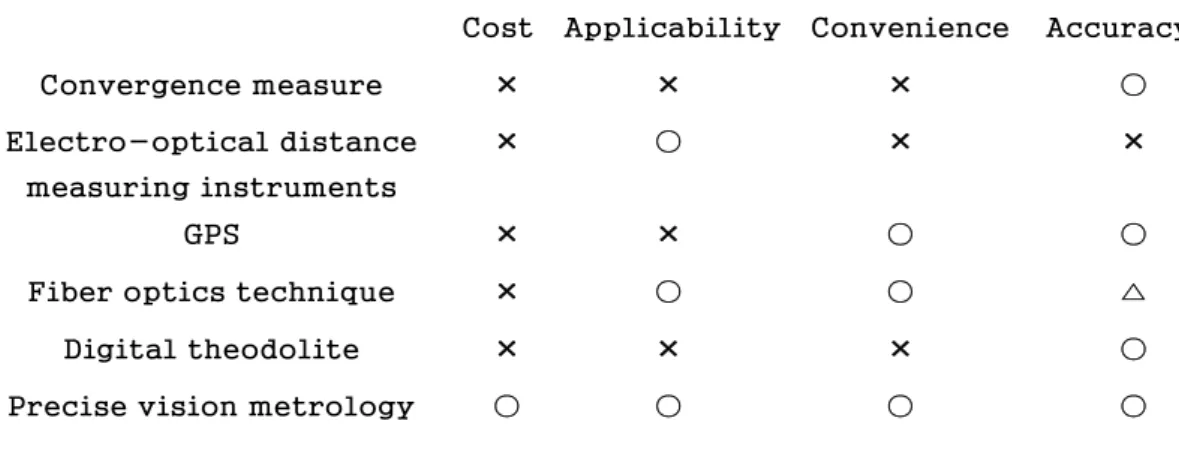
Vision m etrology is now being used in Europe, Japan, and the United States to measure the configuration of relatively large objects such as autom obiles, rockets, and ships. It has been reported that vision metrology system s have delivered accuracies generally about 1:50000 of the principal dim ension of the object. W ith the appearance of high resolution digital cam eras and high speed, large capacity personal computers, it has become relatively sim ple and inexpensive to use. The com parison among the different m ethods used for rock measurement is summ arized in Table 1.
Table 1. Comparison among the methods used for rock measurement
Cost Applicability Convenience Accuracy
Convergence measure × × × ○
Electro-optical distance measuring instruments
× ○ × ×
GPS × × ○ ○
Fiber optics technique × ○ ○ △
Digital theodolite × × × ○
Precise vision metrology ○ ○ ○ ○
Perhaps the forem ost in any discussion of advantages is m easurem ent accuracy and reliability. The reliability of the m easurem ent process is central to any consideration of accuracy. In this regard, visio n m etrology displays considerable advantages over the theodolite system . T he high degree of data redundancy from m ulti-ray triangulation gives it a high statistical reliability. M oreover, in a m ore general reliability context the im age constitutes a perm anent record of the observational data. This is an im portant consideration for quality inspection program s since it provides a degree of traceableness in that coordinate data can be re-m easured as required. This is an im portant consideration for quality control program s since it provides a degree of traceableness in that coordinate data can be re-m easured as required. The second m ajor advantage of industrial vision m etrology is its productivity. T w o factors are of prim e im portance here, the speed of data acquisition and autom ated m easurem ent of photography.
In applications of digital theodolite system s to the inspection of large assem bly m achine w hen it is running, the m achine m ust be taken out of production for an extended period of tim e. By use of vision m etrology, on the other hand, m inim al breakdow n is involved since photography can take
place typically in few m inutes for a sim ple object and a few tens of m inutes for one w hich is of m oderate com plexity. W hile it is true that vision m etrology cannot provide instant 3D coordinate data, such a requirem ent is generally of lim ited consequence in inspection surveys.
W hat is im portant is that the m easurem ent process should cause m inim um disruption to production. The tim e and operator skill level requirem ents of m anual film reading im pede the progress of close range vision m etrology and its application to industrial m easurem ent. W ith autom ated im age m easurem ent this bottleneck has been rem oved. Autom ation substantially im proves both productivity and accuracy, thus presenting a far m ore econom ical and acceptable approach to vision m etrological m easu rem ent.
Vision m etrology is a new and attractive technique in the survey of rock engineering structure. Because the position inform ation of m any points is included in one im age, area m easurem ent can be m ade easily. 3D elem ent of object is m easured, 3D elem ent of displacem ent is also m easured, the shape change of object can thus be obtained. Disp lacem ent survey w ith vision m etrology can be im plem ented rem otely. T he m ethod can be used in field survey w here surveyor can not approach such as a dam or a cliff. Real tim e survey can be realized because the w h ole survey procedures from photography to data reduction take a few m inutes. This leads to the m inim ization and even elim ination of any interruption to the construction processes. The faster feedback allow s checking con struction quality in tim e and revising original design w hen necessary. T he survey system is sim ple because only one CCD cam era and one PC are enough for m easurem ent, and photography is very easy to com plete. T he sim plicity decreases m easurem ent cost to a very low level.
3. Principle of precise vision metrology
Precise vision m etrology is 3D coordinate m easurem ent technology that is based on the principle of photogram m etry. By taking im ages from at least tw o different locations and m easuring the points of interest in each im age, one can develop lines of sight from each cam era location to the points of interest on the object. T he intersection of these pairs of lines of sight can then be triangulated to produce the 3D coordinates of the point on the object. In this w ay, a pair of 2D m easurem ents of x, y positions of a point in each photograph w hich is projected on a 2D plane are used to produce the m easurem ent of the unique X, Y, Z coordinates for the point on the object. There are tw o kinds of photogram m etry. T ypically, they are called stereo photogram m etry and convergent photogram m etry. W ith stereo photogram m etry, operator is essentially m im icking the operations
the hum an eyes perform in providing depth perception. Here, tw o photographs are taken w ith the cam era axes being parallel (Fig. 1(a)), and then the photographs are placed in a specialized instrum ent called a stereo com parator. After an orientation process, the operator can view the tw o photographs stereoscopically, and see the object as a 3D m o del.
Because the operator guides the m easuring m ark to w herever m easurem ent is desired, stereo photogram m etry elim inates the need of targeting as required by convergent photogram m etry. Unfortunately, stereo photogram m etry, although quite appealing in theory, is hard to use in practice in m any industrial applications because of the labor-intensive nature of the m easuring process, and the high degree of operator skill requirem ent. Also, stereo m easurem ent is less accurate than convergent m easurem ent for several reasons. As a result, stereo photogram m etry is not w idely used in industrial applications. The convergent process does not attem pt to use the stereoscopic observation capabilities of hum an vision system to m ake m easurem ent. Instead, photographs are taken w ith the cam era axes typically inclined tow ards each other so that the cam era axes converge or intersect (Fig. 1(b)). One now m easures easily identified features in each photograph, and these m easurem ents are com bined together to produce the 3D coordinates of the points. T o achieve a high degree of reliability, accuracy and autom ation in the m easuring process, one norm ally m easures high-contrast targets placed on or near the points of interest on the object. M ost convergent m easurem ent today is done by use of targets. Unlike the stereo m ethod, the convergent m ethod is not lim ited to using just tw o photographs of an object at a tim e. M any photographs can be taken if desired on one occasion; this leads to higher accuracy and reliability and m akes it far easier to m easure com plex objects w hich can not be com pletely seen in just tw o photograph s. T he vision m etrology system studied herein uses convergent photography.
(a) Stereo photography (b) Convergent photography Fig. 1. Stereo and convergent photography
4. Precise vision metrology measurement system
In order to m easure by precise vision m etrology, a m easurem ent system applying principle of precise vision m etrology is essential. Som e basic hardw are and softw are are required in a m easurem ent procedure in w hich m easurem ent w orks of determ ining the size, shape and m ovem ent of objects are im plem ented as a consequence of analyzing im ages recorded on film or electronic m edia. Based on the basic principle of vision m etrology described above, a developed vision m etrology M easurem ent System is presented in this chapter. T he basic requirem ents of a system for processing digital data w ill differ according to applications. The requirem ents for topographic m apping are based on the need for recording continuous features and for being able to view a com plete overlap of a pair of aerial photographs. For close range w ork, point m easurem ent on sm aller im ages is m ore usual.
A vision m etrological system used for close range w ork has to m eet the follow ing requirem ents: ① capability for self-diagnosis, ② potential for high precision and reliability, and ③ task flexibility w ith respect to 3D object reconstruction functions. A m easurem ent system should not depend solely on the operator’s experience and good judgm ent, but should be supported by a m ore objective statistical evaluation of results. Precision describes the statistical variability of the param eters estim ated in the adjustm ent process. Reliability is the ability to detect the influence of m easurem ent errors. Both the precision and reliability can be im proved by high degree of data redundancy provided by m ulti-ray triangulation. A vision m etrological system is a reconstruction process of 3D object space.
The m easurem ent system by vision m etrology should be flexible enough to be applied to different m easurem ent tasks. In any vision m etrological process, there are tw o m ajor phases: (1) acquiring data from the object to be m easured by taking the necessary im ages and (2) transform ing the im ages into m aps or spatial coordinates, this is, converting the im ages into analog or digital data. Thus, the total vision m etrology system can be subdivided into tw o m ajor divisions, data acquisition and data transform ation. T he data acquisition system is concerned w ith p rocuring w hat m ay be term ed the raw data or raw inform ation. The raw data are realized in term s of the im age. Hence the data acquisition system is concerned w ith obtaining necessary and suitable photography (Atkinson, 1980). The data reduction system is concerned w ith converting the raw data or im ages into a final data form suitable for the intended use of those data. T he final data form m ay be analog, such as a m ap, o r digital,
such as spatial coordinates. T he m easurem ent system used in this study consists of the follow ing steps:
(1) Optim ization design of photographing netw ork (2) T argeting
(3) Photography
(4) Accurate 2D coordinate m easurem ent of targets on im ages (5) Data reduction of 3D coordinates of targets
(6) Output of displacem ent result.
Som e basic hardw are and softw are m ust be provided during these procedures. Fig. 2 illustrates the basic com puter vision m etrology System configuration.
Fig. 2. Precise vision metrology system configuration
Regardless of the nature of the com puter vision m etrological m easurem ent task, a com m on goal should be the m axim ization of overall quality w ithin the constraints im posed by these requirem ents and specifications varied greatly from application to application. In optim izing the m easurem ent operation, usually in term s of accuracy and eco nom y, particular attention m ust be paid to the quality of the photographing netw ork design. Design quality can in turn be expressed through a num ber of goal functions, including precision, reliability, econom y, and diagnosis ability. Of the goal functions m entioned, precision is determ ined at the design stage through the choice of an observation schem e for the netw ork, that is, through the netw ork’s geom etric configuration. The interrelated reliability problem is concerned w ith the ability to detect the influence of m easurem ent errors, that is, w ith the degree to w hich the netw ork is self-checking. T he process of netw ork design optim ization can be carried out through com puter sim ulation. And experience and intuition w ill play an im portant role in netw ork optim ization. T he process of com puter vision m etrology netw ork design optim ization is carried out
through com puter sim ulation.
Norm ally m easurem ents are desired betw een discrete points or a 3D coordinate is desired in relation to one or m ore additional points. The relationship betw een 2D im age coordinate and 3D object coordinate of an object point can be expressed as,
) , , , , , , , , , ,
(X Y Z X0 Y0 Z0 x y y f
x⎥ = Δ Δ
⎦
⎢ ⎤
⎣
⎡ ω ϕ κ
) , (x y
) , , (X Y Z
) , , (X0 Y0 Z0
) , , (ω ϕ κ
) , (Δx Δy
The targets should be high retro-reflective and light in w eight so target can be stick easily to rock surface. The targets used are m ade of a thin, greyish-colored self-adhesive retro-reflective m aterial. The targets are norm ally illum inated by a sm all, battery-pow ered strobe located at the cam era. The use of retro-reflective m aterial greatly sim plifies photography. The strobe m akes exposure of the targets independent of the am bient light level. This m eans the object can be photograp hed in bright light or total darkness, and the target exposure w ill be the sam e.
Furtherm ore, the strobe pow er is low enough that the strobe does not illum inate the object. T hus, the target and object exposures are largely independent, w ith target exposure provided by the strobe, and object exposure provided by the am bient light. By setting the shutter exposure tim e appropriately, one can expose the object to w hatever level desired.
Although one can m ake a norm al exposure, usually the object is significantly underexposed to m ake the target m easurem ent easier and m ore reliable. Retro-reflective targets also m ake m easuring im ages easy.
W ith the background underexposed, only the targets show up on the im age. This greatly sim plifies the m easuring process and allow s fast, reliable and autom ated target m easuring algorithm s to be used. Since the operator is only involved in guiding the process along and not in the actual m easuring of the target centroid, m easuring accuracy is independent of operator skill. Finally, because the targets are illum inated
by a very high-speed flash, the cam era instability is out of th e question.
This m eans the cam era can be used in vibrating environm ents or on unstable platform s such as cranes, m anlifts, and the like, if n ecessary.
This ability to w ork in unstable environm ents is a m ajor advantage of vision m etrology over other high-accuracy, portable m easuring m ethods w hich m ust be stable throughout the m easurem ent.
A cam era is the only m easurem ent device needed for field survey . T he w ays w ith w hich cam eras are used, depending on the application, can be hand held, tripod m ounted or be supported by specialized structures.
Norm ally for static m easurem ents, a single cam era is m oved to each cam era station in succession. This requires that the object under inspection be stable. If the subject of the survey is a study of dynam ics, high-speed cam eras can be used in synchronization, w ith each set of sim ultaneous fram es providing discrete m easurem ents. Once input to the PC, im age processing softw are is used for data transfer and im age generation.
One of the fundam ental steps in vision m etrology survey is the detection and identification of targets appearing on a set of photographic im ages and accurate im age coordinate determ ination. Im age processing has been im proved w ith the advances in m icrocom puters and introduction of digital im age processing. Endless repetitive quantitative m easurem ent is best accom plished by autom atic system s. W ith the introduction o f digital im age processing, m easurem ent points on im ages can be recognized easily by com puter algorithm s. The detection and identification of targets can be im plem ented by tw o step sem i-autom atic processing system so far. First, som e 4-6 points in each im age are identified m anually and an ap proxim ate orientation is perform ed by bundle adjustm ent using these 4-6 points.
Then each point that has to be m easured in at least tw o im ages is identified m anually. The rest of the points can thereafter be detected via epipolar line intersection.
Fig. 3. 2D Coordinate measurement of targets
The com plete autom atic detection of signalized targets is now on the w ay of research. The accuracy of im age coordinate determ ination is a central factor in overall system accuracy (Fig. 3). Vision m etrology requires that the accuracy of im age coordinate m easurem ent be 1 and 0.2 m icron. A num ber of techniques exist for the autom atic determ ination of the im age coordinates of targets, like tem plate m atching, ellip se operators, centroid operators, or other area-based or edge-based techniques in all of w hich the coordinate of target centroid is m easured autom atically. The selection of a suitable technique depends on the size of targets, the contract situation at the object and illum ination influences. B y these operators the accuracy of 1/20… 1/50 pixel in im age space can be achieved usually (M aas, 1994), w hich is by far better than ‘m an ual’
m easurem ent on the screen.
Self-calibrating bundle adjustm ent w ith a num ber of advantages is used for data reduction of 3D coordinates of targets. T he general collinearity equations can be w ritten in the form :
( ) ( ) ( )
( ) ( ) ( )
( ) ( ) ( )
( 0) 32( 0) 33( 0)
31
0 23
0 22 0 21
0 33
0 32 0 31
0 13
0 12 0 11
Z Z a Y Y a X X a
Z Z a Y Y a X X ca y y y
Z Z a Y Y a X X a
Z Z a Y Y a X X ca x x x
H c
H c
− +
− +
−
− +
− +
− − Δ +
=
− +
− +
−
− +
− +
− − Δ +
=
the im age coordinates x ,c yc of object point constitute observations.
There are 3 groups of unknow ns nam ed 3D coordinates of object points (X,Y,Z), interior orientation param eters including focal length c, principal point offsets x ,H yH of im age and perturbation term s Δ ,xΔy accounting for departures from collinearity due to lens and im age distortion, and exterior orientation parameters consisting of sensor position (X0,Y0,Z0), and orientation
) , ,
(ϕ ω κ of each image which constitutes a rotation matrix (Eq. (3)).
⎥⎥
⎥
⎦
⎤
⎢⎢
⎢
⎣
⎡ −
⎥⎥
⎥
⎦
⎤
⎢⎢
⎢
⎣
⎡
⎥ −
⎥⎥
⎦
⎤
⎢⎢
⎢
⎣
⎡
−
=
⎥⎥
⎥
⎦
⎤
⎢⎢
⎢
⎣
⎡
i i
i i
i i
i i
i i
i i
i i i
i i i
i i i
a a a
a a a
a a a
ϕ ϕ
ϕ ϕ
ω ω
ω ω
κ κ
κ κ
cos 0 sin
0 1 0
sin 0
cos
cos sin
0
sin cos
0
0 0
1
1 0 0
0 cos sin
0 sin cos
33 32 31
23 22 21
13 12 11
Eq. (2) is a non-linear function of unknow ns of orientation param eters and coordinates of object point. Its linear form can be w ritten as
x A L= Δ
⎥⎦
⎢ ⎤
⎣
⎡
−
= −
c c
c c
y y
x L x
0
⎥⎥
⎥⎥
⎦
⎤
⎢⎢
⎢⎢
⎣
⎡
∂
∂
∂
∂
∂
∂
∂
∂ ∂
∂
∂
∂
∂
∂
∂
∂
=
oc y ld y op
y op
y
oc x ld x op
x op
x A
c c e c i
c
c c e c i c
[ opi ope ld oc]T
x= Δ Δ Δ Δ
Δ
opi opi =(xH yH c)
ld ld =(k1 k2 k3 p1 p2)
ope ope =(X0 Y0 Z0 ϕ ω κ)
oc oc=(X Y Z)
By use of Least Squares Estim ation, the corrections Δx to approxim ations x0 of unknow ns can be obtained based on the w eighted least squares criterionVTPV →min. Here V is a residual vector of the m easurem ents. In iterative calculation, the result of the first cycle is taken as approxim ation of the second cycle and so on until the correction vector Δxis enough sm all as can be negligible (Eq. (8)).
( )i x( )i x( )i
x = −1 +Δ
Photo 1. Tunnel model and arrangement pattern of targets
5. Model experiment of precise vision metrology measurement system
One tunnel m odel w ith section size 3 m by 3 m consisted of ceiling and 2 w alls at a laboratory is taken as a m easurem ent object for a pilot study (Photo 1). The tests of effectiveness of proposed vision m etrology system consisting of precise adjustm ent softw are and pre-process softw are of precise adjustm ent are carried out on the tunnel m odel at the laboratory.
Photography and 3D data reduction w ere im plem ented on the m odel.
M ovem ent of m icrom eters fixed on m odel w alls is surveyed.
Since the final variance of a displacem ent vector at a point is com puted as a function of the sum m ation of the covariance m atrices obtained in tw o tim es of m easurem ents, one can determ ine a goal m easurem ent precision of the object point coordinates at each m easuring epoch based on error propagation law . Under the assum ption that the vision m etrology netw orks w ill be of the sam e geom etry at the tw o m easuring epochs and m easurem ent precision of point displacem ents is 1 m m , a goal m ean m easurem ent precision σcof XYZ coordinate can be established to be 0.5 m m . Am ongst the salient questions that m ust be addressed regarding the design of the photographing netw ork configuration are the follow ing: W hat photographic scale is required? W hat focal length is optim um to balance considerations of field of view and depth of field versus photographic scale? How m any cam era stations are required? And, in addition to the targets established for purposes of displacem ent m onitoring, w ill further auxiliary points besides of survey point be required? Turning first to the selection of photographic scale, the follow ing em pirical form ula can be em ployed:
σ σc ≈qS
Here, S is the scale num ber, σ is a global estim ate of the standard error of im age coordinate m easurem ents, and q is an em pirical factor ranging from 0.5 to 0.9 for strong netw ork geom etry. As stated above a goal m agnitude of the m ean m easurem ent precision σ of 3D coordinate was c
established as being 0.5 m m . W hen coupled w ith a im age coordinate determ ination precision ofσ =1.0μm and a q value of 0.9, an im aging scale
S /
1 of 1:550 is designed.
In this test w ork, a 28-m m lens is available. Though no m ore ch oices can be m ade, this lens is w ell suitable for this survey w ork. T his facility
enabled both on-the-job optim ization of exposure setting and provided prelim inary verification of im age m ensuration quality. A target array is designed (Photo 1) based on m easurem ent requirem ent and geom etric features of object. T here are total 10 targets pasted on m icrom eters fixed on the m odel w all of w hich 4 targets are on the tw o w alls and 6 targets are on the ceiling.
In preparation for lens and im age distortion com pensation and for further constraints in bundle adjustm ent, 2 scale bars calibrated by transit w ere fastened against a w all in both horizontal and vertical positions.
Three static points w ell distributed in target netw ork are designed as control points. Of three control points, tw o points are fixed on the lift and right w all respectively and one point is fixed on the roof beam near the ceiling. T he coordinates of 3 control points are m easured by 2 sets of transits w ith precision of 20″. Based on Fraser (1984), in order to achieve an optim um control configuration, the array of control points is distributed in such w ay as the centroid of the triangle form ed by the three control points is reasonably close to the target array center and the triangle area is m axim um . Based on Fraser (1989), the statistical reliability of the vision m etrology orientation can be enhanced through the greater redundancy provided by extra targets, and the num ber and distribution of im age points also significantly influences the precision of recovery of sensor calibration param eters in a self-calibration. So, 70 dum m y points w ere set up on the m odel w all to provide a strong geom etric connection.
In all, som e 90 targets w ere to be triangulated at tw o tim es of m easurem ent, 10 of these w ere to act as deform ation m onitoring points and the others as points of vision m etrology precision evaluation.
Based on the selection on cam era, lens, im aging scale and the designed pattern of target array, a proper netw ork geom etry configuration is designed by com puter sim ulation in this study. It facilitates design optim ization through the generation of trial vision m etrology data sets, for w hich error propagation is com puted and netw ork precision is determ ined via the self-calibrating bundle adjustm ent. T he design by sim ulation utilizes coordinates of a representative sam ple of object points of interest.
Then, sequentially, a series of tentative cam era stations is ex am ined.
Once the cam era setup has been established and standard deviations of m easured im age coordinates are input, the hypothetical im age coordinates of object points of interest are com puted. Netw ork precision and accuracy are determ ined via the self-calibrating bundle adjustm ent. Through the generation of trial data sets, a suitable geom etry form of cam era station for this m easurem ent task is determ ined. There are 15 cam era stations, 2
exposures at each station are adopted.
Based on im aging geom etry that any incident ray subtends an angle of m uch larger than 25º w ith the plane surface of the target, plan ar retro-reflective targets instead of spherical one are em ployed. The need to keep target sizes to practical dim ensions is alw ays a concern in vision m etrology especially w hen large objects and sm all im age scales are involved. Fraser (1995) suggested that m inim um m inor diam eter of five pixels, or 45 μm of circular target for the DCS420 is needed. T his w ould require circular retro targets of 15-m m diam eter. Targets w ith diam eter of 15 and 30 m m are used in this study. T he arrangem ent pattern of targets is show n in photo 1. To take all photography in front of the tunnel, targets are fixed by a steel angle.
W ith DCS420, the user can select betw een a m anual m ode and seve ral autom atic or sem i-autom atic exposure program s. For this vision m etrology application auto focus w as sw itched off. Retro-reflective targets gave sufficient light and allow ed the use of sm all iris, so that the cam era could be perm anently focused on infinity. In order to ensure a consistent internal geom etry for the cam era system throughout the photography, precautions w ere taken w ith the lens. T he focus barrel w as shim m ed and taped at the infinity setting to lock it into a stable position. No apparent m ovem ent betw een the lens assem bly and the lens m ount flange of the cam era body w as ensured. Although flash of ring-light is often used, a PE-560M G flash w as proved to perform w ell in illum inating the retro-reflective targets. The proper exposure settings for the im aging of retro-reflective targets, w hich should neither be overexposed nor appear too dark in the digital im ages, cannot be solved by the autom atic exposure program s and require som e experience.
Im age m easuring is initiated by dow nloading the im age into the PC, each im age is brought up on the com puter screen, m easured, and saved.
This can be autom ated to a significant degree using the design data previously obtained or rough XYZ coordinates of at least 4 points surveyed by sim ple tool such as a type m easure in arbitrary reference system . It can also be carried out m anually as the operator desires by m easuring each point one at a tim e if needed. After m any or all of the im ages are m easured the data is m erged together and XYZ coordinates are calculated through a least squares, self-calibrating bundle adjustm ent softw are system .
Results of bundle adjustm ents for the tw o m easurem ents are sum m arized in T able 2. The standard error of im age coordinate m easurem ents σˆ0 is defined by Eq. (10).
n u PV VT
= − ˆ0
σ (10)
w here
V is residual vector of im age coordinates, P is w eight vector for observations, n,u are the num ber of observations and unknow ns respectively.
Table 2. Measurement precision and accuracy Residuals of
image coordinates measurement
(μm)
Standard error of image coordinate measurements
(μm)
Measurement precision of target
coordinates (mm)
Measurement accuracy of displacement
(mm) Epoch Camera
stations
V σˆ0 σXY σZ σc Sd
1 15+4 0.32 0.74 0.08 0.19 0.11
2 15+12 0.23 0.48 0.03 0.09 0.06
0.30
M easurem ent precision of target coordinates σXY,σZ,σc are com puted.
M easurem ent accuracy of displacem ent Sdis com puted. It can be seen that the tw o netw orks have sm all m easurem ent residuals. The standard errors of im age coordinate m easurem ents σˆ0 are 0.74 and 0.48μm . T his level of standard errors of im age coordinate is m uch better than the anticipated one of 1μm . The m ean precision of the tw o netw orks are 0.11 and 0.06 m m respectively, w hich are m uch better than the design specification of 0.5 m m . There are tw o factors contributed to this im provem ent, one is the sm all standard error of im age m ensuration m entioned above, and the other is the use of increasing num ber of exposure stations. In the tw o netw orks 4 and 12 additional cam era stations are used respectively. The precision im provem ents that accom pany the use of an increasing num ber of cam era stations are verified in this study. T his im provem ent is m arked in the first few of increase of cam era stations, as in this case the precision im provem ent from 0.5 to 0.11 m m ow ing to the use of first 4 additional stations is achieved. T he further im provem ent w hen m ore cam era stations are used is in no notable w ay, as in the study the increase num ber of cam era stations from 4 to 12 follow s the precision
im provem ent only from 0.11 to 0.06m m . This indicated that the over increase of cam era stations has little im pact on precision of w ell-designed vision m etrology netw ork. It can also be observed that the w ell-know n discrepancy betw een σxy and σz usually happened in stereo ‘norm al’
instead of convergent netw ork is illustrated. The reason for this is considered as that though the tw o netw orks are basically convergent ones, the ray intersection are lim ited in horizontal plane because the all im ages w ere taken on floor of the laboratory and no station w as distributed at different height along vertical direction for practical operation restrictions.
The final triangulation accuracy for 10 displacem ent points pasted on m icrom eters is 0.30m m , w hich w as the RM S discrepancy in object displacem ents betw een the ‘real value’ of reading of m icrom eter m ovem ents and the com puter vision m etrology result. The result is m uch better than the design specification of 1m m . The sm all im age m ensuration error and the use of additional cam era stations are again held accountable for this. The other notable result is that the RM S discrepancy value sc of
fixed-point coordinates betw een tw o tim es of m easurem ents is 0.5 m m that is significantly larger in m agnitude than the corresponding σc
estim ates. In the presence of com plete functional and stochastic m ethods a basic agreem ent betw een the estim ates sc and σc should be expected.
The reason for this discrepancy is thought to be due to the incom plete m odeling of im age deform ation. One of the significant uncertainties associated w ith the vision m etrology exploitation of CCD arrays rem ains unflatness of im age plane. T he departures from planarity are due to unflatness of the physical chip surface or variations in “depth” of the light sensitive surface; the presence of unflatness w ill give a significant error source that is not generally am enable to com pensation via analytical self calibration techniques. T o date, a m itigating circum stance has been that CCD cam eras used w ith vision m etrology system s have tended to be narrow angled. As CCD arrays get larger and cam era fields of view w ider, how ever, chip unflatness is likely to assum e greater significance as accuracy lim itation factor.
6. Conclusion
In this paper, a new ubiquitous m onitoring by vision m etrology w as proposed as a m easurem ent m ethod for observational design and
construction m ethod in tunnels. Then the m odel experim ent of the ubiquitous m onitoring by precise vision m etrology developed by the author w as carried out in the laboratory. Based on m easurem ent result obtained, it can be concluded that there is substantial potential for the ex ploitation of precise vision m etrology in tunnel m easurem ent.
Acknowledgements
The author is grateful to Prof. Yuzo Ohnishi of the School of C ivil Engineering of Kyoto University, the President of the Japanese Com m ittee for Rock M echanics (Japanese Com m ittee for International Society for Rock M echanics), for his help and encouragem ent in the study.
References
1. Atkinson, K. B., 1980, Developments in close range photogrammetry, Applied Science Publisher Ltd., London.
2. Fraser, C. S., 1984, Netw ork design consideration for non-to pographic photogram m etry, Photogrammetric Engineering and Remote Sensing, 50, 1115-1126.
3. Fraser, C. S., 1989, Optim ization of netw orks in non-topographic photogram m etry, In H. M . Karara Ed., Non-T opographic Photogram m etry, Second Ed. Am erican Society for Photogram m etry and Rem ote Sensing, Falls Church, Virginia, 95-106.
4. Fraser, C. S. and Shortis, M . R., 1995, M etric exploitation of still video im agery, Photogram m etric Record, 15(85), 107-122.
5. Hw ang, J.-Y., 2003, Stability evaluation of rock blocks in tunnels for observational m ethod, Ph.D. Dissertation, Kyoto University, Kyoto, Japan, 289.
6. Hw ang, J.-Y. and Sato, M ., 2004, New practical rock block an alysis for observational design and construction m ethod in large tunnels, Jour. of T unnel Engineeing, JSCE, 14, 17-26.
7. Hw ang, J.-Y., Sato, M ., and Ohnishi, Y., 2004, Q uick evaluation m ethod for discontinuity properties by vision m etrology for observational design and construction m ethod in tunnels, Proc. 33rd Rock M ech ., JSCE, Japan, 187-192.
8. Hw ang, J.-Y., 2006, New observational design and constructio n m ethod for rock block evaluation of tunnels in discontinuous rock m asses, Jour. of KSRM Tunnel & Undergound Space, KSRM , 16, 1-10.
9. M aas, H. G. and Kersten, T., 1994, Digital close-range
photogram m etry for dim ensional checking and control in a shipyard, SPIE Vol. 2350 V ideom etrics Ⅲ , 108-114.
10. Ohnishi, Y., 1999, Survey, analysis and evaluation for discontinuous rock m ass. Soil and Foundation, JGS, 47, 61-62.
11. Ohnishi, Y., 2002, Keynote lecture: Num erical m ethods and tunneling, Proc. of the Fourth Int. Sum m er Sym p., JSCE, Kyoto, Japan, 1-21.