1. Introduction
The logistics industry of China has experienced dramatic changes since the implementation of the reform and open door policy. According to the World
Bank, the average GDP growth rate of China from 1978 to 2014 was 9.83%[1]. And China has invested trillions of money into the infrastructure, such as highway, railway, port and airport. The total length of the highway is 131 thousand kilometers until 2017[2]. And
SNA Approach for Analyzing the Research Trend of China’s Logistics
Shi-cheng Song, Sung-hoon Park, Gi-Tae Yeo
*Incheon National University, Graduate school of Logistics
SNA 분석을 활용한 중국물류 연구동향 분석에 관한 연구
Shi-cheng Song, 박성훈, 여기태*
인천대학교 동북아 물류대학원
Abstract Although there has been a great change in the Chinese logistics industry, there have been few studies on the research trends of logistics in China. Existing research has been conducted on subdivision topics such as transportation efficiency, warehouse location and port efficiency. In this study, the research trends of logistics in China from 2000 to 2017 were analyzed using SNA method. The data were collected from foreign journals and a total of 82 related papers were used for analysis. The first period (2000-2008) was derived from the top keywords such as "Globalization", "Hong Kong", "FDI" and “outsousing”. The results of the second period (2009-2013) were derived from keywords such as "international trade" and "reverse logistics", and in the third period (2013-2017)
"3PL", "warehousing", "railways" “supply chain”, “economic”, “port” and “Belt and Road” The analysis of China’s logistics using SNA method shows that the research trend of China’s logistics is evolving as China is changing rapidly under the globalization context.
Key Words : China, Logistics, SNA, Research trend, Keywords
요 약 중국 물류 산업에 큰 변화가 있었음에도 중국 물류의 연구 동향에 대한 연구는 거의 이루어지지 않았다. 기존 연구는 운송 효율성, 창고 위치 및 항만 효율 등과 같은 세분화된 주제로 연구가 진행되었다. 본 연구에서는 2000년부터 2017년까지 중국 물류의 연구 동향을 SNA방법을 이용하여 분석하였다. 자료는 해외저널에서 수집되었으며, 총 82 개 관련 학술지가 분석대상으로 사용되었다. 2000년에서 2017 년까지 기간을 나누어 분석을 진행하였고, 첫 번째 기간 (2000-2008) 은 "Globalization", "Hong Kong", "FDI" 및 "outsousing"과 같은 키워드가 상위 키워드로 도출되었다. 두 번째 기간 (2009-2013)의 결과는 "internation trade“, 및 "reverse logistics"와 같은 키워드들이 도출되었고, 세 번째 기간(2013-2017) 에는 "3PL", "warehousing", "railways", "supply chain", "economic", "port" 및 "Belt and Road”등의 키워드가 상위로 나타 났다. SNA 방법을 사용한 중국물류 연구 트렌드 분석 결과, 세계화 상황에서 중국이 급속히 변화함에 따라 중국 물류의 연구동향이 진화하고 있음을 보여주고 있다.
주제어 : 중국, 물류, 사회네트워크분석, 연구 동향, 키워드
*Corresponding Author : Gi-Tae Yeo([email protected]) Received March 8, 2018
Accepted May 20, 2018
Revised April 27, 2018 Published May 28, 2018
the total length of operational high speed railway is 22 thousand kilometers until 2016[3]. Besides, according to the World Shipping Organization, among the top 10 world container ports, 7 of them are China’s port, in which the container throughput of Shanghai port has been ranked first in the world for seven consecutive years. Also, China now has become the largest trade partner of more than 130 countries worldwide.
Some scholars analyzed the research trend of China’s logistics a few years ago, and they found that the research about China’s logistics focused mainly on physical movement of goods rather than a supply chain management perspective[4]. These scholars used content-based analysis for studying the research about China’s logistics from 1990 to 2010. In this paper, we built a network through keywords which were collected from academic papers related to China’s logistics. By visualizing the network and analyzing the centrality of each keyword, we can find out the research trend of China’s logistics in different time period.
This paper is divided into five sections. Following the Introduction, the second section is about the previous research focused on China’s logistics. Then the third section is basic information of the Social Network Analysis methodology and the research flow of this paper. And the fourth part handles with analysis and findings. Conclusion, suggestions and future research opportunities are suggested in the fifth part.
2. Literature Review of China’s Logistics
Many researchers had focused on variable situations about China’s logistics field. Shawn and Cui[5] studied the basic problems and solutions of E-commerce logistics in China. It was also one of the first studies researching about E-commerce logistics in China.
Ng[6] focused on the barriers to E-commerce policy in logistics, the Pearl River Delta was specially analyzed because of its major manufacturing base role. Wang
and Xiao[7] analyzed the E-retailing and parcel express industry in China. They found that the average annual growth rate of parcel delivery industry was 36% from 2006 to 2013 while no single parcel delivery company could play a strictly dominating role during the booming period. They also studied the location choice of supply chain based e-merchants distribution center.
Hong and Chin[8] modelled the location choices of foreign investments in China’s logistics industry. They found that the market size, labor cost, logistics partners and labor quality have more obvious effect on location choices. Zhang[9] tried to find the selection criteria of foreign invested enterprises for locations and partners.
Lai, Wu and Wong[10] studied the reverse logistics on China’s manufacture industry. They found that the adoption of reverse logistics by China’s manufacturers improved the environmental and financial profits, but not social gains. Vlachos[11] focused on the impact of reverse logistics capabilities on firm performance.
Shi, Zhang, Arthanari, Liu and Cheng[12] studied the third-party purchase (3PP) in China’s context as an important value-added service offered by third-party logistics. Rahman et al. [13] aimed to identify and prioritize the challenges of multinational third-party logistics service providers in China. And they found that the main challenges are guanxi, government regulations, price pressure and transportation cost, in which the guanxi network is the most important factor.
Chu[14] studied supply chain dependency by using guanxi as a dependence coping strategy in China. Xi and Cai[15] studied energy supply chain by improving the supply chain efficiency, their study is based on a life-cycle perspective. Kuei and Madu[16]analyzed the important factors which affect the Chinese firms’
adoption of green supply chain practices. They adopted
the Partial Least Squares method to identify the critical
factors of green supply chain practices. The result
showed that the lack of understanding and studying of
green supply chain practices is the main problem to
undertake green practices. Pan and Li[17] used a
system dynamic method to analyze China’s oil supply
chain and energy security issues.
Qiu[18] analyzed the coastal ports reform in China.
They concerned about the economic background, the motivations, the progress of the reforms and the national layout plan for coastal ports. Cheng and Yang[19] adopted the Nash equilibrium to analyze the port investment in multi-port region of China.
3. Methodology 3.1 Research flow
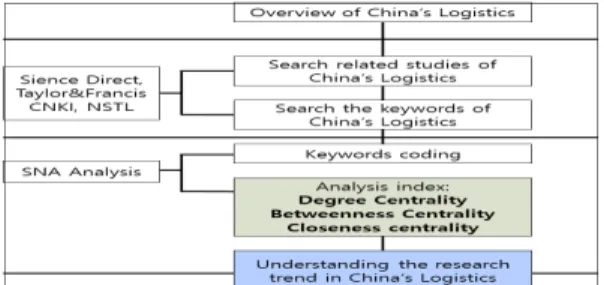
The detailed research flow of this research is shown in Fig. 1 below. The first part introduced the development path and the current situation of China’s logistics industry. Rapid development taken place in China’s logistics industry since the open up and reform policy and the maturity of the industry is increasing year by year. The second part, we collected studies related to China’s logistics from the major journals, including Science Direct, Taylor&Francis, CNKI and NSTL. These studies are all published during 2000 to 2017. Then we summarized the keywords from these articles. The next step was coding these keywords as a database for SNA analyzing. The degree centrality and betweenness centrality were analyzed. Also, the visual representation of the research trends of China’s logistics were obtained.
Fig. 1. Research Flow
3.2 Social Network Analysis
This study used the Social Network Analysis method to analyze the research trend of China’s
logistics. And the data was analyzed by Netminer, the network analysis software. and the visualizing graph was drawed by NetDraw. The Social Network Analysis method was invented by Barnes back to the year 1954. He focused on group communication and studied the relationship of network centrality and group influence[20]. The core idea of SNA method is to analyze the patterns of connection. In this research, we applied the academic networks, which emphasized the researchers and scholars particularly in order to analyze the research trend of China’s logistics. Then it is suitable for academic network analysis[21].
According to Uddin et al.[22] research, author-selected keywords can represent the subject matter of articles because keywords represent authors’ understandings of their research. Also Guo et al. and Choi [23,24] stated that Keywords have been widely utilized to reveal the research domains. The research trend is the trend of research domains in a certain time scale. Thus research trends are evolving in consistent with the evolving of keywords in a specific period of time. And we used degree centrality, betweenness centrality and closeness centrality indexes for analyzing the research trend of China’s logistics.
3.3 Degree centrality
Degree centrality shows the number of direct ties linked to a node[25]. The higher the degree centrality is the more direct ties linked to the node. It means that the node shares more importance in the network. In this research, it means the keyword is located in the center of the visualized keywords network. Generally degree centrality means absolute degree centrality.
namely it shows the number of nodes are connected in
network, but this degree centrality’s value is depend on
the number of nodes. For compare with other
centralities we use relative centrality, and it can be
called nomalized degree centrality. it shows nomalized
degree centrality result. it defined as follows.
is
absolute degree centrality result, and is the number
of whole node of the network[26].
(1)
3.4 Betweenness centrality
Betweenness centrality shows the broker role of a node in the network. It is calculated as the number of shortest paths from all vertices to all other nodes that pass through that node. It means that the node has more intermediary role in the network which can be the bridge to other nodes[27]. In this paper, if a keyword has more betweenness centrality value, it means that the keyword appeared in more papers. Betweenness centrality is expressed as follows[28].
(2)
3.5 Closeness centrality
Finally, Closeness centrality is the concept of the distance between nodes on the network using the sum of the shortest distances to find the node that is the center of the entire network. In this method, the shortest distance from all the nodes is
which connects both nodes and . The shortest path distance, g is the number of nodes in the network, and
for standardization[29]. In order to express the shortest distance from the node to the other nodes, the following equation (3) below is used..
(3)
4. Analysis and Findings 4.1 Data Collection
Before analyzing the research trend of China’s logistics, the first step is to collect data by identifying academic papers related to China’s Logistics. Since this paper aimed to study the research trend of China’s logistics, the data sources are including CNKI (China
National Knowledge Internet), NSTL (National Science and Technology Library), Science Direct and Taylor &
Francis. The second step is to search for papers which output the terms “China” and “logistics”, then to identify the keywords of each paper[30].
After searching for papers connected to “China” and
“logistics”, 82 published academic papers are found from 2000 to 2017. Furthermore, the keywords of each paper are summarized as original database for deeper analysis. The year 2008, the financial crisis swept the world, at that time, Chinese government launched the famous “4 trillion plan” to help Chinese economy recover from the crisis. And the year 2013, the Chinese president Xi jinping firstly talked about the “Belt and Road Initiative” which represented a new era of China.
Thus, the year 2008 and 2013 both had special meaning for China[31]. Therefore, in order to analyze the research trend of China’s logistics step-by-step, the whole time span from 2000 to 2017 are divided into three periods: 2000-2008, 2009-2013, and 2014-2017.
4.2 First period (2000-2008)
Fig. 2 is a visual representation of the keyword network of these identified research papers from the period 2000-2008. Table 1 shows the degree centrality, betweenness centrality and closeness centrality values[32].
As we can see below Table 1, “China” and
”Logistics” recoded high closeness centrality, So,
“China” and “logistics” are located in the center of the network. Then “Hong Kong”, “tourism”, “globalization”,
“container throughput” and outsourcing, Also we can
see keyword such as “financing“ including FDI,
financial services, financial management, financing
business as important nodes. This indicates that during
this period, most of the research studies about China’s
logistics were influenced by the trend of globalization,
and in China, logistics industrial was influenced by
foreign investment. They established the standard for
foreign capital to invest in China’s logistics field. “Hong
Kong”, “globalization” and “tourism” show the highest
betweenness centrality in this period, this indicates that
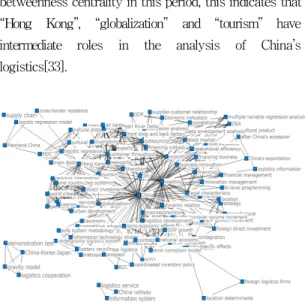
“Hong Kong”, “globalization” and “tourism” have intermediate roles in the analysis of China’s logistics[33].
Fig. 2. Result of visualizing keywords in 2000-2008
Table 1. Normalized data of 3 centrality (2000-2008)
4.3 Second period (2009-2013)
Fig. 3 is a visual representation of the keyword network of published research papers from the period 2009-2013. Table 2 shows the degree centrality, betweenness centrality and clossness centrality values of the keywords in detail.
Fig. 3. Result of visualizing keywords in 2009-2013
Table 2. Normalized data of 3 centrality 2009-2013
No. Keyword Deg. Bet. Close.
1 China 0.833 0.523 0.841
2 logistics 0.608 0.228 0.688
3 Hong Kong 0.275 0.063 0.535
4 tourism 0.245 0.010 0.525
5 globalization 0.157 0.005 0.498
6 outsourcing 0.147 0.001 0.495
7 air cargo 0.137 0.000 0.492
8 container throughput 0.137 0.000 0.492
9 experts 0.137 0.000 0.492
10 FDI 0.137 0.000 0.492
11 front shop and back factory 0.137 0.000 0.492
12 Guangdong 0.137 0.000 0.492
13 imports 0.137 0.000 0.492
14 Pearl River Delta 0.137 0.000 0.492
15 reexports 0.137 0.000 0.492
16 Shenzhen 0.137 0.000 0.492
17 casinos 0.127 0.000 0.479
18 direct investment 0.127 0.000 0.479
19 dynamic relation 0.127 0.001 0.481
20 financial services 0.127 0.000 0.479
21 gambling 0.127 0.000 0.479
22 Macao 0.127 0.000 0.479
23 one country two systems 0.127 0.000 0.479
24 regional intergration 0.127 0.000 0.479
25 trade and logistics 0.127 0.000 0.479
26 urban development 0.127 0.000 0.479
27 world cities 0.127 0.000 0.479
28 3PL 0.108 0.003 0.476
29 cointegration analysis 0.108 0.000 0.476
30 error correction 0.108 0.000 0.476
31 error correction model 0.108 0.000 0.476
32 GDP growth 0.108 0.000 0.476
33 logistics development 0.108 0.000 0.476
34 macroeconomics 0.108 0.000 0.476
35 national economy 0.108 0.000 0.476
36 socio-economic effects 0.108 0.000 0.476 37
traffic turnover volume
increment 0.108 0.000 0.476
38 business innovation 0.088 0.000 0.471
39 financial management 0.088 0.000 0.471
40 financing 0.088 0.000 0.471
41 financing business 0.088 0.000 0.471
42 innovation management 0.088 0.000 0.471
43 legal characteristics 0.088 0.000 0.471
44 legislation 0.088 0.000 0.471
45 SMB financing 0.088 0.000 0.471
46 DEA 0.078 0.000 0.468
47 financing cutback 0.078 0.000 0.468
48
multiple variable regression
analysis 0.078 0.000 0.468
49 operational efficiency 0.078 0.000 0.468
50 regression analysis 0.078 0.000 0.468
No. Keyword Deg. Bet. Close.
1 China 0.817 0.619 0.817
2 logistics 0.141 0.005 0.447
3 reverse logistics 0.127 0.004 0.443
4 casuality 0.099 0.000 0.435
5 vector autocorrelation 0.099 0.000 0.435
6 time series analysis 0.099 0.000 0.435
7 Japan import 0.099 0.000 0.435
8 US 0.099 0.000 0.435
9 Australia 0.099 0.000 0.435
In this second period, except for “China” and
“logistics”, and about methodology keyword, “reverse logistics” and “international trade” shared high degree centrality value. and we can see “reverse logistics”,
“ecosystem management”, “environmental protection”, are appeared in high position, this means more researchers focused on environmental pollution, also tried to solve the logistics problems brought by the dramatic increase of massive goods[34]. Besides,
“multinational logistics”, “Japan import” “Australia”
and “US” showed high degree centrality value as well.
That indicates in this period, the logistics industrial of
China became more international and mature. At the same time, “logistics”, “China”, and “reverse logistics”
showed high betweenness centrality value as intermediate roles. Also we can see from Fig. 3 and from the detailed centrality in Table 2, words related to
“globalization”, “global competitiveness”, “multinational logistics” take a high percentage, this demonstrated the trend of connectivity in China’s logistics industrial again[35].
4.4 Third period (2014-2017)
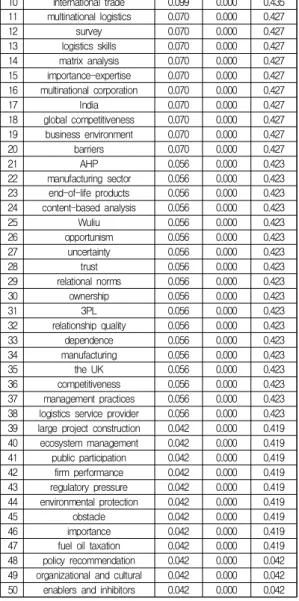
Fig. 4 is a visual representation of the keyword network of published research papers from the period 2014-2017. Table 3 shows the degree centrality, betweenness centrality, and closeness centrality values of the keywords in detail.
Fig. 4. Result of visualizing keywords in 2014-2017
The above figure shows the visualization of keyword networking in 2014-2017, from which we can easily notice that “China” and “Logistics” are located in the center of this network. And there obviously are more nodes in this period, this means in recent years, the academic studies about China’s logistics are increasing.
Table 3 Normalized data of 3 centrality 2014-2017
10 international trade 0.099 0.000 0.435
11 multinational logistics 0.070 0.000 0.427
12 survey 0.070 0.000 0.427
13 logistics skills 0.070 0.000 0.427
14 matrix analysis 0.070 0.000 0.427
15 importance-expertise 0.070 0.000 0.427
16 multinational corporation 0.070 0.000 0.427
17 India 0.070 0.000 0.427
18 global competitiveness 0.070 0.000 0.427
19 business environment 0.070 0.000 0.427
20 barriers 0.070 0.000 0.427
21 AHP 0.056 0.000 0.423
22 manufacturing sector 0.056 0.000 0.423
23 end-of-life products 0.056 0.000 0.423
24 content-based analysis 0.056 0.000 0.423
25 Wuliu 0.056 0.000 0.423
26 opportunism 0.056 0.000 0.423
27 uncertainty 0.056 0.000 0.423
28 trust 0.056 0.000 0.423
29 relational norms 0.056 0.000 0.423
30 ownership 0.056 0.000 0.423
31 3PL 0.056 0.000 0.423
32 relationship quality 0.056 0.000 0.423
33 dependence 0.056 0.000 0.423
34 manufacturing 0.056 0.000 0.423
35 the UK 0.056 0.000 0.423
36 competitiveness 0.056 0.000 0.423
37 management practices 0.056 0.000 0.423
38 logistics service provider 0.056 0.000 0.423 39 large project construction 0.042 0.000 0.419
40 ecosystem management 0.042 0.000 0.419
41 public participation 0.042 0.000 0.419
42 firm performance 0.042 0.000 0.419
43 regulatory pressure 0.042 0.000 0.419
44 environmental protection 0.042 0.000 0.419
45 obstacle 0.042 0.000 0.419
46 importance 0.042 0.000 0.419
47 fuel oil taxation 0.042 0.000 0.419
48 policy recommendation 0.042 0.000 0.042
49 organizational and cultural 0.042 0.000 0.042 50 enablers and inhibitors 0.042 0.000 0.042
No. Keyword Deg. Bet. Close.
1 China 0.832 0.693 0.836
2 logistics 0.305 0.059 0.522
3 3PL 0.130 0.005 0.464
4 warehousing 0.107 0.000 0.462
5 total logistics service 0.107 0.000 0.462
6 TLS 0.107 0.000 0.462
7 RFBP 0.107 0.000 0.462
8 railways 0.107 0.000 0.462
Combined with the degree centrality values, the keywords “3PL”, “warehousing”, “total logistics service”, “supply chain”, “railways”, “port”, “Belt and Road” and about economic keyword. have relatively higher degree centrality value[36]. In this regard, firstly, the degree centrality value of “supply chain”
increased, which indicates more attention is paid to the integration of the whole supply chain and further evolution of the logistics industry were happening[37].
Secondly, the relatively higher degree centrality value of railway-related keywords shows that the rapid
development of China’s infrastructure has a big impact on the academic research, which also laid a solid foundation for the development of logistics industrial.
Thirdly, the keywords “Belt and Road”, “Maritime Silk Road” and “port” represent that the research papers were highly related to the actual social and economic development which owning to the Chinese national strategy, the “Belt and Road Initiative”, and the rapid development of China’s ports[38]. As to intermediate roles, the keywords “port”, “supply chain” and
“economic growth” have a higher value of closeness centrality even degree centrality is low than other keywords. It means, from the overall point of view, it can be seen that the research through these keywords was used as a research topic in many fields in logistics during the period of 2014-2017.
5. Conclusion
The evidence provided in this paper shows that the research trend of China’s logistics has a close relation to actual social economic development. This study analyzed research trend of China’s logistics using Social Network Analysis, and, in order to analyze specifically, the whole time span is divided into three periods from 2000 to 2017. According to the analysis, research studies in the first period (2000-2008) mainly focused on keywords like “Foreign Direct Investment”,
“tourism”, “globalization” and “outsourcing”. Then in the next period (2009-2013), the keywords
“international trade”, “3PL” and “reverse logistics” have higher degree centrality values. Last period (2014-2017) the concentration shifted to keywords such as “Belt and Road” and “supply chain”. And the degree centrality value of keyword “3PL” increased. Also, the railway-related keywords are increasing throughout the third periods. The different value of the same keyword in different periods indicates the diffusion of research studies because of the social and economic situation and the change of policy at that time.
The transformation of keywords shows the research
9 railway market shares 0.107 0.000 0.462
10 railway freight 0.107 0.000 0.462
11 rail transportation 0.107 0.000 0.462
12 planning 0.107 0.000 0.462
13 freight handling 0.107 0.000 0.462
14 Economic indicators 0.107 0.000 0.462
15 business process design 0.107 0.000 0.462
16 adoptability analysis 0.107 0.000 0.462
17 supply chain 0.107 0.004 0.462
18 port 0.099 0.079 0.469
19 shipping 0.092 0.002 0.454
20 Belt and Road 0.069 0.001 0.448
21 distribution 0.069 0.000 0.452
22 logistics outsourcing 0.069 0.001 0.448
23 economic growth 0.061 0.004 0.462
24 airport 0.061 0.001 0.447
25 offshore wind 0.053 0.000 0.445
26 life-cycle 0.053 0.000 0.445
27 green transformation 0.053 0.000 0.445
28 Europe 0.053 0.000 0.445
29 Asia 0.053 0.000 0.445
30 waterfront redevelopment 0.046 0.000 0.443
31 transport network 0.046 0.000 0.443
32 port system 0.046 0.000 0.443
33 multimodal transport 0.046 0.000 0.443
34 coal 0.046 0.000 0.443
35 bulk 0.046 0.000 0.443
36 risk-cost modelling 0.046 0.000 0.313
37
multiple criteria
decision-making 0.046 0.000 0.313
38 maritime risk 0.046 0.000 0.313
39 Greater China 0.046 0.000 0.313
40 climate change 0.046 0.000 0.313
41 adaptation 0.046 0.000 0.313
42 Maritime Silk Road 0.046 0.000 0.443
43 hub ports 0.046 0.000 0.443
44 hub dimension 0.046 0.000 0.443
45 Kra canal 0.046 0.000 0.443
46 quantitative model 0.046 0.000 0.447
47 internationalization strategy 0.046 0.000 0.447
48 B2C e-commerce 0.046 0.000 0.447
49 apparel industry 0.046 0.000 0.447
50 relationship flexibility 0.046 0.000 0.443