265 DOI: 10.4196/kjpp.2010.14.5.265
ABBREVIATIONS: FCO, Follicular cystic ovary; FCFs, follicular cystic follicles; DEG, differentially expressed genes; ACP, annealing control primer; RPL15, ribosomal protein L15; MAP1B, microtubule- associated protein 1B; HPO, hypothalamus-anterior pituitary-ovary;
E
2, 17β-estradiol; P
4, progesterone; HE, hematoxylin-eosin; TUNEL, terminal deoxynucleotidyl transferase mediated dUTP nick-end labeling; TESS, transcription element search system; HRE, hormone response elements; AP-1, activator protein 1.
Received June 2, 2010, Revised August 16, 2010, Accepted August 25, 2010
Corresponding to: Dawon Kang, Department of Physiology, Institute of Health Sciences, Gyeongsang National University School of Medicine, 90, Chilam-dong, Jinju 660-751, Korea. (Tel) 82-55-751-8744, (Fax) 82-55-759-0169, (E-mail) [email protected]
Identification of Differentially Expressed Genes in Bovine Follicular Cystic Ovaries
Changyong Choe
2, Young-Woo Cho
1, Chang-Woon Kim
3, Dong-Soo Son
2, Jaehee Han
1, and Dawon Kang
11
Department of Physiology, Institute of Health Sciences, Gyeongsang National University School of Medicine, Jinju 660-751,
2Animal Genetic Resources Station, National Institute of Animal Science, RDA, Namwon 590-832,
3Department of Obstetrics and Gynecology, Samsung Changwon Hospital, Sungkyunkwan University School of Medicine, Changwon 630-723, Korea
Follicular cystic ovary (FCO) is one of the most frequently diagnosed ovarian diseases and is a major cause of reproductive failure in mammalian species. However, the mechanism by which FCO is induced remains unclear. Genetic alterations which affect the functioning of many kinds of cells and/or tissues could be present in cystic ovaries. In this study, we performed a comparison analysis of gene expression in order to identify new molecules useful in discrimination of bovine FCO with follicular cystic follicles (FCFs). Normal follicles and FCFs were classified based on their sizes (5 to 10 mm and ≥25 mm). These follicles had granulosa cell layer and theca interna and the hormone 17β-estradiol (E
2)/ progesterone (P
4) ratio in follicles was greater than one. Perifollicular regions including follicles were used for the preparation of RNA or protein. Differentially expressed genes (DEG) that showed greater than a 2-fold change in expression were screened by the annealing control primer (ACP)-based PCR method using GeneFishing
TMDEG kits in bovine normal follicles and FCFs. We identified two DEGs in the FCFs: ribosomal protein L15 (RPL15) and microtubule-associated protein 1B (MAP1B) based on BLAST searches of the NCBI GenBank. Consistent with the ACP analysis, semi-quantitative PCR data and Western blot analyses revealed an up-regulation of RPL15 and a down-regulation of MAP1B in FCFs. These results suggest that RPL15 and MAP1B may be involved in the regulation of pathological processes in bovine FCOs and may help to establish a bovine gene data-base for the discrimination of FCOs from normal ovaries.
Key Words: Gene expression, Estrogens, Follicular cyst
INTRODUCTION
Follicular cystic ovary (FCO) is one of the most frequently diagnosed ovarian diseases and is a major cause of re- productive failure in mammalian species. FCO occurs when a mature follicle fails in ovulation due to disruption of the hypothalamus-anterior pituitary-ovary (HPO) axis by a va- riety of factors [1,2]. In FCO, affected follicles show delayed regression with persistent follicle growth and secretion of steroid hormones. However, the mechanism by which FCO is induced remains unclear.
Genetic alteration affects the functioning of many kinds of cells and/or tissues [3,4]. However, little is known about the genetic alterations that may be involved in FCO. A re- cent study reported that granulosa cells from persistent fol- licles of cattle showed altered gene expression compared with growing follicles [5].
In this study, we performed a comparison analysis of gene expression using annealing control primer (ACP)-based GeneFishing PCR in order to identify new molecules useful
in discrimination of bovine FCOs in ovaries with and with- out cystic follicles.
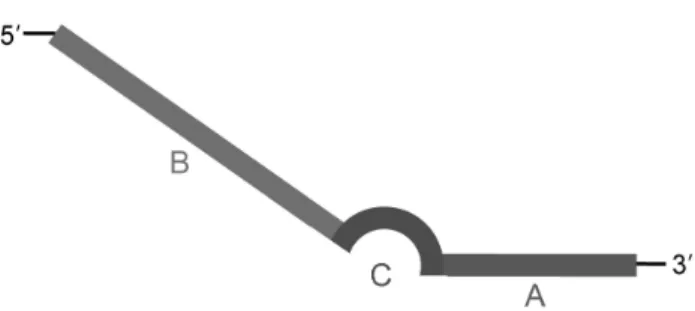
The ACP used in this study is composed of three parts.
Its distinct 3’- and 5’- end portions are separated by a regu- lator, that specifically targets sequence hybridization to the template via a polydeoxyinosine linker. Base pairs formed by the universal base, inosine, of the polydeoxyinosine link- er have a much lower melting temperature (Tm) than base pairs formed by the common bases, adenine, guanine, cyto- sine, and thymine. Thus, the regulator forms a ‘bubble-like’
structure at annealing temperatures and maximizes PCR specificity by preventing nonspecific binding of the primer to a template [6,7].
METHODS Samples
Bovine ovaries at follicular phase were collected from a
Fig. 1. The structure of annealing control primer (ACP). The ACP is composed of three sequence regions. (A) Target core sequence (3’- end targeting portion; 10 nts) containing a hybridizing sequence substantially complementary to a site on a template nucleic acid (B) Universal sequence (5’- end portion; 22 nts) (C) Regulator sequence (linker portion separated 3’- end portion and 5’- end portion; 5 nts).
slaughterhouse and transported to the laboratory within 2 hrs on ice, either in RNAlater solution (Qiagen, GmbH, Hilden, Germany), in ice-cold phosphate buffered saline (PBS), or in 37
oC pre-warmed PBS containing 100 IU/ml of penicillin and 0.1 mg/ml streptomycin. Ovaries with (n=30) or without (n=40) follicles greater than 25 mm in diameter were used in this study. Ovaries with follicles greater than 25 mm in diameter in the absence of a corpus luteum in both the right and left ovaries were classified as FCOs. Follicular cysts were diagnosed based on macro- scopic and endocrinological characteristics [8]. The fol- licular walls of the cysts were thin and translucent [9]. We observed healthy follicles (3 to 5 mm and 8 to 10 mm) in ovaries without follicles greater than 25 mm in diameter.
All experiments were performed with the approval of the Animal Ethics Committee of Gyeongsang National University.
Samples of perifollicular regions, including large follicles were cut with a razor blade and used for the preparation of RNA or protein. Follicular fluid (FF) was carefully aspi- rated from cystic and non-cystic healthy follicles with a 10 ml syringe fitted with an 18 or 23 gauge needle; the fluid was centrifuged at 1,750 × g for 10 min and stored at −20
oC until hormone measurement. 17β-estradiol (E
2), progester- one (P
4), and testosterone concentrations were measured in follicular fluid of each follicle, or, for small size follicles (3 to 5 mm) after pooling fluid from 10 individual follicles.
Assay for estrogen, progesterone, and testosterone Concentrations of E
2, P
4, and testosterone in follicular fluid were measured using the Dissociation Enhanced Lanthanide Fluorescence Immunoassay system (DELFIA, PerkinElmer Life and Analytical Sciences, Wallac Oy, Truku, Finland) according to the manufacturer’s protocol.
Briefly, each strip was washed with DELFIA Platewash and 25 μl of E
2standards or follicular fluid samples were placed in the strip wells. Then, 100 μl of diluted E
2anti- serum solution was added to each well and the frame was incubated for 30 min at room temperature with slow shaking. The 100 μl of diluted E
2(50:1) solution was then added to each well and the frame was incubated for 2 h at room temperature with slow shaking. After the in- cubation step, each strip was washed six times and en- hancement solution (200 μl) was directly added to each well. The frame was slowly shaken for 5 min. Fluorescence was measured in a time-resolved fluorometer (Wallac 1420 VICTOR
2D multicounter 1420, PerkinElmer) within 1 h af- ter shaking. These experiments were performed in dupli- cate each time for both standards and follicular fluids. P
4and testosterone were also measured using the same proto- cols as for E
2measurement, except that trace dilution was performed before antiserum treatment.
Hematoxylin-eosin (HE) staining
The ovaries were washed in 0.1 M PBS, fixed with 4%
(w/v) paraformaldehyde in 0.1 M PBS, and processed into paraffin sections cut 4 μm thick. In order to examine the physiological aspects of follicles and to confirm the presence of granulosa cells, the sections were processed for HE staining. Sections were air-dried on gelatin-coated slides, deparaffinized, washed with tap water for 5 min, immersed in hematoxylin for 5 min and checked for complete staining in tap water. Eosin staining was performed for 3 min.
Sections were dehydrated through a graded series of alco-
hols (70% to 100% ethanol, 3 min each), cleared in xylene, and mounted with coverslips. Stained sections were photo- graphed using a BX-51microscope (Olympus, Tokyo, Japan) and a high-resolution video camera (Camedia C-7070; Olympus, Tokyo, Japan). Five sections from each sample were evaluated.
Analysis of apoptosis
To observe apoptosis in bovine cystic ovaries, terminal deoxynucleotidyl transferase mediated dUTP nick-end la- beling (TUNEL) analysis was performed using an in situ cell death detection kit (Roche Applied Science, GmbH, Penzberg, Germany). Paraffin-embedded ovary sections were depar- affinized and rehydrated, washed in PBS, treated with 3%
H
2O
2for 5 min to inactivate endogenous peroxidase, and incubated in permeabilization solution (0.5% Triton X-100 and 0.1% sodium citrate in PBS) for 30 min at room tempe- rature. The slides were rinsed twice with PBS. Negative and positive controls were prepared. Negative controls were incubated in label solution without terminal transferase.
Positive controls were incubated with recombinant DNase I (400 U/ml) for 60 min at 37
oC prior to incubation in TUNEL reaction mixture. Positive controls and samples were incubated in TUNEL reaction mixture for 60 min at 37
oC in a humidified atmosphere in the dark. After wash- ing, samples were embedded with Antifad (Invitrogen, Carlsbad, CA, USA) and analyzed using confocal laser scan- ning microscope (IX70 Fluoview, Olympus, Tokyo, Japan).
ACP-based GeneFishing
TMPCR
Total RNA extracted from bovine follicles was used for the synthesis of first-strand cDNAs by reverse transcrip- tase. Reverse transcription was performed for 1.5 h at 42
oC in a final reaction volume of 20 μl containing 3 μg of puri- fied total RNA, 4 μl of 5× reaction buffer (Promega, Madison, WI, USA), 5 μl of dNTPs (each 2 mM), 2 μl of 10 μM dT-annealing control primer (ACP)1 (5’-CGTGA- ATGCTGCGACTACGATIIIIIT(18)-3’), 0.5 μl of RNasin
ⓇRNase inhibitor (40 U/μl; Promega), and 1 μl of Moloney murine leukemia virus reverse transcriptase (200 U/μl;
Promega). First-strand cDNAs were diluted by the addition
of 80 μl of ultra-purified water for GeneFishing
TMPCR and
stored at −20
oC until use.
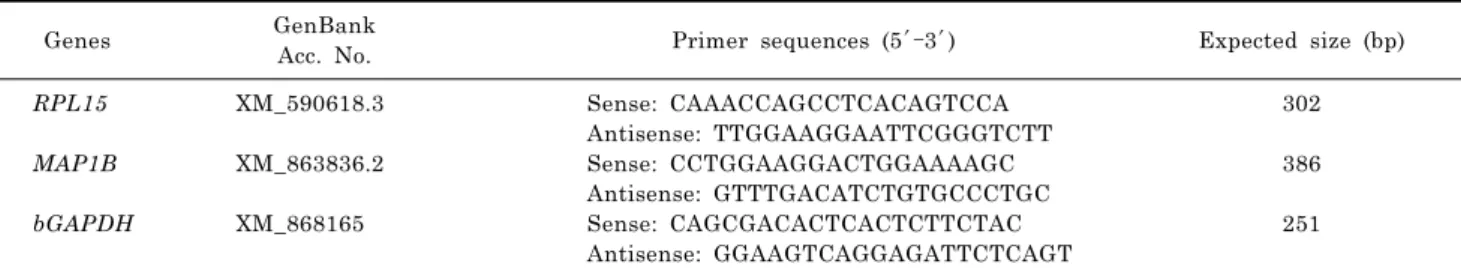
Table 1. Primer sequences used for RT-PCR
Genes GenBank
Acc. No. Primer sequences (5′–3′) Expected size (bp)
RPL15 MAP1B bGAPDH
XM_590618.3
XM_863836.2
XM_868165
Sense: CAAACCAGCCTCACAGTCCA Antisense: TTGGAAGGAATTCGGGTCTT Sense: CCTGGAAGGACTGGAAAAGC Antisense: GTTTGACATCTGTGCCCTGC Sense: CAGCGACACTCACTCTTCTAC Antisense: GGAAGTCAGGAGATTCTCAGT
302
386
251 Differentially expressed genes (DEG) were screened by
the ACP-based PCR method [7] using GeneFishing
TMDEG kits (Seegene, Seoul, Korea). Briefly, second-strand cDNA synthesis was performed at 50
oC during one cycle of first-stage PCR in a final reaction volume of 20 μl contain- ing 3∼5 μl (about 50 ng) of diluted first-strand cDNA, 1 μl of dT-ACP2 (10 μM), 1 μl of 10 μM arbitrary ACP, and 10 μl of 2× Master Mix (Seegene). The PCR protocol for second-strand synthesis was one cycle at 94
oC for 1 min, 50
oC for 3 min and 72
oC for 1 min. After second-strand DNA synthesis was complete, the second-stage PCR amplifica- tion protocol was 40 cycles of 94
oC for 40 s, 65
oC for 40 s, 72
oC for 40 s, followed by a 5 min final extension at 72
oC.
The amplified PCR products were separated in 2% agarose gels and stained with ethidium bromide. Differentially ex- pressed bands were extracted from the gel using the GENCLEAN
ⓇII Kit (Q-BIO gene, Carlsbad, CA, USA) and directly sequenced using an ABI PRISM
Ⓡ3100 Genetic Analyzer (Applied Biosystems, Foster City, CA, USA). The ACP primer system has a unique structure including a reg- ulator composed of a polydeoxyinosine linker (Fig. 1).
Reverse transcriptase polymerase chain reaction (RT- PCR)
The DEG expression level was confirmed by RT-PCR us- ing each gene-specific primer pair. Specific primer se- quences are listed in Table 1. Total RNA was extracted from bovine follicles with Trizol reagent (Invitrogen) ac- cording to the manufacturer’s instructions. First-strand cDNA was synthesized from the isolated follicular total RNA (3 μg) using oligo dT (SuperScript First-Strand Synthesis System, Invitrogen); it was subsequently used as a template for PCR amplification with Taq polymerase (Takara Bio Inc, Otsu, Shiga, Japan). The first-strand cDNA was quantified using a spectrophotometer (Nano- Drop
ⓇND-1000, NanoDrop Technologies, Wilmington, DE, USA). The quantified cDNA was used as a template for PCR amplification. The PCR steps included initial denatu- ration at 94
oC for 5 min, then 28 or 30 cycles at 94
oC for 20 sec, 55
oC for 20 sec, 72
oC for 20 sec, and a final extension step at 72
oC for 10 min. The amplified PCR products were separated in 1.5% agarose gels stained with ethidium bromide. The bands were extracted and directly sequenced with an ABI PRISM
Ⓡ3100-Avant Genetic Analyzer (Applied Biosystems).
Western blot analysis
Bovine follicles were homogenized in lysis buffer (RIPA buffer, Cell Signaling Technology, Danvers, MA, USA; 20 mM Tris-HCl (pH 7.5), 150 mM NaCl/1 mM Na
2EDTA, 1
mM EGTA, 1% NP-40, 1% sodium deoxycholate, 2.5 mM sodium pyrophosphate, 1 mM β-glycerophosphate, 1 mM Na
3VO
4, and 1 μg/ml leupeptin), incubated at 4
oC for 30 min, and centrifuged at 13,000 rpm (16,609 × g, Micro 17TR, Hanil, Korea) for 30 min at 4
oC. Total protein in su- pernatants was measured using the Bradford protein assay (Bio-Rad, Hercules, CA, USA). Supernatant protein (50-100 μg/lane) was separated by electrophoresis on 10% SDS-pol- yacrylamide gels and transferred to polyvinylidene fluoride (PVDF) membranes (0.45 μm, Millipore, Bedford, MA, USA) in a buffer solution (TBS; 25 mM Tris-base, 190 mM gly- cine, and 20% methanol) using a semi-dry blotter (Bio-Rad).
The transferred blot was stained with Ponceau S solution to check for effective homogeneous transfer. Destained blots were blocked with 5% fat-free milk and 0.05% Tween 20 in TBS for 1 h and the membranes were immunoblotted with ribosomal protein L15 (RPL-15) polyclonal antibody (Abnova corporation, Taipei, Taiwan) and microtubule- associated protein 1B (MAP1B) monoclonal (Chemicon in- ternational Inc., CA, USA) and polyclonal (Santa Cruz Biotechnology, Inc., CA, USA) antibodies at 1:1,000 dilu- tion at 4
oC overnight. After binding of horseradish perox- idase (HRP)-conjugated goat anti-rabbit or goat anti-mouse secondary antibodies (1:3,000; Assay Designs, Ann Arbor, MI, USA) at room temperature for 1 h, antigens were de- tected by enhanced chemiluminescence (ECL Plus kit;
ELPIS, Taejeon, Korea) according to the manufacturer’s instructions.
Data analysis and statistics
LAS-4000 (Fujifilm Corp, Tokyo, Japan), a luminescent image analyzer, was used to capture images of agarose gels and Western blots. The bands obtained from RT-PCR and Western blotting were quantified using Sigma Gel image analysis software (version 1.0, Jandel Scientific, CA, USA) or Quantity One software (version 4.6.3) linked to a GS-800 calibrated densitometer (Bio-Rad). Relative mRNA and pro- tein levels were determined by comparison with the amount of glyceraldehyde-3-phosphate dehydrogenase (GAPDH) and β-actin, respectively, present in each sample. Student’s t-test was used with p<0.05 as the criterion for significance.
Data are presented as mean±SD.
RESULTS Follicular cyst confirmation
The granulosa cell layers were examined in the FCOs
used in this study. Based on histological examination, we
found that granulosa cell layer were present in normal ova-
Fig. 2. Microphotographs of sections of bovine ovary (A) HE staining of normal ovary section and (B) follicular cystic ovary. Normal ovaries (a, b, and c) comprise 8 to 12 diverse granulosa cell layers. GC, and TI represent granulosa cell and theca interna, respectively. Bars
=100 μm. (C) TUNEL staining of bovine ovary section. Tissue sections showing averaged value were represented. A tissue section isolated from normal ovary was used for negative control (left panel), and normal and cystic ovary sections containing follicles were shown in middle and right panels, respectively. The bar graph shows normalized fluorescence intensities for normal and cystic ovaries. The fluorescence intensity of normal and cystic ovaries was normalized to that of negative control. Each bar represents mean±SD of five experiments.
Table 2. Concentrations of esrtadiol-17β, progesterone, and testosterone in bovine follicular fluid
Follicle size n Concentration (ng/ml) Ratio
of E
2/P
417β esrtradiol (E
2) Testosterone Progesterone (P
4) 3∼5 mm
8∼10 mm
≥ 25 mm 10 18 18
12.6±9.0
a93.2±54.2
b130.2±35.6
b30.5±11.4
a12.7±7.7
a,b8.7±4.1
b3.8±1.0
a38.0±11.1
b39.8±12.3
b> 1
> 1
> 1
a,b