Original Article
Accuracy of Intraocular Lens Power Calculation Formulas in Primary Angle Closure Glaucoma
Jongsoo Joo, Woong-Ju Whang, Tae-Hoon Oh, Kyu-Dong Kang, Hyun-Seung Kim, Jung-Il Moon
Department of Ophthalmology and Visual Science, Yeouido St. Mary's Hospital, The Catholic University of Korea College of Medicine, Seoul, Korea
Purpose: To compare the accuracy of intraocular lens (IOL) power calculation formulas in eyes with primary angle closure glaucoma (ACG).
Methods: This retrospective study compared the refractive outcomes of 63 eyes with primary ACG with the results of 93 eyes with normal open angles undergoing uneventful cataract surgery. Anterior segment biometry including anterior chamber depth, axial length, and anterior chamber depth to axial length ratio were compared by the IOL Master. Third generation formulas (Hoffer Q and SRK/T) and a fourth generation formula (Haigis) were used to predict IOL powers in both groups. The predictive accuracy of the formulas was analyzed by comparison of the mean error and the mean absolute error (MAE).
Results: In ACG patients, anterior chamber depth and the anterior chamber depth to axial length ratio were smaller than normal controls (all p < 0.05). The MAEs from the ACG group were larger than that from the control group in the Haigis formula. The mean absolute error from the Haigis formula was the largest and the mean absolute error from the Hoffer Q formula was the smallest.
Conclusions: IOL power prediction may be inaccurate in ACG patients. The Haigis formula produced more in- accurate results in ACG patients, and it is more appropriate to use the Hoffer Q formula to predict IOL powers in eyes with primary ACG.
Key Words:Angle-closure glaucoma, Cataract, Intraocular lenses
ⓒ2011 The Korean Ophthalmological Society
This is an Open Access article distributed under the terms of the Creative Commons Attribution Non-Commercial License (http://creativecommons.org/licenses /by-nc/3.0/) which permits unrestricted non-commercial use, distribution, and reproduction in any medium, provided the original work is properly cited.
Received: November 7, 2010 Accepted: April 23, 2011
Corresponding Author: Hyun-Seung Kim, MD, PhD. Department of Ophthalmology, St. Mary’s Hospital, The Catholic University of Korea College of Medicine, #62 Yeouido-dong, Yeongdeungpo-gu, Seoul 150-713, Korea. Tel: 82-2-3779-1243, Fax: 82-2-590-1544, E-mail:
sara514@ catholic.ac.kr
Intraocular lens (IOL) power is determined by 3 factors:
preoperative biometric data (axial length, anterior chamber depth, lens thickness, and keratometric value), the IOL cal- culation formula, and the IOL constant [1]. Most cataract sur- geons have applied third-generation formulas; however, these formulas have limitations in predicting the position of the IOL based on axial length and central corneal power [2].
On the other hand, preoperative anterior chamber depth (ACD) and lens thickness are taken into consideration in fourth-generation formulas [3].
Ucakhan et al. [4]. concluded that anterior chamber depth increased after uneventful phacoemulsification and IOL im-
plantation, and that a shallower anterior chamber produced a greater increase in ACD. After cataract surgery in eyes with angle closure glaucoma, declining intraocular pressure and deepening of the anterior chamber has been reported [5-7].
Some studies have surmised that the IOP lowering effect of cataract surgery also induces a decrease in axial length [8-10]. This suggests the need for a precise investigation of intraocular lens power calculation formula in eyes with angle closure glaucoma (ACG).
In this study, we aimed to compare the accuracy of 2 third-generation formulas (the Hoffer Q formula and the SRK/T formula) and 1 fourth-generation formula (the Haigis formula) in ACG patients.
Materials and Methods
This retrospective study included 156 eyes of 156 patients who underwent cataract surgery between July 2009 and December 2009 in the glaucoma clinics at Yeouido St.
Mary’s Hospital. Informed consent was obtained from all pa-
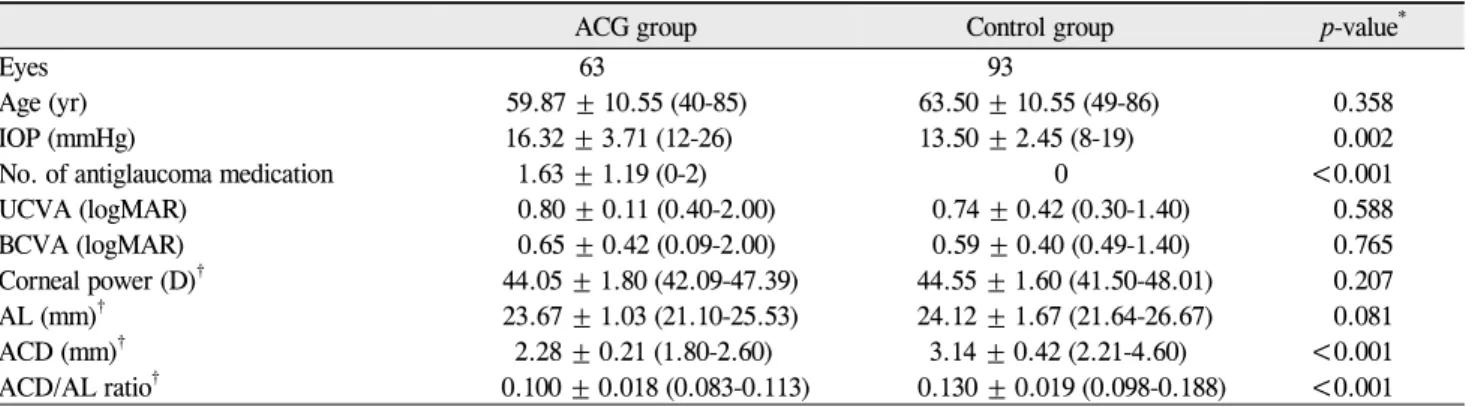
Table 1. Preoperative data in the ACG and the control group
ACG group Control group p-value*
Eyes 63 93
Age (yr) 59.87 ± 10.55 (40-85) 63.50 ± 10.55 (49-86) 0.358
IOP (mmHg) 16.32 ± 3.71 (12-26) 13.50 ± 2.45 (8-19) 0.002
No. of antiglaucoma medication 1.63 ± 1.19 (0-2) 0 <0.001
UCVA (logMAR) 0.80 ± 0.11 (0.40-2.00) 0.74 ± 0.42 (0.30-1.40) 0.588
BCVA (logMAR) 0.65 ± 0.42 (0.09-2.00) 0.59 ± 0.40 (0.49-1.40) 0.765
Corneal power (D)† 44.05 ± 1.80 (42.09-47.39) 44.55 ± 1.60 (41.50-48.01) 0.207
AL (mm)† 23.67 ± 1.03 (21.10-25.53) 24.12 ± 1.67 (21.64-26.67) 0.081
ACD (mm)† 2.28 ± 0.21 (1.80-2.60) 3.14 ± 0.42 (2.21-4.60) <0.001
ACD/AL ratio† 0.100 ± 0.018 (0.083-0.113) 0.130 ± 0.019 (0.098-0.188) <0.001 ACG = angle-closure glaucoma; IOP = intraocular pressure; UCVA = uncorrected visual acuity; logMAR = logarithm of the minimum angle of resolution; BCVA = best-corrected visual acuity; D = diopter; AL = axial length; ACD = anterior chamber depth.
*p-value by Mann-Whitney U-test.
†Preoperative biometric data (axial length, anterior chamber depth, and corneal power) by the IOL Master.
tients prior to commencement of the study and the study methods adhered to the tenets of the Declaration of Helsinki for the use of human participants in biomedical research.
There were 63 eyes diagnosed with primary angle-closure glaucoma by a glaucoma specialist (JIM) and all eyes had previously undergone laser peripheral iridotomy by the same glaucoma specialist. They did not have a history of previous ocular surgery, general disorders affecting the cornea, or ocu- lar disease except ACG. 93 eyes confirmed with normal open-angles were also included as a comparative control group. All the subjects underwent gonioscopy by a second, independent observer (KDK) with extensive experience in performing gonioscopy. None of the patients had a history of ocular disease, previous ocular surgery, or general disorders affecting the cornea in the control group.
Preoperative IOL power calculations were performed with the IOL Master optical biometer ver. 5 (Carl-Zeiss, Jena, Germany). The IOL Master uses partial coherence inter- ferometry to measure axial length. All 156 eyes underwent IOL power calculations with the IOL Master optical biometer. Corneal power was measured by automated kera- tometry, which was performed first because the system re- quires the input of corneal radii to calculate the anterior chamber depth. The ACD was determined by calculating the distance along the visual axis between the corneal epithelium and the lens using lateral slit illumination with high reso- lution, (±0.01 mm) [11], high precision(≤5 μm) and good re- liability [12,13].
After preoperative measurements, all of the patients under- went cataract surgery through a 2.2 mm micro-coaxial incision. All procedures were performed by the same surgeon (HSK) using the Ozil torsional handpiece with the Infiniti Vision System (Alcon, Fort Worth, TX, USA). Local anes- thesia was administered using topical 4% lidocaine and 0.5%
proparacaine hydrochloride (Alcaine, Alcon). Surgery was performed through a self-sealing, temporal clear corneal incision. In this case series, we only included the eyes that
underwent cataract surgery with no complications in con- tinuous curvelinear capsulorrhexis. Phacoemulsification was performed with 100% torsional ultrasound, 350 mmHg vac- uum, and 35 cc/min aspiration rate. Following phacoemulsi- fication, the intraocular lens (SN60WF, Alcon) was inserted into the bag. No intraoperative complications occurred.
Refractive outcome was measured 3 months postoperatively by an auto-refractometer (Canon RK-5; Canon, Tokyo, Japan).
In 156 eyes of this study, optimized IOL constants pub- lished on the User Group for Laser Interference Biometry website were used. They were pACD = 5.64 (Hoffer Q), A-constant = 119.0 (SRK-T), and a0 = -0.734, a1 = 0.187, a2
= 0.221. The refractive benefits of personalized IOL con- stants for each surgeon over optimized IOL constants are not clinically meaningful [14].
The predictive refractive accuracy for each formula was analyzed in all eyes. The mean error (ME) was the actual postoperative SE minus predicted SE and the mean absolute error (MAE) was the average absolute value of the ME. A negative ME indicates that the patient had a postoperative re- fraction that was more myopic than intended, while a pos- itive ME indicates that the patient had a more hyperopic re- fraction than intended.
Statistical analysis was performed using SPSS ver. 17.0 (SPSS Inc., Chicago, IL, USA). To determine the significance of the ME and MAE between the 3 formulas, Friedman test- ing was performed, and the total experimental level of sig- nificance was set at 0.05. Mann-Whitney U-testing was used for the comparison between the ACG group and the control group in each formula.
Results
There were 63 eyes in the ACG group and 93 eyes in the control group. The two groups were well balanced overall for demographic and baseline ocular characteristics. Table 1 shows preoperative clinical data. The mean age was 59.87 ± 10.55
Table 2. The mean errors (mean [D], range [D]) with 3 formulas in the ACG and the control groups
ACG group Control group p-value*
Hoffer Q formula -0.08 ± 0.67 -0.02 ± 0.57 0.815
-0.98 to 1.05 -1.04 to 1.04
SRK/T formula +0.23 ± 0.69 +0.00 ± 0.61 0.120
-1.06 to 1.42 -0.95 to 1.08
Haigis formula +0.31 ± 0.83 +0.02 ± 0.62 0.098
-1.33 to 1.60 -1.01 to 1.00
p-value† <0.001 0.059
D = diopter; ACG = angle-closure glaucoma.
*p-value by Mann-Whitney U-test.
†p-value by Friedman test.
ACG Control
Fig. 1. Mean error (preoperative target refraction subtracted from postoperative refraction) which was produced by the Hoffer Q for- mula in the angle-closure glaucoma (ACG) group and the control group.
ACG Control
Fig. 2. Mean error (preoperative target refraction subtracted from postoperative refraction) which was produced by the SRK/T for- mula in the angle-closure glaucoma (ACG) group and the control group.
ACG Control
Fig. 3. Mean error (preoperative target refraction subtracted from postoperative refraction) which was produced by the Haigis formula in the angle-closure glaucoma (ACG) group and the control group.
years in the ACG group and, 63.50 ± 10.55 years in the con- trol group. The mean best-corrected visual acuity (logarithm of the minimum angle of resolution) was 0.63 ± 0.42 in the ACG group and, 0.59 ± 0.40 in the control group. The pre- operative corneal power (diopter) was 44.05 ± 1.80 in the ACG group and, 44.55 ± 1.60 in the control group. The axial length (mm) was 23.67 ± 1.03 in the ACG group and, 24.12 ± 1.67 in the control group. Eyes with ACG showed significantly
higher IOP than the control group (p = 0.002). Preoperative ACD was significantly shallower (p < 0.001). The ACG group also showed a significantly smaller anterior chamber depth to axial length (ACD/AL) ratio than the control group (p < 0.001).
Table 2 and Figs. 1-3 show ME (postoperative refraction- target refraction by each formula) in both groups. In the ACG group, the Hoffer Q formula showed a negative ME indicat- ing a more myopic result than intended, while the SRK/T for- mula and the Haigis formula produced a positive ME, indicating a more hyperopic result than intended. There were statisti- cally significant differences between the 3 formulas (p < 0.001).
In the control group, which had normal open-angle eyes pre- operatively, the 3 formulas did not significantly differ from each other and the absolute values of ME were less than 0.03 diopter. The control group produced mean errors closer to zero than the ACG group in all of the formulas.
Table 3 shows mean absolute errors. The Haigis formula produced the highest MAE indicating inaccurate results in the ACG group. There were no statistically significant differ- ences between the 3 formulas both in the ACG group and the control group. The MAEs from the ACG group were higher than the MAEs from the control group in each formula and there was a statistically significant difference in the Haigis formula (p = 0.039).
Table 3. The mean absolute errors (mean [D], range [D]) with 3 formulas in the ACG and the control groups
ACG group Control group p-value*
Hoffer Q formula 0.53 ± 0.39 0.45 ± 0.34 0.076
0 to 1.05 0 to 1.04
SRK/T formula 0.54 ± 0.47 0.47 ± 0.39 0.075
0 to 1.42 0 to 1.08
Haigis formula 0.69 ± 0.54 0.46 ± 0.40 0.039
0 to 1.60 0 to 1.00
p-value† 0.229 0.477
D = diopter; ACG = angle-closure glaucoma.
*p-value by Mann-Whitney U-test.
†p-value by Friedman test.
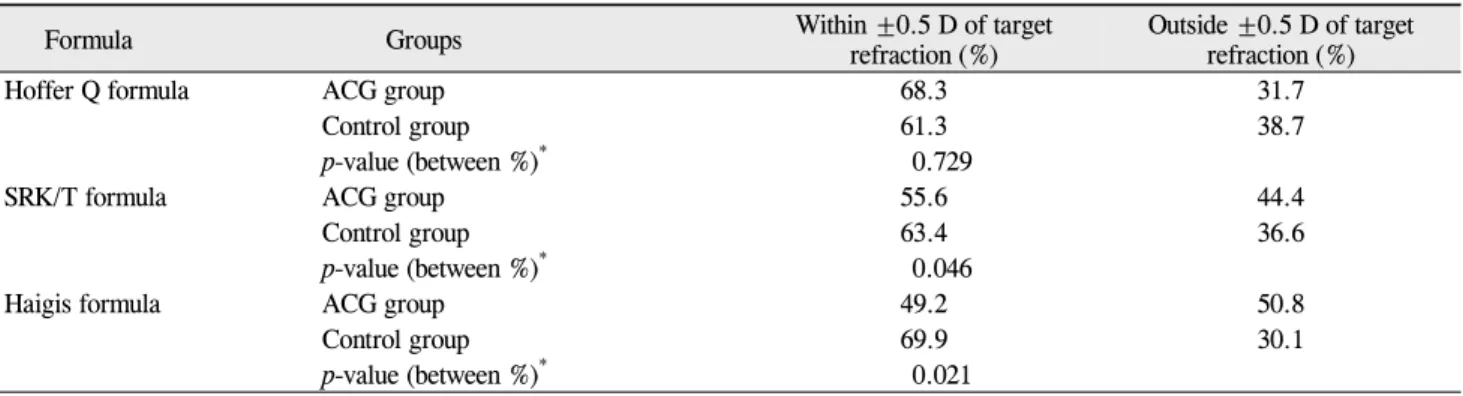
Table 4. The percentage of patients within or outside ±0.5 D of target refraction with 3 formulas in the ACG and the control groups
Formula Groups Within ±0.5 D of target
refraction (%) Outside ±0.5 D of target refraction (%)
Hoffer Q formula ACG group 68.3 31.7
Control group 61.3 38.7
p-value (between %)* 0.729
SRK/T formula ACG group 55.6 44.4
Control group 63.4 36.6
p-value (between %)* 0.046
Haigis formula ACG group 49.2 50.8
Control group 69.9 30.1
p-value (between %)* 0.021
D = diopter; ACG = angle-closure glaucoma.
*p-value by chi-square test.
Table 4 shows the percentage of patients within or outside
±0.5 diopter of the target refraction with 3 formulas in the ACG and the control groups. The Hoffer Q formula is stat- istically insignificant (p = 0.729) in the difference between the two (ACG and control) groups, thereby indicating that the Hoffer Q formula works as well in the ACG group as in the control group. The other two formulas (SRK/T formula and Haigis) showed a statistically significant difference (p = 0.046, p = 0.021, respectively) in the percentage of patients between the two groups, which means that the two formulas may not be as accurate when applied in the ACG group as in the control group.
Discussion
The present study demonstrates the possibility of in- accurate IOL power calculation in eyes with ACG through the comparison of IOL formulas. For precise comparison of the IOL formulas, we assessed only 1 IOL (Acrysof SN60WF, Alcon), because the accuracy of power calculation formulas may differ across different IOL types [14,15] and simulta- neous assessment of several IOLs may prevent accurate eval- uation of the IOL formula. Furthermore, we excluded cases with inappropriate capsulorrhexis that might induce an in-
accurate outcome [2].
In this study, eyes with ACG produced more unstable re- sults than normal eyes. Both standard deviations of ME and the MAEs were larger in the ACG group. Eyes with ACG display a propensity for a higher than normal intracapsular volume. This large capsular bag may result in tilting or de- centering of an intra-capsular IOL and these deviated IOLs may cause unstable refraction, postoperatively [16-18].
Eyes with ACG also showed more hyperopic results than intended (0.23 diopter with the SRK/T formula, 0.31 diopter with the Haigis formula). The lens plays a pivotal role in the pathogenesis of ACG because of its anatomic peculiarities, such as increased thickness and relative anterior positioning, and because progression of lens thickness causes narrowing of the angle [16,17]. Cataract surgery contributes to postoperative widening of the angle by completely removing lens volume and the pupillary block and this results in deepening of the anterior chamber, a subsequent hyperopic shift in ocular power occurs when an IOL is implanted in a more posterior plane than pre-operatively planned. The Haigis formula pro- duced the highest MAE (0.69 diopter) and the most hyperopic results (ME, +0.31 diopter). The inaccuracy of the Haigis formula may be caused by biometric data using ACD. Third- generation formulas were aimed at more accurate prediction
of the position of the IOL, incorporating the effect of corneal curvature [18]. Popular formulas for IOL power calculation like the SRK/T formula and the Hoffer Q formula are based on thin lens optics [19]. In thin lens optics, the cornea and the lens (crystalline or IOL) are replaced by infinitely thin lenses with 2 refractive powers. However, whereas other formulas use only one constant (ACD constant, surgeon factor) for IOL power calculation, the Haigis formula, one of the fourth generation formulas, uses 3 constants (a0, a1, a2) and pre- operative ACD is taken into consideration [3]. An increase of 1 mm ACD will cause a change in the effective lens position in the Haigis formula of 0.4 mm, which will be reflected in a refractive change of 0.5 to 0.6 diopter [20]. The 3 IOL con- stants of the Haigis formula followed from a double re- gression analysis using axial length and ACD and IOL con- stant optimization and are based on eyes with normal ACD or ACD/AL ratio. Therefore, IOL constants from normal eyes may induce inaccurate results and underestimate ideal IOL power in ACG patients as they have a statistically significant shallower ACD and a smaller ACD/AL ratio than normal eyes. The previous studies using the IOL Master, the Hoffer Q formula has been shown to induce better results than the SRK/T formula in hyperopic eyes when AL is less than 22.0 mm [21,22]. In this study, the ACG group did not show sig- nificantly shorter axial length than the control group, but nonetheless, the Hoffer Q formula produced better results than the SRK/T formula (ME, -0.08 diopter vs. +0.23 diopter).
In conclusion, cataract surgeons must recognize that the refractive outcomes may be erroneous depending on which IOL formula is applied before cataract surgery and thus the IOL power prediction may be inaccurate in ACG patients.
The Haigis formula, which considers preoperative anterior chamber depth for IOL power determination, produced in- accurate results in eyes with ACG, possibly due to an unusual increase of anterior chamber depth after phacoemulsification.
In those cases, we recommend applying the Hoffer Q for- mula for the IOL power calculation.
Conflict of Interest
No potential conflict of interest relevant to this article was reported.
References
1. Drexler W, Findl O, Menapace R, et al. Partial coherence inter- ferometry: a novel approach to biometry in cataract surgery.
Am J Ophthalmol 1998;126:524-34.
2. Lee AC, Qazi MA, Pepose JS. Biometry and intraocular lens power calculation. Curr Opin Ophthalmol 2008;19:13-7.
3. Terzi E, Wang L, Kohnen T. Accuracy of modern intraocular lens power calculation formulas in refractive lens exchange for high myopia and high hyperopia. J Cataract Refract Surg
2009;35:1181-9.
4. Ucakhan OO, Ozkan M, Kanpolat A. Anterior chamber pa- rameters measured by the Pentacam CES after uneventful pha- coemulsification in normotensive eyes. Acta Ophthalmol 2009;87:544-8.
5. Nonaka A, Kondo T, Kikuchi M, et al. Angle widening and al- teration of ciliary process configuration after cataract surgery for primary angle closure. Ophthalmology 2006;113:437-41.
6. Hayashi K, Hayashi H, Nakao F, Hayashi F. Changes in ante- rior chamber angle width and depth after intraocular lens im- plantation in eyes with glaucoma. Ophthalmology 2000;107:
698-703.
7. Yang CH, Hung PT. Intraocular lens position and anterior chamber angle changes after cataract extraction in eyes with primary angle-closure glaucoma. J Cataract Refract Surg 1997;23:1109-13.
8. Law SK, Mansury AM, Vasudev D, Caprioli J. Effects of com- bined cataract surgery and trabeculectomy with mitomycin C on ocular dimensions. Br J Ophthalmol 2005;89:1021-5.
9. Francis BA, Wang M, Lei H, et al. Changes in axial length fol- lowing trabeculectomy and glaucoma drainage device surgery.
Br J Ophthalmol 2005;89:17-20.
10. Kang SY, Hong S, Won JB, et al. Inaccuracy of intraocular lens power prediction for cataract surgery in angle-closure glaucoma.
Yonsei Med J 2009;50:206-10.
11. Santodomingo-Rubido J, Mallen EA, Gilmartin B, Wolffsohn JS. A new non-contact optical device for ocular biometry. Br J Ophthalmol 2002;86:458-62.
12. Findl O, Drexler W, Menapace R, et al. High precision bio- metry of pseudophakic eyes using partial coherence interferometry.
J Cataract Refract Surg 1998;24:1087-93.
13. Haigis W, Lege B, Miller N, Schneider B. Comparison of im- mersion ultrasound biometry and partial coherence inter- ferometry for intraocular lens calculation according to Haigis.
Graefes Arch Clin Exp Ophthalmol 2000;238:765-73.
14. Charalampidou S, Cassidy L, Ng E, et al. Effect on refractive outcomes after cataract surgery of intraocular lens constant personalization using the Haigis formula. J Cataract Refract Surg 2010;36:1081-9.
15. Elder MJ. Predicting the refractive outcome after cataract sur- gery: the comparison of different IOLs and SRK-II v SRK-T.
Br J Ophthalmol 2002;86:620-2.
16. Marchini G, Pagliarusco A, Toscano A, et al. Ultrasound bio- microscopic and conventional ultrasonographic study of ocu- lar dimensions in primary angle-closure glaucoma. Ophthalmology 1998;105:2091-8.
17. Lowe RF. Causes of shallow anterior chamber in primary an- gle-closure glaucoma. Ultrasonic biometry of normal and an- gle-closure glaucoma eyes. Am J Ophthalmol 1969;67:87-93.
18. Narvaez J, Zimmerman G, Stulting RD, Chang DH. Accuracy of intraocular lens power prediction using the Hoffer Q, Holladay 1, Holladay 2, and SRK/T formulas. J Cataract Refract Surg 2006;32:2050-3.
19. Hoffer KJ. The Hoffer Q formula: a comparison of theoretic and regression formulas. J Cataract Refract Surg 1993;19:700-12.
20. Haigis W. IOL power calculations. Ophthalmology 2010;
117:400-1.
21. Gavin EA, Hammond CJ. Intraocular lens power calculation in short eyes. Eye (Lond) 2008;22:935-8.
22. MacLaren RE, Natkunarajah M, Riaz Y, et al. Biometry and formula accuracy with intraocular lenses used for cataract sur- gery in extreme hyperopia. Am J Ophthalmol 2007;143:920-31.
![Table 2. The mean errors (mean [D], range [D]) with 3 formulas in the ACG and the control groups](https://thumb-ap.123doks.com/thumbv2/123dokinfo/5465661.658464/3.892.82.812.129.281/table-mean-errors-mean-range-formulas-control-groups.webp)