Correlations between Magnitude of Refractive Error andOther Optical Components in Korean Myopes
7
0
0
전체 글
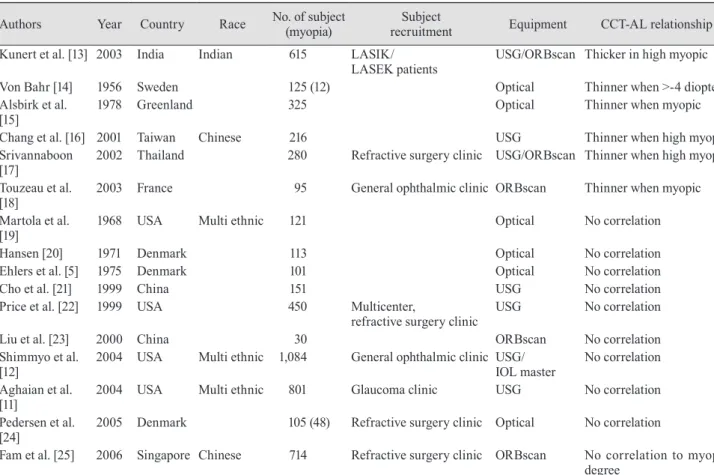
(2) SK Lee, et al. Positive Correlation between CCT and AL. sults of previous studies (Table 1) have shown that ocular optical components and the inter-relationships are different depending on the type of surgery. There is a report that investigated the ocular parameters in Koreans [26] and showed a relationship between AL and ACD in myopic patients in whom the refraction was >-3 diopters. However, there are few studies that have reported ocular optical components and their inter-relationships in myopic Korean patients. Therefore, we evaluated the ocular biometries of myopic Korean patients, especially with respect to CCT.. Materials and Methods A prospective, observational, clinic-based study was conducted involving 1,011 subjects (467 males and 544 females). All subjects were Koreans between 22 and 46 years of age (mean age, 30.05 years) who received care in the refractive surgery clinic between 1 May 2008 and 31 December 2009. Only the right eyes of the subjects were included in this study. We excluded those subjects with previous eye surgery,. glaucoma, ocular hypertension, retinal disease, diabetes mellitus, or other acute or chronic diseases that could possibly affect the components of the eye globe. Subjects were excluded when they had subclinical keratoconus (paracentral corneal thinning and central corneal steepening was identified with topography, but the CCT was >450 μm [27]) or when keratoconus was suspected. Those subjects with a corrected visual acuity <20 / 20 were also excluded. The institutional review board provided approval for the protocol of this study, and written informed consent was obtained from all patients. In the case of contact lens wearers, after an at least two week lens-free period, ocular biometry were measured. All the ocular parameters were measured after cycloplegia, which was performed in a mixture of 2.0% phenylephrine and 2% tropicamide (Santen, Osaka, Japan) and 1% cyclopentolate (B&L, Tampa, FL, USA). At least four cycloplegic eyedrops were instilled into the conjunctival fornix at ten minute intervals, and the iris was checked with a slit lamp. Lack of pupil movement or pupil dilation of at least 6 mm in diameter was considered complete cycloplegia. Each subject was objectively refracted using a RK-. Table 1. Previously published papers on the relationship between CCT and AL Authors. Year. Country. Race. Kunert et al. [13] 2003. India. Von Bahr [14] Alsbirk et al. [15] Chang et al. [16] Srivannaboon [17] Touzeau et al. [18] Martola et al. [19] Hansen [20] Ehlers et al. [5] Cho et al. [21] Price et al. [22]. 1956 1978. Sweden Greenland. 2001 2002. Taiwan Thailand. 2003. France. 1968. USA. 1971 1975 1999 1999. Denmark Denmark China USA. 2000 2004. China USA. Multi ethnic. 30 (12) 1,084 (12). 2004. USA. Multi ethnic. 2005 2006. Liu et al. [23] Shimmyo et al. [12] Aghaian et al. [11] Pedersen et al. [24] Fam et al. [25]. Indian. No. of subject (myopia) 615 (12). Subject recruitment LASIK/ LASEK patients. 125 (12) 325 (12) Chinese. 216 (12) 280 (12) 95 (12). Multi ethnic. Equipment. CCT-AL relationship. USG/ORBscan Thicker in high myopic Optical Optical. Thinner when >-4 diopters Thinner when myopic. USG Thinner when high myopic Refractive surgery clinic USG/ORBscan Thinner when high myopic General ophthalmic clinic ORBscan. Thinner when myopic. 121 (12). Optical. No correlation. 113 (12) 101 (12) 151 (12) 450 (12). Optical Optical USG USG. No correlation No correlation No correlation No correlation. Multicenter, refractive surgery clinic. No correlation No correlation. 801 (12). ORBscan General ophthalmic clinic USG/ IOL master Glaucoma clinic USG. Denmark. 105 (48). Refractive surgery clinic Optical. No correlation. Singapore Chinese. 714 (12). Refractive surgery clinic ORBscan. No correlation. No correlation to myopic degree CCT = central corneal thickness; AL = axial length; LASIK = laser in situ keratomileusis; LASEK = laser-assisted sub-epithelial keratomileusis; USG = ultrasonography.. 325.
(3) Korean J Ophthalmol Vol.26, No.5, 2012. F1 autorefractor (Canon, Lake Success, NY, USA). The biometrics was measured by an IOL Master (Zeiss, Jena, Germany). CCT was measured using ORBscan II (Bausch & Lomb, New York, NY, USA) according to the manufacturer’s instruction manuals. The degree of myopia was divided as follows: low, <-3 diopters; intermediate, >-3 diopters and <-6 diopters; high, >-6 diopters and <-10 diopters [27,28]; and extreme, >-10 diopters (we do not recommend LASIK/LASEK, even when a safe corneal stromal bed thickness is secured, when the refraction is >-10 diopters). The data was analyzed using SPSS ver. 12.0 (SPSS Inc., Chicago, IL, USA) to perform ANOVA, Pearson correlations, and a regression test. A critical p-value of 0.05 was chosen to denote statistical significance.. Results A total of 1,011 Korean patients (467 males and 544 females) were recruited. The greater number of female patients was explained by the greater cosmetic desires of female patients. The mean age of the patients was 30.05 years, with a range between 22 and 46 years. The mean age of the extreme myopic group was relatively young because the inconvenience of high diopters of glasses or contact lenses caused the patients to seek evaluation at a refractive surgery clinic in their youth. The ages of the patients were not statistically different according to the degree of myopia, although the patients with extreme myopes were relatively younger than those in the other groups ( p > 0.05). In Table 2, the ocular biometries according to the degree of myopia are shown. The CCT of males (540.01 ± 4.07 μm) was thicker than females (532.66 ± 3.34 μm; unpaired t-test, p < 0.01). Other biometries did not differ as a function of age or gender ( p > 0.01, data not shown). The standard deviations of Dsph, ACD, LT, VCD, and AL in the extreme myopic group were wider than those in the low and intermediate groups ( p < 0.01). The standard deviation of the CCT was not different according to the degree of myopia ( p > 0.05). For the CCT, the difference between intermediate and high myopia was only 2.31 μm, which may not be clinical relevant. However, the difference between extreme and high myopia was 24.26 μm, a nearly ten-fold difference, suggesting that the cornea might be more ablated (1-1.5 diopters) by LASIK/LASEK (Table 2). Refractive errors had a positive correlation with LT but negative correlations with AL, ACD, VCD, and CCT, i.e., as the degree of myopia was increased, the CCT, ACD, VCD, and AL all increased, while the LT decreased (Table 3). As AL increased, ACD, VCD and CCT increased, but LT decreased. CCT had a positive correlation with the Dsph, 326. ACD, VCD and AL but no correlation with age (Table 3). Fig. 1 shows that CCT had a positive correlation with the degree of myopia and AL. Also, sex had a positive correlation with the CCT ( p = 0.002); we previously showed that the CCT of males was greater than that of females. Age had a correlation with Dsph ( p = 0.018) and LT ( p = 0.001) (Table 3). The histogram of CCT showed a normal distribution (Fig. 2). Therefore, the Pearson correlation was applicable to the inter-relationships between CCT and other ocular biometries. The regression between CCT and AL based on the degree of myopia is shown in Table 4. The mean CCT was increased in proportion to the increase in AL. CCT and AL had a positive correlation in the intermediate, high, and extreme myopic groups but not in the low myopic group. The multivariate regression test is shown in Table 5. Patient age, sex, and Dsph had no effect on CCT, but ACD, LT, VCD, and AL had an effect on CCT.. Discussion We used the IOL Master to measure biometries, and CCT was measured by ORBscan II. Partial coherence laser interferometry (IOL Master), a type of optic biometry, has several advantages over traditional immersion and applanation A-scan ultrasonography; specifically, a partial coherence laser interferometer has lower techniciandependence and does not make contact with the cornea. Therefore, the tests are easy and rapid [27,28]. ORBscan II also does not contact the cornea, so we used this instrument to measure CCT [27]. We showed that AL has positive correlations with ACD, VCD and CCT and negative correlations with the LT, similar to that reported in previous studies [10,29]. A positive correlation between CCT (measured by the ORBscan) and AL (measured by ultrasonography [USG]) has been previously reported in only one study [13]. The difference between our study and other studies is that included patients were undergoing refractive surgery, especially LASIK or LASEK. The included patients had good corrected visual acuity (>20 / 20), and the age range was between 22 and 46 years. Also, patients had sufficient central corneal thickness to perform LASIK, which may contribute to some selection bias. Foster et al. [30] reported that the CCT of a Mongolian population (as measured by an optical pachymeter) was thinner than that of a Caucasian population. In one glaucoma clinic-based study using USG pachymetry [11], CCT differences were shown as a function of race, as follows: Chinese (555.6 μm), Caucasian (550.4 μm), Filipino (550.6 μm), Hispanic (548.1 μm), Japanese (513.7 μm), and African-American (521.0 μm). The resulting mean CCT values were different from the results of Fam et al. [25], which might have been caused by patient selection. The former.
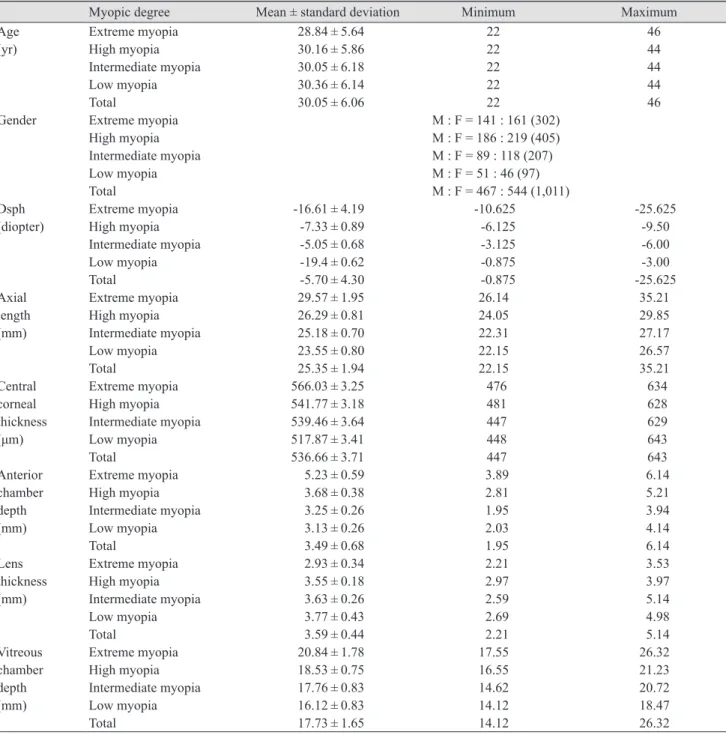
(4) SK Lee, et al. Positive Correlation between CCT and AL. study recruited patients from a glaucoma clinic, and the latter recruited from a refractive surgery clinic. Price et al. [22] used corneal topography to show similar CCT values (550 μm) at multiple sites in the USA involving Caucasians with unknown ethnicities. For direct comparison of CCTs in different human races, the different measurement instruments and methods must be considered. CCT corresponds to an age-related thinning of 6.3 μm. per decade [9,30] and has also exhibited racial, sex, and age differences [9,29,30]. Brandt et al. [9] reported that the CCT of females was about 5 μm thicker than that of males, although the difference was not clinically significant. In our study, the reverse trend was revealed in myopic Korean patients. The positive correlation between CCT and AL is striking. CCT of myopic Korean patients (536.66 μm) was dif-. Table 2. Demographic features, degree of myopia, and ocular components of study patients Age (yr). Gender. Dsph (diopter). Axial length (mm). Central corneal thickness (μm) Anterior chamber depth (mm) Lens thickness (mm). Vitreous chamber depth (mm). Myopic degree Extreme myopia High myopia Intermediate myopia Low myopia Total Extreme myopia High myopia Intermediate myopia Low myopia Total Extreme myopia High myopia Intermediate myopia Low myopia Total Extreme myopia High myopia Intermediate myopia Low myopia Total Extreme myopia High myopia Intermediate myopia Low myopia Total Extreme myopia High myopia Intermediate myopia Low myopia Total Extreme myopia High myopia Intermediate myopia Low myopia Total Extreme myopia High myopia Intermediate myopia Low myopia Total. Mean ± standard deviation 28.84 ± 5.64 30.16 ± 5.86 30.05 ± 6.18 30.36 ± 6.14 30.05 ± 6.06. -16.61 ± 4.19 -7.33 ± 0.89 -5.05 ± 0.68 -19.4 ± 0.62 -5.70 ± 4.30 29.57 ± 1.95 26.29 ± 0.81 25.18 ± 0.70 23.55 ± 0.80 25.35 ± 1.94 566.03 ± 3.25 541.77 ± 3.18 539.46 ± 3.64 517.87 ± 3.41 536.66 ± 3.71 5.23 ± 0.59 3.68 ± 0.38 3.25 ± 0.26 3.13 ± 0.26 3.49 ± 0.68 2.93 ± 0.34 3.55 ± 0.18 3.63 ± 0.26 3.77 ± 0.43 3.59 ± 0.44 20.84 ± 1.78 18.53 ± 0.75 17.76 ± 0.83 16.12 ± 0.83 17.73 ± 1.65. Minimum 22 22 22 22 22 M : F = 141 : 161 (302) M : F = 186 : 219 (405) M : F = 89 : 118 (207) M : F = 51 : 46 (97) M : F = 467 : 544 (1,011) -10.625 -6.125 -3.125 -0.875 -0.875 26.14 24.05 22.31 22.15 22.15 476 481 447 448 447 3.89 2.81 1.95 2.03 1.95 2.21 2.97 2.59 2.69 2.21 17.55 16.55 14.62 14.12 14.12. Maximum 46 44 44 44 46. -25.625 -9.500 -6.000 -3.000 -25.625 35.210 29.850 27.170 26.570 35.210 634 628 629 643 643 6.14 5.21 3.94 4.14 6.14 3.53 3.97 5.14 4.98 5.14 26.32 21.23 20.72 18.47 26.32. Dsph = spherical equivalent refractive error.. 327.
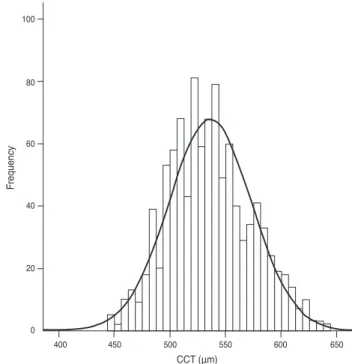
(5) Korean J Ophthalmol Vol.26, No.5, 2012. ferent from other east Asian populations, such as Chinese (556 μm) or Japanese (513.7 μm) [11]. The inter-relationship between CCT and AL was different from that of Taiwanese Chinese [23] or Singaporean Chinese [25]. In our study, the mean CCT was increased in proportion to the increase in AL, and a positive correlation between the CCT and AL was shown in moderate, high, and extreme myopia. Pedersen et al. [24] mentioned two hypotheses of “general overgrowth of the eye” or “mechanical hyper-inflation of the eye” in high myopia. The results of the present study cannot be completely explained by these hypotheses. In this study, the elongation of AL had a close relationship to the elongation of VCD, but the LT thinned as the AL increased. We reasoned that this is due to a compensatory mechanism to produce a clear retinal image in the presence of axial elongation. Age had a correlation with Dsph ( p = 0.018), which may have been caused by the progression of myopia as age increased. Age also had a positive correlation with LT ( p = 0.001), which reflects a relationship with presbyopia, al-. though the clinical implication is not clear. In our study, as the axial elongation progressed, VCD and ACD deepened and CCT thickened. VCD accounts for the major myopic change of the eye, but the role of ACD increase was not clear. The change in ACD in myopia may be a passive change but an active protective mechanism for preventing excess corneal thinning. The simple fact that ACD was greater in the high (4.17 ± 0.86 mm) and extreme myopic groups (5.23 ± 0.59 mm) compared to the low or intermediate myopic groups was not sufficient to conclude that ACD has some role in protecting the cornea from excess thinning. Serial follow-up of CCT and axial length is necessary for understanding myopic changes of the eye, but such studies are difficult and time/cost-consuming.. 100. 80. Frequency. 650. CCT (μm). 600. 60. 40. 550. 500. 20. 450 0 400. R squared linear -0.13 22. 24. 26. 28. AL (mm). 30. 32. 34. 36. Fig. 1. The regression of central corneal thickness (CCT) to axial length (AL). CCT showed a positive correlation with AL.. 400. 450. 500. CCT (μm). 550. 600. 650. Fig. 2. The histogram of central corneal thickness (CCT). The histogram of CCT showed a nearly normal distribution. To demonstrate the linear correlation between CCT and axial length, the CCT must have a normal distribution.. Table 3. Pearson correlations of ocular components Sex -0.031. VCD (mm) Age -0.021 Gender 0.012 Dsph -0.850** AL 0.958** CCT 0.348** ACD 0.684** LT -0.633** Dsph = spherical equivalent refractive error; AL = axial length; CCT = central corneal thickness; ACD = anterior chamber depth; LT = lens thickness; VCD = vitreous chamber depth. * Correlation is significant at the p < 0.05 level; **Correlation is significant at the p < 0.01 level. For gender, male=1, female=2.. 328. Dsph (diopters) 0.075* 0.035*. AL (mm) -0.006 -0.007 -0.915**. CCT (mm) -0.003 -0.099** -0.365** 0.360**. ACD (mm) -0.033 -0.027 -0.885** -0.885** 0.229**. LT (mm) 0.105** -0.027 0.596** -0.505** -0.263** -0.530**.
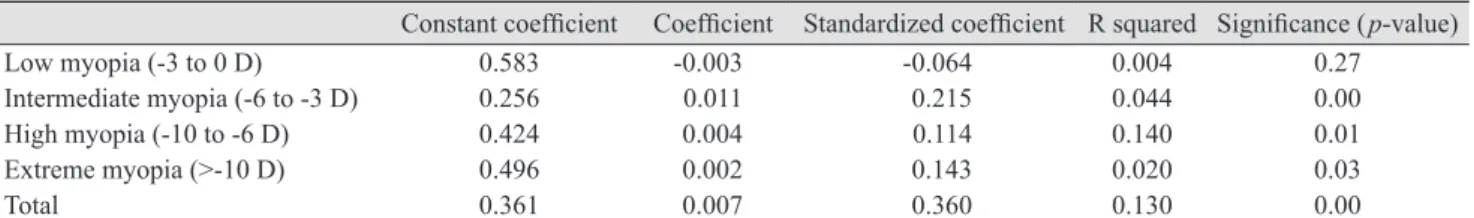
(6) SK Lee, et al. Positive Correlation between CCT and AL. Table 4. The regression for CCT with AL according to myopic degree Constant coefficient Coefficient Standardized coefficient R squared Significance (p-value) Low myopia (-3 to 0 D) 0.583 -0.003 -0.064 0.004 0.27 Intermediate myopia (-6 to -3 D) 0.256 0.011 0.215 0.044 0.00 High myopia (-10 to -6 D) 0.424 0.004 0.114 0.140 0.01 Extreme myopia (>-10 D) 0.496 0.002 0.143 0.020 0.03 Total 0.361 0.007 0.360 0.130 0.00 In low myopia, there was no linear regression between CCT and AL; however, intermediate, high, and extreme myopia showed a positive correlation between CCT and AL. In high and extreme myopia, the regression was significant at the p < 0.05 level. Overall, CCT had a positive correlation with AL at the p < 0.01 level. CCT = central corneal thickness; AL = axial length; D = diopters.. Table 5. Multivariate regression test (enter method) for central corneal thickness Constant Age Sex Dsph (diopters) AL (mm) ACD (mm) LT (mm) VCD (mm) Dsph = spherical equivalent refractive error; chamber depth.. Coefficient Standardized coefficient Significance (p-value) 4.45E-12 1.00 1.61E-15 0 1.00 -5.44E-14 0 1.00 -2.48E-14 0 1.00 1.00 52.09 0.00 -1.00 -18.43 0.00 -1.00 -11.91 0.00 -1.00 -44.48 0.00 AL = axial length; ACD = anterior chamber depth; LT = lens thickness; VCD = vitreous. From the results of the present study, we propose that, if the progression of myopia was small, CCT was not affected, i.e., VCD was primarily affected. However, when the change was >-3 diopters, the cornea may respond to the change. Some passive protective mechanism may be involved to prevent the cornea from excess thinning. The protective mechanism seems to vary according to ethnic, genetic, or environmental factors. In Koreans, for myopic change >-3 diopters, some kind of active protective mechanism may be involved, and CCT was relatively thickened. Alternatively, the patients who had factors which deteriorated to a greater extent than intermediate myopia inexplicably had thick corneas before the myopia progressed. Also, we revealed that CCT of myopic Korean myopic patients is different from those of Chinese and Japanese patients. Korean myopes show a positive relationship between CCT and AL. A long-term, serial follow-up study is required to reveal the correlation among myopia, AL, and CCT.. Conflict of Interest No potential conflict of interest relevant to this article was reported.. References 1. Pesando PM, Ghiringhello MP, Tagliavacche P. Posterior chamber collamer phakic intraocular lens for myopia and hyperopia. J Refract Surg 1999;15:415-23. 2. Yaylali V, Kaufman SC, Thompson HW. Corneal thickness measurements with the Orbscan Topography System and ultrasonic pachymetry. J Cataract Refract Surg 1997;23:1345-50. 3. Shimmura S, Yang HY, Bissen-Miyajima H, et al. Posterior corneal protrusion after PRK. Cornea 1997;16:686-8. 4. Probst LE, Machat JJ. Mathematics of laser in situ keratomileusis for high myopia. J Cataract Refract Surg 1998;24:190-5. 5. Ehlers N, Bramsen T, Sperling S. Applanation tonometry and central corneal thickness. Acta Ophthalmol (Copenh) 1975;53:34-43. 6. Doughty MJ, Zaman ML. Human corneal thickness and its impact on intraocular pressure measures: a review and meta-analysis approach. Surv Ophthalmol 2000;44:367408. 7. Whitacre MM, Stein RA, Hassanein K. The effect of corneal thickness on applanation tonometry. Am J Ophthalmol 1993;115:592-6. 8. Wolfs RC, Klaver CC, Vingerling JR, et al. Distribution of central corneal thickness and its association with intraocular pressure: the Rotterdam Study. Am J Ophthalmol 1997;123:767-72. 9. Brandt JD, Beiser JA, Kass MA, Gordon MO. Central corneal thickness in the Ocular Hypertension Treatment Study. 329.
(7) Korean J Ophthalmol Vol.26, No.5, 2012. (OHTS). Ophthalmology 2001;108:1779-88. 10. Osuobeni EP. Ocular components values and their intercorrelations in Saudi Arabians. Ophthalmic Physiol Opt 1999;19:489-97. 11. Aghaian E, Choe JE, Lin S, Stamper RL. Central corneal thickness of Caucasians, Chinese, Hispanics, Filipinos, African Americans, and Japanese in a glaucoma clinic. Ophthalmology 2004;111:2211-9. 12. Shimmyo M, Orloff PN. Corneal thickness and axial length. Am J Ophthalmol 2005;139:553-4. 13. Kunert KS, Bhartiya P, Tandon R, et al. Central corneal thickness in Indian patients undergoing LASIK for myopia. J Refract Surg 2003;19:378-9. 14. Von Bahr G. Corneal thickness; its measurement and changes. Am J Ophthalmol 1956;42:251-66. 15. Alsbirk PH. Corneal thickness. I. Age variation, sex difference and oculometric correlations. Acta Ophthalmol (Copenh) 1978;56:95-104. 16. Chang SW, Tsai IL, Hu FR, et al. The cornea in young myopic adults. Br J Ophthalmol 2001;85:916-20. 17. Srivannaboon S. Relationship between corneal thickness and level of myopia. J Med Assoc Thai 2002;85:162-6. 18. Touzeau O, Allouch C, Borderie V, et al. Correlation between refraction and ocular biometry. J Fr Ophtalmol 2003;26:355-63. 19. Martola EL, Baum JL. Central and peripheral corneal thickness: a clinical study. Arch Ophthalmol 1968;79:28-30. 20. Hansen FK. A clinical study of the normal human central corneal thickness. Acta Ophthalmol (Copenh) 1971;49:82-9. 21. Cho P, Lam C. Factors affecting the central corneal thick-. 330. ness of Hong Kong-Chinese. Curr Eye Res 1999;18:368-74. 22. Price FW Jr, Koller DL, Price MO. Central corneal pachymetry in patients undergoing laser in situ keratomileusis. Ophthalmology 1999;106:2216-20. 23. Liu Z, Pflugfelder SC. The effects of long-term contact lens wear on corneal thickness, curvature, and surface regularity. Ophthalmology 2000;107:105-11. 24. Pedersen L, Hjortdal J, Ehlers N. Central corneal thickness in high myopia. Acta Ophthalmol Scand 2005;83:539-42. 25. Fam HB, How AC, Baskaran M, et al. Central corneal thickness and its relationship to myopia in Chinese adults. Br J Ophthalmol 2006;90:1451-3. 26. Lim SJ, Choi O. Interrelationship of the refractory error and the ocular axial length and the anterior chamber depth in the myopic eyes. J Korean Ophthalmol Soc 1986;27:3716. 27. Rao SN, Raviv T, Majmudar PA, Epstein RJ. Role of Orbscan II in screening keratoconus suspects before refractive corneal surgery. Ophthalmology 2002;109:1642-6. 28. Drexler W, Findl O, Menapace R, et al. Partial coherence interferometry: a novel approach to biometry in cataract surgery. Am J Ophthalmol 1998;126:524-34. 29. Goss DA, Van Veen HG, Rainey BB, Feng B. Ocular components measured by keratometry, phakometry, and ultrasonography in emmetropic and myopic optometry students. Optom Vis Sci 1997;74:489-95. 30. Foster PJ, Baasanhu J, Alsbirk PH, et al. Central corneal thickness and intraocular pressure in a Mongolian population. Ophthalmology 1998;105:969-73..
(8)
수치
관련 문서
Hyung-Cheul Shin, [email protected], 011-9791-1645, Hallym University Duke University Medical?. Center neurobiologist Miguel Nicolelis with an owl monkey and a robot
Figure 6.23 Comparison of the average absorption coefficient between the honeycomb panel and HMPP for a 25-mm core thickness.. 174 Figure 6.24 Comparison of STL between
Mean thickness of palate including bone and soft tissue according to Level at 2 and 4 mm laterally from antero-posterior reference line in
The Dynamic Mechanical Analysis is a high precision technique for measuring the viscoelastic properties of materials. It consists in applying a sinusoidal deformation to a
Temperature sensor Angioplasty for canine common carotid artery. 0.6
UI/UX 평가 평가 UX Evaluation : UX Evaluation : 사용자경험 리서치 매뉴얼 사용자경험 리서치
extent to which a system, product or service can be used by specified users to achieve specified goals with effectiveness, efficiency and satisfaction in a specified context
강좌 소개 강좌 소개 멀티미디어의 이해 멀티미디어의
