INTRODUCTION
Coronary computed tomography angiography (CCTA) is
Development and Validation of Generalized Linear Regression Models to Predict Vessel Enhancement on Coronary CT Angiography
Takanori Masuda, PhD
1, 5, Takeshi Nakaura, MD, PhD
3, Yoshinori Funama, PhD
4,
Tomoyasu Sato, MD, PhD
2, Toru Higaki, PhD
5, Masao Kiguchi, RT
5, Yoriaki Matsumoto, BS
1, Yukari Yamashita, RT
1, Naoyuki Imada, RT
1, Kazuo Awai, MD, PhD
5Departments of 1Radiological Technology and 2Diagnostic Radiology, Tsuchiya General Hospital, Hiroshima 730-8655, Japan; 3Department of Diagnostic Radiology, Graduate School of Medical Sciences, Kumamoto University, Kumamoto 860-8556, Japan; 4Department of Medical Physics, Faculty of Life Sciences, Kumamoto University, Kumamoto 860-0811, Japan; 5Department of Diagnostic Radiology, Graduate School of Biomedical Sciences, Hiroshima University, Hiroshima 734-8553, Japan
Objective: We evaluated the effect of various patient characteristics and time-density curve (TDC)-factors on the test bolus-affected vessel enhancement on coronary computed tomography angiography (CCTA). We also assessed the value of generalized linear regression models (GLMs) for predicting enhancement on CCTA.
Materials and Methods: We performed univariate and multivariate regression analysis to evaluate the effect of patient characteristics and to compare contrast enhancement per gram of iodine on test bolus (∆HUTEST) and CCTA (∆HUCCTA). We developed GLMs to predict ∆HUCCTA. GLMs including independent variables were validated with 6-fold cross-validation using the correlation coefficient and Bland–Altman analysis.
Results: In multivariate analysis, only total body weight (TBW) and ∆HUTEST maintained their independent predictive value (p < 0.001). In validation analysis, the highest correlation coefficient between ∆HUCCTA and the prediction values was seen in the GLM (r = 0.75), followed by TDC (r = 0.69) and TBW (r = 0.62). The lowest Bland–Altman limit of agreement was observed with GLM-3 (mean difference, -0.0 ± 5.1 Hounsfield units/grams of iodine [HU/gI]; 95% confidence interval [CI], -10.1, 10.1), followed by ∆HUCCTA (-0.0 ± 5.9 HU/gI; 95% CI, -11.9, 11.9) and TBW (1.1 ± 6.2 HU/gI; 95% CI, -11.2, 13.4).
Conclusion: We demonstrated that the patient’s TBW and ∆HUTEST significantly affected contrast enhancement on CCTA images and that the combined use of clinical information and test bolus results is useful for predicting aortic enhancement.
Keywords: MDCT; Computed tomography; Heart; Aorta contrast medium; Aortic enhancement; Cardiac output
Received January 17, 2018; accepted after revision April 24, 2018.
Corresponding author: Takanori Masuda, PhD, Department of Radiological Technology, Tsuchiya General Hospital, Nakajima-cho 3-30 Naka-ku, Hiroshima 730-8655, Japan.
• Tel: (8182) 243-9191 • Fax: (8182) 243-9216
• E-mail: [email protected]
This is an Open Access article distributed under the terms of the Creative Commons Attribution Non-Commercial License (https://creativecommons.org/licenses/by-nc/4.0) which permits unrestricted non-commercial use, distribution, and reproduction in any medium, provided the original work is properly cited.
a noninvasive test with a negative-predictive value of nearly 100% for the detection of coronary disease (1). As sufficient vascular enhancement is a prerequisite for the accurate detection of coronary artery stenosis on CCTA, the acquisition of diagnostic-quality images in clinical practice can be difficult (2, 3). Intracoronary attenuation of less than 200 Hounsfield units (HU) tends to result in significant overestimation of stenosis, while attenuation above 500 HU can lead to a significant underestimation thereof in smaller vessels (4). The optimal vascular
attenuation for the detection of coronary artery stenosis on CCTA is approximately 350 HU (4).
Korean J Radiol 2018;19(6):1021-1030 pISSN 1229-6929 · eISSN 2005-8330
To determine the appropriate CT number for different contrast medium (CM) protocols, contrast enhancement on CCTA images must be predictable. The pharmacological compartment model has been employed for contrast enhancement simulation. It applies patient characteristics (i.e., the age, height, weight, and cardiovascular status) (5, 6) and convolution, based on using the test bolus (7, 8). However, these techniques require the application of specific algorithms. We and others (9-11) recommended protocols in which the CM dose is adjusted based on the patient’s body size, or using contrast enhancement elicited by a test bolus (7, 12). While these techniques can be easily applied, in some patients, we observed poor or extremely high contrast enhancement.
In the current study, we investigated whether the combined application of multiple factors, e.g., various patient characteristics and time-density curve (TDC) factors of the test bolus, facilitates the accurate prediction of contrast enhancement on CCTA images. We also examined whether generalized linear regression models (GLMs) help to predict enhancement of the ascending aorta on CCTA.
MATERIALS AND METHODS
This prospective study received Institutional Review Board approval; prior written informed consent to participate was obtained from all patients.
Patients
Between April 2015 and September 2016, 227 patients were considered for inclusion in this prospective study.
In this study, we excluded patients with a left ventricular ejection fraction of 0.30 or less on transthoracic
echocardiography before CCTA. Their serum creatinine level was obtained within 3 months prior to contrast-enhanced studies, and their estimated glomerular filtration rate (eGFR) was calculated using the modification of diet in renal disease formula of the Japanese Society of Nephrology (13, 14). Our inclusion criteria were suspected or confirmed coronary artery disease and referral for a CCTA study for clinical reasons, based on guidelines promulgated by the American College of Cardiology (15). We recorded the total body weight (TBW) to tailor the amount of CM used. We also recorded the patients’ height for the calculation of other body parameters and other demographic data (Table 1).
As we excluded 5 patients with renal failure (eGFR less than 30 mL/min/1.73 m2), a history of allergic reactions to
iodinated CM, or proven or suspected pregnancy, our final study population consisted of 222 patients. This included 102 males and 120 females, ranging in age from 40 years to 95 years (mean, 71.6 years); their TBW ranged from 30.0 kg to 83.0 kg (mean, 58.0 kg).
CT Scanning and Contrast Injection Protocols All patients were scanned on a 64-detector row CT scanner (Lightspeed VCT; GE Healthcare, Milwaukee, WI, USA); retrospective electrocardiography-triggered helical scans were performed. The CT scanning parameters were 0.35-second and rotation, 0.625-mm detector row width, 0.2 helical pitch (beam pitch), 8.0-mm table movement, 50-cm scan field-of-view (FOV), 100 kVp, and 400–770 mA.
All scans were from the top of the left atrial appendage to the level of the inferior margin of the cardiac apex, in the craniocaudal direction. All patients were able to hold their breaths during the examination. Image reconstruction was performed in a 15- to 20-cm display FOV, depending on the patient’s body size. Each patient was given nitroglycerin sublingually (0.3 mg) 5 minutes before scanning. Patients whose heart rates exceeded 65 beats per minutes after its administration additionally received landiolol hydrochloride (Corebeta; Ono pharmacological Co., Ltd., Osaka, Japan).
The injection protocols are summarized in Table 2. We injected CM (iomeprol [Iomeron]; Eisai Co., Ltd., Osaka, Japan) through a 20-gauge catheter into the antecubital vein using a power injector (Dual Shot; Nemoto-Kyorindo Co., Ltd., Osaka, Japan). For the test bolus scanning, the CM was diluted (30% contrast material, 70% saline); the injection volume and rate were TBW x 0.6 mL and TBW x 0.05 mL/s administered for 12 seconds, respectively. For Table 1. Patients’ Demographic Data
Sex (male/female) 200 (102/120)
Age (years) 71.6 ± 9.9
Height (cm) 158.8 ± 9.2
TBW (kg) 58.0 ± 10.3
Body surface area (m2) 1.6 ± 0.2
Mean heart rate (bpm) 65.6 ± 9.9
CO (L/min) 3.1 ± 0.7
Renal function (mL/min/1.73 m2) 64.4 ± 12.2
Hypertension, n (%) 122 (55)
Hyperlipidemia, n (%) 78 (33)
Smoking, n (%) 25 (11)
Diabetes, n (%) 54 (24)
Values are given as mean ± standard deviation or n (%) unless otherwise indicated. bpm = beats per minutes, CO = cardiac output, TBW = total body weight
the CCTA scanning, the injection volume and rate were TBW x 0.6 and TBW x 0.05 mL/s administered for 12 seconds, respectively. CM delivery was followed by flushing with 20 mL of physiological saline at the same injection rate. To monitor the ascending aorta, we obtained dynamic low- dose (100 kVp, 50 mAs) scans; the interscan interval was 1.0 seconds. Acquisition of the dynamic monitoring scans began 10 seconds after the start of contrast injection. A region of interest (ROI) was placed inside the ascending aorta to obtain a time-attenuation curve for aortic peak- time measurements. We recorded aortic peak enhancement by constructing time-enhancement curves by connecting all time points. The arrival time in the ascending aorta was defined as the duration from the scan delay of the test bolus injection to the time of peak aortic enhancement.
Using the arrival time data, the scan delay for CCTA was set at the arrival time plus 2.0 seconds post-injection (16).
Data Analysis
The mean CT number (in HU) for the ascending aorta was recorded for all patients on a CT console monitor by placement of a circular ROI cursor; the ROI diameter ranged from 10 mm to 30 mm. CT numbers in the ascending aorta were measured on an unenhanced image of the test bolus with acquisition for the dynamic monitoring scans and subsequent CCTA with a standard kernel. Areas of calcification and artifacts were carefully excluded from the ROI. The degree of contrast enhancement was expressed as the change in the CT number (∆HU) and was calculated by subtracting the CT number on unenhanced images from that on contrast-enhanced images of the ascending aorta.
As in earlier studies, factors with an effect on contrast enhancement, i.e., the patient’s age, sex, TBW, and height, were recorded (17, 18). We acquired their age and sex from their electronic health records. Their TBW and height were obtained immediately prior to CCTA scanning. We measured the patients’ cardiac output (CO) with a non-invasive CO
monitor (Aesculon mini; Ospyka Medical, Berlin, Germany) that continuously displayed the CO; the average CO during 30 valid cardiac cycles was recorded.
Model Development and Validation
We developed the GLM using a combination of the independent variables that had a significant effect on enhancement per gram of iodine on CCTA (∆HUCCTA) (enhancement per gram of iodine on test bolus [∆HUTEST]
and TBW) in multivariate analysis, and also developed two conventional predicting models, using ∆HUTEST and TBW, as controls.
Previous reports have suggested that the vessel
enhancement at the test bolus is linearly correlated to the vessel enhancement by the full bolus (9, 10). Therefore, the predicted ∆HUCCTA in the following equation of a given
∆HUTEST (model 1) was calculated as follows:
∆HU/gIave x ∆HU/gItest
Pr =
∆HU/gItest-ave
where ∆HU/gIave (∆HUCCTAave) is the average of ∆HUCCTA (HU/grams of iodine [gI]), ∆HU/gItest-ave (∆HUTESTave) is the average of ∆HUTEST, and ∆HU/gItest (∆HUTEST) is a given
∆HUTEST (HU/gI). Previous reports have suggested that body size parameters, such as TBW, are inversely correlated to the enhancement by the fixed amount of contrast material (12, 19). Therefore, the predicted ∆HUCCTA of a given TBW (model 2) was determined as follows:
∆HU/gIave x TBWave
Pr = TBW
where ∆HU/gIave is the average of ∆HUCCTA (HU/gI), TBWave
(TBWave) is the average of TBW (kg), and TBW is a given TBW (kg).
We also developed a GLM to predict ∆HUCCTA using all independent variables (patients’ age, sex, TBW, CO,
∆HUTEST, and peak time of test). With the aid of Akaike Information Criterion (AIC) analysis, we selected two independent variables (∆HUCCTA and TBW) for the predictive model. Therefore, the GLM-predicted ∆HUCCTA, using a given ∆HUTEST and TBW (model 3), was determined as follows:
Pr = ea x ∆HU/gItest + b x TBW + c
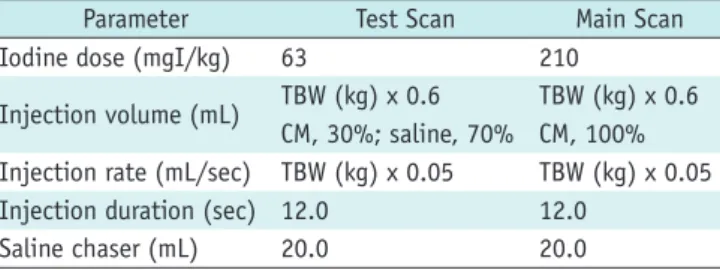
Table 2. Contrast Injection Protocol for Coronary Computed Tomographic Angiography Test Scan and Subsequent Scans
Parameter Test Scan Main Scan
Iodine dose (mgI/kg) 63 210
Injection volume (mL) TBW (kg) x 0.6 TBW (kg) x 0.6 CM, 30%; saline, 70% CM, 100%
Injection rate (mL/sec) TBW (kg) x 0.05 TBW (kg) x 0.05 Injection duration (sec) 12.0 12.0
Saline chaser (mL) 20.0 20.0
CM = contrast medium
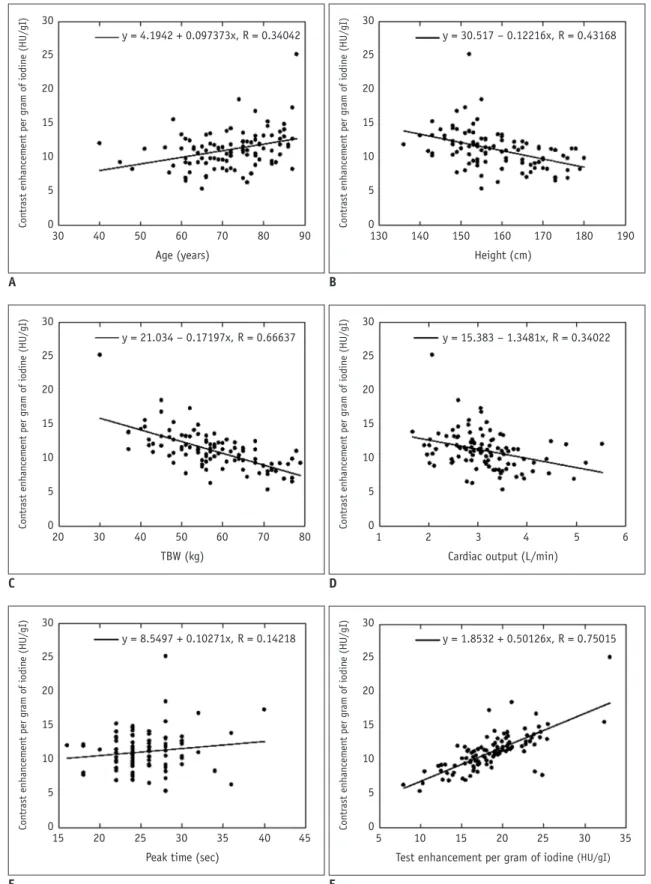
Fig. 1. Scattergrams of relationship between aortic enhancement and scan protocols using TBW for selecting iodinated contrast material dose and patient age (A), height (B), TBW (C), cardiac output (D), peak time (E), and ΔHUTEST (F). There was significant positive correlation between ∆HUCCTA and age (r = 0.34). Inverse correlation was seen between ∆HUCCTA and TBW (r = 0.67), height (r = 0.43), CO (r = 0.34), and ∆HUTEST (r = 0.75) by linear regression analysis (p < 0.01 for all). There was no significant correlation between peak time of test bolus and ∆HUCCTA (r = 0.14, p = 0.142). gI = grams of iodine, HU = Hounsfield units, TBW = total body weight,
∆HUCCTA = per gram of iodine on coronary computed tomography angiography, ∆HUTEST = per gram of iodine on test bolus 30
25 20 15 10 5 0
Contrast enhancement per gram of iodine (HU/gI)
30 40 50 60 70 80 90
Age (years)
y = 4.1942 + 0.097373x, R = 0.34042
A
30 25 20 15 10 5 0
Contrast enhancement per gram of iodine (HU/gI)
130 140 150 160 170 180 190
Height (cm)
y = 30.517 – 0.12216x, R = 0.43168
B 30
25 20 15 10 5 0
Contrast enhancement per gram of iodine (HU/gI)
20 30 40 50 60 70 80
TBW (kg)
y = 21.034 – 0.17197x, R = 0.66637
C
30 25 20 15 10 5 0
Contrast enhancement per gram of iodine (HU/gI)
1 2 3 4 5 6
Cardiac output (L/min)
y = 15.383 – 1.3481x, R = 0.34022
D 30
25 20 15 10 5 0
Contrast enhancement per gram of iodine (HU/gI)
15 20 25 30 35 40 45
Peak time (sec)
y = 8.5497 + 0.10271x, R = 0.14218
E
30 25 20 15 10 5 0
Contrast enhancement per gram of iodine (HU/gI)
5 10 15 20 25 30 35
Test enhancement per gram of iodine (HU/gI) y = 1.8532 + 0.50126x, R = 0.75015
F
where ∆HU/gItest is a given ∆HUTEST (HU/gI), TBW is a given TBW (kg), a and b are the estimated coefficients, and c is a constant term.
Statistical Analysis
Statistical analyses were performed with the free statistical software “R” (version 3.2.2; The R Project for Statistical Computing; http://www.r-project.org/). The relationship between ∆HUCCTA and the patient’s age, sex, TBW, CO, ∆HUTEST, and the peak time with the test bolus was assessed by univariate linear regression analysis.
We calculated the Pearson product-moment correlation coefficient (r) to determine the strength of associations.
Welch’s t test was used to compare ∆HUCCTA of males and females. We also performed multivariate regression analysis to determine independent and significant covariates that affected the ∆HUTEST values and calculated the standardized regression coefficient (β) to assess the strength of associations.
We developed predictive models using independent factors that had significant effects on ∆HUCCTA, and constructed GLMs using a combination of all the independent variables in multivariate analysis. The decision to include or exclude parameters in the final model was based on the AIC, a measure that is a function of both training error and complexity, because additional factors may result in a better mathematical fit that yields no additional biological information by overfitting to the training data.
To assess the validity of the models across various samples, we performed a 6-fold cross-validation; in this process, we trained the GLMs using 185 (37 x 5) patients and validated these models on another 37 patients. The correlation among the models with variables independently associated with ∆HUCCTA and GLM was assessed by calculating Pearson’s correlation coefficient. Bland–Altman analysis was used to predict the contrast enhancement
errors among all models. We calculated the residual values between the predicted values and the true values for all models. We compared residual values by using analysis of variance (ANOVA). When the residual value was significantly different according to ANOVA, we compared each model by using the t test with Holm post-hoc correction.
A p value of less than 0.05 was considered to indicate a statistically significant difference, and all interval estimations shown are 95% confidence intervals (CIs).
RESULTS
Univariate and Multivariate Analysis of ΔHUCCTA As shown in Figure 1A and F, univariate linear regression analysis revealed a correlation between the ∆HUCCTA and patients’ age (r = 0.34), and ∆HUTEST (r = 0.75). The radiation dose for the dose-length product (mGy-cm) and scan duration of the test bolus were 3.8 ± 1.5 mGy-cm and 10.2 ± 4.2 seconds. There was an inverse correlation between the ∆HUCCTA and the height (r = 0.43), TBW (r = 0.67), and CO (r = 0.34) of patients (Fig. 1B-D) and their effect on the ∆HUCCTA (r = 0.69, p < 0.001 for all). We saw no significant correlation between the peak time of the test bolus and the ∆HUCCTA (r = 0.14) (Fig. 1E). The average
∆HUCCTA was significantly higher in females than in males (34.6 ± 7.2 vs. 29.3 ± 7.0 HU/gI, p < 0.001).
Multivariate linear regression analysis showed that only the TBW and ∆HUTEST retained their independent predictive value (p < 0.001) (Table 3). Calculation of the standardized regression coefficient revealed that the highest correlation between the ∆HUCCTA and independent variables was observed for the TBW (β = -0.303). The strength of association between the ∆HUTEST and the ∆HUCCTA value was β = 0.503.
Figures 2 and 3 show the results of the 6-fold cross- validation analysis. The highest correlation coefficient Table 3. Results of Multivariate Linear Regression Analysis for CT Number Per Gram of Iodine (HU/gI) on Coronary CT Angiography Scans
Regression Coefficient Standard Error Beta P
Sex -0.158 1.005 -0.01 0.880
Age (year) 0.011 0.041 0.014 0.791
TBW (kg) -0.22 0.046 -0.303 < 0.001
CO (L/min) -0.441 0.567 -0.042 0.442
Height (cm) -0.034 0.061 -0.042 0.584
HU/gI on test scan 0.373 0.039 0.503 < 0.001
Peak time on test scan 0.092 0.105 0.044 0.382
gI = grams of iodine, HU = Hounsfield units
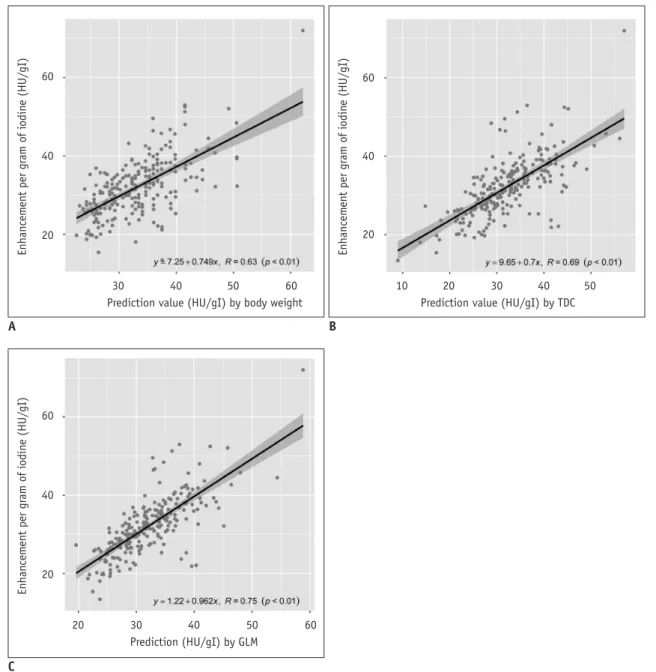
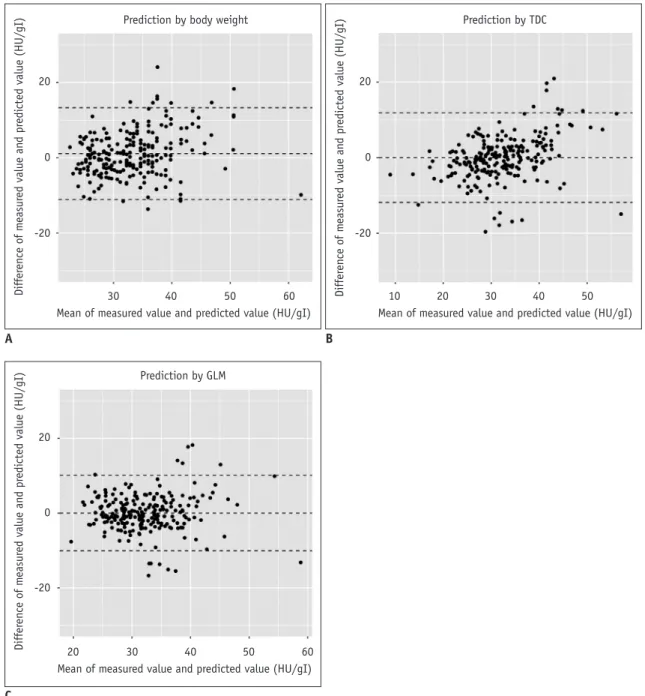
between ∆HUCCTA and the prediction values was seen in GLMs (r = 0.75), followed by TDC (r = 0.69) and TBW (r = 0.62). The lowest Bland–Altman limit of agreement was observed with GLMs (mean difference -0.0 ± 5.0 HU/gI, 95% CI: -10.1, 10.1 HU/gI), ∆HUCCTA (-0.0 ± 5.9 HU/gI, 95% CI: -11.9, 11.9 HU/gI), and TBW (1.1 ± 6.1 HU/gI, 95% CI: -11.1, 13.3 HU/gI) (Fig. 3). The residual values were 3.67 ± 3.46, 4.29 ± 4.10, and 4.78 ± 4.02 for the GLM, ∆HUTEST, and TBW. There was a significant difference in the residual value with the ANOVA test. In the post-hoc analysis, the residual values of the GLM were significantly lower than that of the TBW (p < 0.001) and ∆HUTEST (p
< 0.001). Additionally, there was no significant difference between the residual value of the ∆HUTEST and TBW (p = 0.129).
Finally, we calculated the final parameters of three models. In this study, the ∆HUCCTAave was 32.2 ± 7.6 HU/
gI, and the ∆HUTESTave was 44.3 ± 10.2 HU/gI; therefore, Pr was predicted by the following formula, Pr = 0.726 x ∆HUTEST with model 1. In this study, the ∆HUCCTAave
was 32.2 ± 7.6 HU/gI, and the TBWave was 58.1 ± 10.4 kg; therefore, Pr was predicted by following formula, Pr = 1870.7 ÷ TBW with model 2. If they were estimated for all patients in this study, a was 0.012 (95% CI, 0.0011, 0.0013),
Fig. 2. Scattergrams of relationship between ΔHUCCTA and GLMs using TBW (A), TDC (B), and GLMs (C). By validation analysis, GLMs manifested highest correlation coefficient with prediction values (r = 0.75), followed by TDC (r = 0.69) and TBW (r = 0.62). GLMs = generalized linear regression models, TDC = time-density curve
30 40 50 60
Prediction value (HU/gI) by body weight 60
40
20
Enhancement per gram of iodine (HU/gI)
A
30
20 40 50 60
Prediction (HU/gI) by GLM 60
40
20
Enhancement per gram of iodine (HU/gI)
C
10 20 30 40 50
Prediction value (HU/gI) by TDC 60
40
20
Enhancement per gram of iodine (HU/gI)
B
b was -0.0076 (95% CI, 0.0065, 0.087), and c was 3.36 (95%
CI, 3.35, 3.37); therefore, Pr was predicted by following formula, Pr = e0.012 x ∆HU/gItest – 0.0076 x TBW + 3.36 with mode 3.
Figure 4 shows a representative case.
DISCUSSION
Our multivariate analysis showed that only TBW and the
∆HUTEST maintained their independent predictive value (p
< 0.001). Our GLMs yielded a more accurate prediction of the contrast enhancement in CCTA than did the result of the test bolus or the patient’s TBW.
According to univariate analysis, the TBW, age, sex, CO, and height of patients significantly affected contrast enhancement. However, based on multivariate linear regression analysis, only TBW had a significant effect on aortic enhancement, while the other factors did not. Bae’s suggestion that the CO directly affects vessel enhancement
Fig. 3. Bland–Altman limit of relationship between difference in measured value and predicted value, and mean of measured value and predicted value obtained for GLMs using TBW (A), TDC (B), and GLMs (C). Lowest Bland–Altman limit of agreement observed with GLMs (mean difference -0.0 ± 5.0 HU/gI, 95% CI: -10.1, 10.1 HU/gI), ∆HUCCTA (-0.0 ± 5.9 HU/gI, 95% CI: -11.9, 11.9 HU/gI), and TBW (1.1 ± 6.1 HU/gI, 95% CI: -11.1, 13.3 HU/gI). CI = confidence interval
30 40 50 60
Mean of measured value and predicted value (HU/gI) Prediction by body weight
20
0
-20
Difference of measured value and predicted value (HU/gI)
A
30
10 20 40 50
Mean of measured value and predicted value (HU/gI) Prediction by TDC
20
0
-20
Difference of measured value and predicted value (HU/gI)
B
C
30 40 50 60
Mean of measured value and predicted value (HU/gI) Prediction by GLM
20
0
-20
Difference of measured value and predicted value (HU/gI)
20
by CM (20) appears to differ from our findings. In our study, CO had little effect on aortic enhancement, possibly because our CM injection duration was short. Elsewhere (12), we have reported that, under shorter injection duration protocols, the TDC was bell-shaped, regardless of cardiac function. This may explain why CO did not strongly influence aortic enhancement. We included TBW and CO as independent variables in our multivariate linear regression analysis, and suspect that they may have obscured the relationship between other independent variables (age, sex, and height) and aortic enhancement.
The correlation between the ∆HUTEST of the ascending aorta and the ∆HUCCTA was stronger than that with TBW. The test injection is a good indicator for predicting peak enhancement before CCTA (12, 19). While CM-dose
correction using TBW cannot correct for factors such as the body-fat percentage, cardiac function, and vessel resistance, test injection allows for the necessary corrections. In our test injection, we diluted the CM, and the amount of diluted CM that was reported to be better for accurate prediction of contrast enhancement than the general test bolus protocols, which use a small amount of undiluted CM (19). Therefore, we consider that our prediction model using the ∆HUTEST predicts contrast enhancement of CCTA images more accurately than does TBW.
Our findings also suggest that the GLMs using TBW and the ∆HUTEST more accurately predict CM enhancement on CCTA images than do TBW or ∆HUTEST alone. In our GLMs, we applied independent variables, i.e., the ∆HUCCTA and the TBW, which had a significant effect on ∆HUCCTA. We
A B
C D
0 10 20 30 40 50 60 70 Time from start injection (sec)
250 200 150 100 50 0
CT number of test scan (HU)
Fig. 4. 67-year-old woman with chest pain.
Axial images (A-C) and TDC (D) are shown. ∆HUTEST was 60.2 HU/mgI and TBW was 67 kg. Predicted ∆HUCCTA was calculated with GLM-1 (∆HUTEST) as 43.7 HU/gI, with GLM-2 (TBW) as 27.9 HU/gI, and with GLM-3 as 35.6 HU/gI. Actual ∆HUCCTA was 35.3 HU/gI.
also applied a combination of independent variables. While the GLMs using ∆HUTEST were superior to those using TBW, they tended to predict higher CM enhancement than was seen on CCTA. Svensson et al. (21), who evaluated the relationship between heart rate variability during CCTA and the CM concentration, concluded that iso-osmolar CM does not increase the heart rate and elicits less heart arrhythmia than low-osmolar CM. We consider that the hemodynamic changes produced by different CM concentrations result in differences in vessel enhancement. In our study, using the TBW may have corrected for such errors and may have resulted in our observation that the GLMs that used a combination of the TBW and ∆HUTEST had a higher predictive value than the other GLMs.
Our study had some limitations. First, the range and mean TBWs of our Japanese patients was lower than those of North American and European individuals. Second, ours was a single-center study and the study population was small.
Third, our test bolus protocol used the same CM amount as the CCTA protocol. Therefore, the prediction accuracy with respect to contrast enhancement on CCTA images may be lower when a conventional test bolus injection is delivered. Lastly, we did not compare our techniques with the compartment model and the mathematical convolution technique.
In conclusion, we have demonstrated that patients’ TBW and the ∆HUTEST significantly affect contrast enhancement of the ascending aorta on CCTA images. We recommend the combined use of clinical and test bolus data for the prediction of aortic enhancement on CCTA.
REFERENCES
1. Gilard M, Cornily JC, Pennec PY, Joret C, Le Gal G, Mansourati J, et al. Accuracy of multislice computed tomography in the preoperative assessment of coronary disease in patients with aortic valve stenosis. J Am Coll Cardiol 2006;47:2020-2024 2. Cademartiri F, Mollet NR, Lemos PA, Saia F, Midiri M, de
Feyter PJ, et al. Higher intracoronary attenuation improves diagnostic accuracy in MDCT coronary angiography. AJR Am J Roentgenol 2006;187:W430-W433
3. Becker CR, Hong C, Knez A, Leber A, Bruening R, Schoepf UJ, et al. Optimal contrast application for cardiac 4-detector-row computed tomography. Invest Radiol 2003;38:690-694 4. Fei X, Du X, Yang Q, Shen Y, Li P, Liao J, et al. 64-MDCT
coronary angiography: phantom study of effects of vascular attenuation on detection of coronary stenosis. AJR Am J Roentgenol 2008;191:43-49
5. Bae KT, Heiken JP, Brink JA. Aortic and hepatic contrast
medium enhancement at CT. Part I. Prediction with a computer model. Radiology 1998;207:647-655 6. Bae KT, Heiken JP, Brink JA. Aortic and hepatic peak
enhancement at CT: effect of contrast medium injection rate- -pharmacokinetic analysis and experimental porcine model.
Radiology 1998;206:455-464
7. Fleischmann D, Hittmair K. Mathematical analysis of arterial enhancement and optimization of bolus geometry for CT angiography using the discrete fourier transform. J Comput Assist Tomogr 1999;23:474-484
8. Fleischmann D, Rubin GD, Bankier AA, Hittmair K. Improved uniformity of aortic enhancement with customized contrast medium injection protocols at CT angiography. Radiology 2000;214:363-371
9. Awai K, Hiraishi K, Hori S. Effect of contrast material injection duration and rate on aortic peak time and peak enhancement at dynamic CT involving injection protocol with dose tailored to patient weight. Radiology 2004;230:142-150 10. Bae KT, Seeck BA, Hildebolt CF, Tao C, Zhu F, Kanematsu M,
et al. Contrast enhancement in cardiovascular MDCT: effect of body weight, height, body surface area, body mass index, and obesity. AJR Am J Roentgenol 2008;190:777-784
11. Kondo H, Kanematsu M, Goshima S, Tomita Y, Kim MJ, Moriyama N, et al. Body size indexes for optimizing iodine dose for aortic and hepatic enhancement at multidetector CT: comparison of total body weight, lean body weight, and blood volume. Radiology 2010;254:163-169
12. Nakaura T, Awai K, Yanaga Y, Namimoto T, Utsunomiya D, Hirai T, et al. Low-dose contrast protocol using the test bolus technique for 64-detector computed tomography coronary angiography. Jpn J Radiol 2011;29:457-465
13. Imai E, Horio M, Nitta K, Yamagata K, Iseki K, Tsukamoto Y, et al. Modification of the Modification of Diet in Renal Disease (MDRD) study equation for Japan. Am J Kidney Dis 2007;50:927-937
14. Matsuo S, Imai E, Horio M, Yasuda Y, Tomita K, Nitta K, et al.;
Collaborators developing the Japanese equation for estimated GFR. Revised equations for estimated GFR from serum creatinine in Japan. Am J Kidney Dis 2009;53:982-992 15. Hendel RC, Patel MR, Kramer CM, Poon M, Hendel RC, Carr
JC, et al. ACCF/ACR/SCCT/SCMR/ASNC/NASCI/SCAI/SIR 2006 appropriateness criteria for cardiac computed tomography and cardiac magnetic resonance imaging: a report of the American College of Cardiology Foundation Quality Strategic Directions Committee Appropriateness Criteria Working Group, American College of Radiology, Society of Cardiovascular Computed Tomography, Society for Cardiovascular Magnetic Resonance, American Society of Nuclear Cardiology, North American Society for Cardiac Imaging, Society for Cardiovascular Angiography and Interventions, and Society of Interventional Radiology. J Am Coll Cardiol 2006;48:1475-1497
16. Kidoh M, Nakaura T, Awai K, Utsunomiya D, Sakaino N, Harada K, et al. Compact-bolus dynamic CT protocol with a test bolus technique in 64-MDCT coronary angiography: comparison
of fixed injection rate and duration protocol. Jpn J Radiol 2013;31:115-122
17. Awai K, Kanematsu M, Kim T, Ichikawa T, Nakamura Y, Nakamoto A, et al. The optimal body size index with which to determine iodine dose for hepatic dynamic CT: a prospective multicenter study. Radiology 2016;278:773-781
18. Fleischmann D. How to design injection protocols for multiple detector-row CT angiography (MDCTA). Eur Radiol 2005;15 Suppl 5:E60-E65
19. Masuda T, Funama Y, Imada N, Sato T, Yamagami T, Tatsugami
F, et al. Prediction of aortic enhancement on coronary CTA images using a test bolus of diluted contrast material. Acad Radiol 2014;21:1542-1546
20. Bae KT. Intravenous contrast medium administration and scan timing at CT: considerations and approaches. Radiology 2010;256:32-61
21. Svensson A, Ripsweden J, Rück A, Aspelin P, Cederlund K, Brismar BT. Heart rate variability and heat sensation during CT coronary angiography: low-osmolar versus iso-osmolar contrast media. Acta Radiol 2010;51:722-726