Introduction
Peri-implant bone foundation is an important factor affecting the success of dental implant treatment. Af- ter tooth extraction, the alveolar ridge commonly de- creases in volume.1 To prevent further bone resorption after implantation-especially in the anterior maxilla, which requires careful attention to provide esthetic out- comes-several parameters must be considered to limit stress on dental implants, including implant number, im- plant position, and the available bone.2
Misch(2008) reported that implant number and posi-
tion were influenced by the dental arch form in the pre- maxillary area due to the stress distribution around dental implants.3 A later study by Sagat et al.(2010) noted that favorable implant distributions in relation to stress con- centration were dissimilar across different maxillary alve- olar arch forms.4 These studies suggested that the most fa- vorable implant number and position were determined by the arch forms at the levels of both the dental and alveolar bone. Dental implants are placed at the alveolar bone lev- el, and implant position in the anterior zone is critical for the esthetic outcome; thus, anterior alveolar arch forms (AA arch forms) might be important for implant treatment planning and success.
Full arch forms have been identified and classified at the tooth level using plaster and 3-dimensional visual models.5-9 Ronay et al.(2008) reported the assessment of full arch forms at the alveolar bone level using the kera-
A novel classification of anterior alveolar arch forms and alveolar bone thickness: A cone- beam computed tomography study
Atcharee Bulyalert1, Atiphan Pimkhaokham1,2*
1Esthetic Restorative and Implant Dentistry Program
2Department of Oral and Maxillofacial Surgery, Faculty of Dentistry, Chulalongkorn University, Bangkok, Thailand
ABSTRACT
Purpose: This study classified alveolar arch forms and evaluated differences in alveolar bone thickness among arch forms in the anterior esthetic region using cone-beam computed tomography(CBCT) images.
Materials and Methods: Axial views of 113 CBCT images were assessed at the level of 3 mm below the cementoenamel junction(CEJ) of the right and left canines. The root center points of teeth in the anterior esthetic region were used as reference points. Arch forms were classified according to their transverse dimensions and the intercanine width-to-depth ratio. The buccolingual alveolar bone thickness of each tooth was measured at 3mm below the CEJ and at the mid-root level. Differences in the mean thicknesses among arch forms were analyzed.
Results: Anterior maxillary arches could be classified as long narrow, short medium, long medium, and long wide arches. Significant differences in buccolingual alveolar bone thickness among the arch groups were found at both levels. The long wide arches presented the greatest bone thickness, followed by the long medium arches, while the long narrow and short medium arches were the thinnest.
Conclusion: Arch forms were classified as long narrow, short medium, long medium, and long wide. The buccolingual alveolar bone thickness exhibited significant differences among the arch forms.(Imaging Sci Dent 2018; 48: 191-9)
KEY WORDS: Alveolar Process; Cone-Beam Computed Tomography
Copyright ⓒ 2018 by Korean Academy of Oral and Maxillofacial Radiology
This is an Open Access article distributed under the terms of the Creative Commons Attribution Non-Commercial License(http://creativecommons.org/licenses/by-nc/3.0) which permits unrestricted non-commercial use, distribution, and reproduction in any medium, provided the original work is properly cited.
Imaging Science in Dentistry·pISSN 2233-7822 eISSN 2233-7830 Received June 11, 2018; Revised July 27, 2018; Accepted August 1, 2018
*Correspondence to : Dr. Atiphan Pimkhaokham
Department of Oral and Maxillofacial Surgery, Faculty of Dentistry, Chulalongkorn University, 34 Henri-Dunant Rd., Wangmai, Pathumwan, Bangkok, 10330 Thailand Tel) 66-02-218-8662, Fax) 66-02-218-8664 E-mail) [email protected]
tinized tissue band superior to the mucogingival junction of the mandible(the WALA ridge) as the reference lev- el.10 However, this does not indicate the location of the implant and might be inaccurate due to interference from movable tissues. Recently, cone-beam computed tomog- raphy(CBCT) was introduced as a noninvasive technique to identify hard tissue in the buccolingual, mesiodistal, and apicocoronal dimensions. The use of CBCT to eval- uate bone surrounding the tooth or implant has been pre- viously validated.11-17 Moreover, studies have evaluated human full arch forms at the alveolar bone level using CBCT images18,19 The midpoints of the roots at the cor- onal third level of the right and left mandibular canines were set as reference points because they correspond to the vertical level of the WALA ridge.18,19
Another important factor is the available bone. Before placing implants, the alveolar bone at the implant site must be evaluated in 3 dimensions. Buccolingual bone width plays a critical role in esthetic success since buc- colingual bone supports the gingiva around the implant.
Buser et al.(2004) recommended that the implant should be placed about 1mm palatal to the point of emergence at the adjacent teeth.20 Grunder et al.(2005) reported that labial bone required at least 2mm of thickness to provide stability, decrease marginal bone loss, prevent gingival recession, and promote an esthetically favorable outcome after implant placement.21 Bone reconstruction should be performed in areas of insufficient bone to improve both the functional and esthetic results.22,23
Altogether, a deeper understanding of AA arch forms and buccolingual alveolar bone thickness in the esthet- ic zone could be helpful for defining and predicting the prognosis of implant treatment. A literature review failed to find any publications concerning alveolar arch forms in the anterior esthetic zone. Thus, this study aimed to clas- sify AA arch forms at the implant platform level and to investigate the differences in buccolingual alveolar bone thickness among AA arch forms using CBCT image data- sets.
Materials and Methods
Sample collection
Following Ethics Review Committee approval, 113 CBCT images without any technical errors or artifacts af- fecting diagnostic quality were retrospectively obtained from the patient database of the Faculty of Dentistry, Ch- ulalongkorn University. All the patients presented class I normal occlusion. The selected images exhibited all the
maxillary teeth from the right second molar to the left second molar without crowding or spacing. The exclusion criteria were periodontal disease, the presence of root canal filling materials or any restorations, malalignment of root center points, root resorption, and previous ortho- dontic treatment. All the images were obtained using a scanner(iCAT™; Imaging Sciences International, Hat- field, PA, USA) with a field of view measuring 160mm in diameter by 130mm in height, resulting in a 0.20-mm voxel size. Raw Digital Imaging and Communications in Medicine(DICOM) files of the CBCT images were im- ported into CBCT viewing software(Kodak Dental Im- aging Software 3D Module 2.4, CodeWeavers Inc., Saint Paul, MN, USA). Measurements were made by a single operator to ensure uniformity.
Image settings and measurements
The subject’s head position for each scan was reorient- ed. The axial plane was set parallel to the occlusal plane.
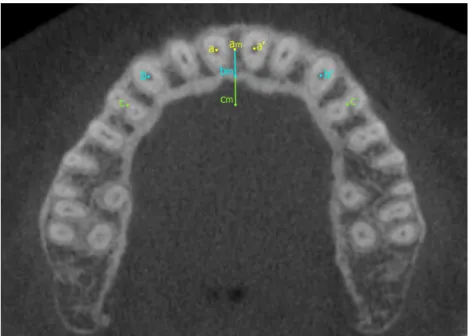
The sagittal plane was set parallel to the median palatine suture. The coronal plane was created perpendicular to both the axial and sagittal planes. The CBCT images were measured in the axial view at the level of 3mm below the cementoenamel junction(CEJ) of the right and left canines(Fig. 1). The root center points of the maxillary central incisors(a and aʹ), canines(b and bʹ), and first premolars(c and cʹ) were used as the reference points.
Three horizontal reference lines were created. The first reference line was created between the root center points of the maxillary right and left central incisors(aaʹ line).
The second reference line was drawn from the root cen- ter point of the right canine to the root center point of the left canine, and was referred to as the intercanine width (bbʹ line). The third reference line was drawn between the root center points of the right and left maxillary first premolars, and was referred to as the interpremolar width (ccʹ line). There were 2 vertical distances, the intercanine depth and interpremolar depth. The intercanine depth was the shortest distance that linked the intercanine width to the midpoint of the first reference line(ambm line). The interpremolar depth was the shortest distance that linked the interpremolar width to the midpoint of the first refer- ence line(amcm line). The intercanine width-to-depth ratio was calculated and was used as a parameter for AA arch form classification, along with intercanine width and in- terpremolar width, since the intercanine width-to-depth ratio represented the shape of the anterior arch, while the intercanine width and interpremolar width provided infor- mation about the anterior and posterior arch dimensions
of the esthetic zone, respectively. K-means cluster anal- ysis was performed to classify the subjects into several groups. The appropriate number in each group was deter- mined using the average silhouette width, which was the method used to identify dissimilarities in the same group and between groups. The optimal classification of groups exhibited the widest average silhouette width.
To identify the type of the AA arch form, a fourth-de- gree polynomial function was used according to previ- ous studies, with minor modifications.9,18,24 Briefly, the fourth-degree polynomial equation created smooth curves that approximately fit the X and Y coordinates. Thus, the X and Y coordinates of each CBCT image were es- tablished. The Y-axis was created parallel to the median palatine suture, with a maximum length of 40mm. The X-axis was a line perpendicular to the Y-axis at the lev- el of the root center point of the most posterior second molar, with a maximum length of 80mm. All X and Y coordinates of the teeth in the anterior esthetic zone(right to left first premolars) were digitally located at the root center point of each tooth. The mean coordinates of each group were exported to mathematical software(MATLAB R2013a; Mathworks Inc., Natick, MA, USA) in order to plot and create the best-fitting curve using the following fourth-degree polynomial equation:
f(x)=ax4+bx3+cx2+dx+e
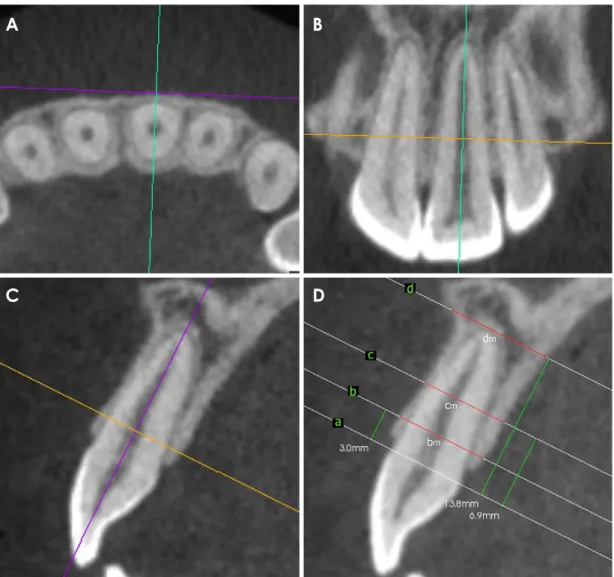
The buccolingual thickness of the alveolar bone was measured according to the report of Braut et al.(2011), with minor modifications.11 Briefly, the CBCT images were sliced at the positions of each tooth in the anterior esthetic zone. The axes were set perpendicular to the labi- al or buccal contour of the alveolar bone, passing through the center of the root canal and parallel to each root axis.
The buccolingual bone thickness measurement was per- formed in the cross-sectional view perpendicular to the long axis of the tooth at 3mm below the CEJ and at the mid-root(Fig. 2). The average alveolar bone thickness for each tooth in the anterior esthetic zone was calculated at both levels. The differences in alveolar bone thickness across the types of AA arch forms were analyzed.
Reliability test
To assure that the examiner exported results reliably, intra-examiner calibration was performed by randomly selecting image volumes from 10 subjects to measure all the variables twice. The second measurement was carried out 2 weeks afterward. Inter-examiner calibration with the results of an examiners was performed by measuring all the variables from 10 randomly selected subjects until the results of the examiners, and the expert showed no signif-
Fig. 1. Example of a maxillary alveolar arch, where a and aʹ are the root center points of central incisors. The aaʹ line is the line that links the a and aʹ points. b and bʹ are the root center points of the canines. The line that links the b and bʹ points(bbʹ line) is the intercanine width. c and cʹ are the root center points of the first premolars. The line between the c and cʹ points(ccʹ line) is the interpremolar width. am
is the midpoint of the aaʹ line. The bm point is the endpoint of the perpendicular line originating from am and extending to the bbʹ line. The ambm line is the intercanine depth. The cm point is the endpoint of the perpendicular line originating from am to the ccʹ line. The amcm line is the interpremolar depth.
icant differences.
Data analysis
Intra-examiner calibration and inter-examiner calibra- tion were evaluated through the intraclass correlation co- efficient(ICC), using a 2-way mixed model to obtain 95%
confidence intervals. The maxillary AA arch forms were classified using K-means cluster analysis and silhouette width. One-way analysis of variance(ANOVA) and the least significant difference(LSD) post hoc test were con- ducted to determine the variables that influenced the AA arch form and the differences in buccolingual alveolar
bone thickness across the arch forms. P-values<.05 were considered to indicate statistical significance. Statistical software(SPSS version 20.0; IBM Corp., Armonk, NY, USA) was used to analyze the data for intra-examiner cal- ibration, inter-examiner calibration, 1-way ANOVA, and the LSD post hoc test. K-means clustering was performed using R software(R 3.2.0, http://www.r-project.org).
Results
The samples included 113 subjects(43 males, 70 fe- males). Their ages ranged from 20 to 39 years(average
Fig. 2. A. A cone-beam computed tomographic(CBCT) image in the axial plane sliced perpendicular to the labial or buccal contour of the alveolar bone of the left central incisor. B. A CBCT image in the coronal plane sliced parallel to the root axis of the left central incisor. C.
A CBCT image in the sagittal plane sliced parallel to the root axis of the left central incisor. D. The measurement of buccolingual alveolar bone thickness: the a level is at the cementoenamel junction(CEJ) level of the left central incisor, the b level is 3mm below the CEJ, the c level is the level of the mid-root, and the d level is the level of the root apex. Alveolar buccolingual thickness was measured perpendicular to the long axis at 3mm below the CEJ(B) and at the mid-root(C). The distance bm is the buccolingual alveolar bone thickness at 3mm below the CEJ, and cm is the buccolingual alveolar bone thickness at the level of the mid-root.
A B
C D
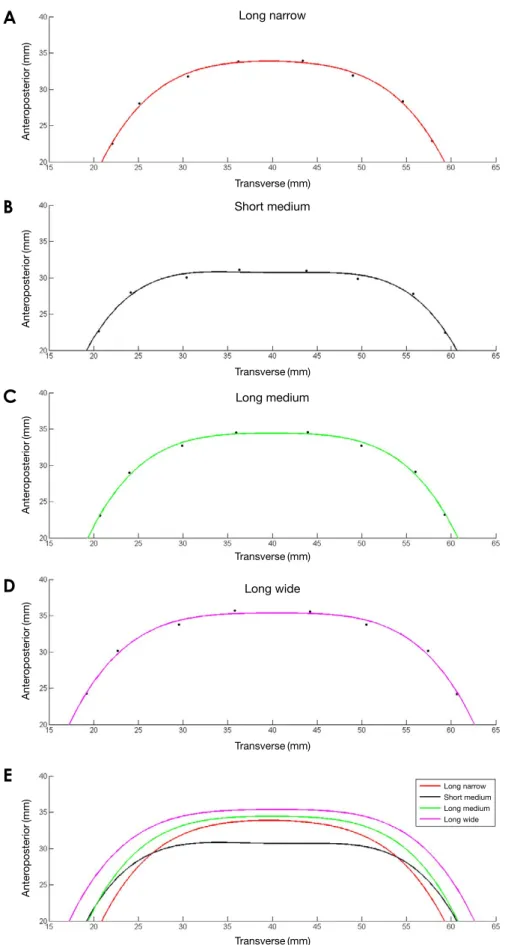
Fig. 3. The best-fit curves plotted using the mean coordinates of the subjects in each cluster. A. Long narrow arch form. B. Short medium arch form. C. Long medium arch form. D. Long wide arch form. E. Comparison of the best-fit curve among the clusters.
A
B
C
D
E
Anteroposterior(mm)
Transverse(mm) Long narrow
Short medium
Long medium
Long wide Transverse(mm)
Transverse(mm)
Transverse(mm)
Transverse(mm)
Anteroposterior(mm)Anteroposterior(mm)Anteroposterior(mm)Anteroposterior(mm)
Long narrow Short medium Long medium Long wide
age, 30.43 years). The intra-examiner and inter-examiner precision was 0.992 and 0.996, respectively. The subjects were classified into 3-10 clusters using K-means cluster analysis, and the result with 4 clusters showed the high- est values of silhouette width. In other words, a 4-cluster classification had the greatest similarity within each clus- ter and the greatest dissimilarity between clusters. The mean coordinates of the subjects in each group were fit to the curves of the fourth-degree polynomial equation(Fig.
3). The AA arch forms were given names corresponding to the depth and width of the curves, as follows: long nar- row arches, short medium arches, long medium arches, and long wide arches. The number of subjects, mean val- ues, standard deviations, and the lower and upper bounds of all the variables in each group are presented in Table 1. All 4 groups showed significant differences between groups(P values<.05). According to the LSD post hoc test, the intercanine width and interpremolar width of the long narrow arch group(29.66±1.32mm and 36.01±1.39 mm, respectively) were the narrowest transverse dimen- sions among all groups. The intercanine and interpremolar
widths of the short medium arch group(31.81±1.56mm and 38.96±1.41mm, respectively) as well as those of the long medium arch group(32.36±1.02mm and 38.75±
0.84mm, respectively) showed no significant difference and were classified as medium transverse dimensions. In contrast, the long wide arch group exhibited the widest transverse dimensions(35.01±1.26mm and 41.74±1.41 mm, respectively). The intercanine depth and interpremo- lar depth were not significantly different between the long narrow group(5.57±0.90mm and 11.16±1.38mm, re- spectively), the long medium group(5.43±1.07mm and 11.30±1.49mm, respectively) and the long wide group (5.28±0.96mm and 11.35±1.42mm, respectively);
however, these 3 long groups were significantly longer in the anteroposterior dimension than the short medium arch group(3.05±0.52mm and 8.45±1.10mm, respectively).
The intercanine width-to-depth ratio presented the largest curve in the short medium arch group(10.70±1.70), fol- lowed by the long wide arch group(6.83±1.14), the long medium arch group(6.14±1.07), and the long narrow arch group(5.45±0.85).
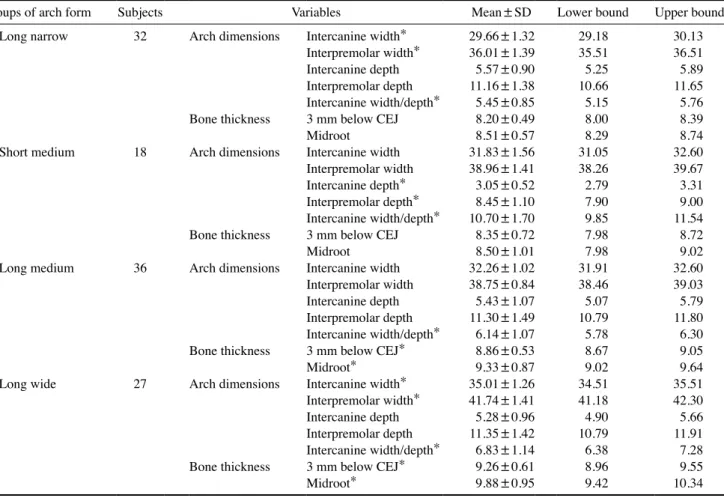
Table 1. Arch dimensions and buccolingual alveolar bone thickness according to the arch form (unit: mm)
Groups of arch form Subjects Variables Mean±SD Lower bound Upper bound
Long narrow 32 Arch dimensions Intercanine width* 29.66±1.32 29.18 30.13
Interpremolar width* 36.01±1.39 35.51 36.51
Intercanine depth 5.57±0.90 5.25 5.89
Interpremolar depth 11.16±1.38 10.66 11.65
Intercanine width/depth* 5.45±0.85 5.15 5.76
Bone thickness 3 mm below CEJ 8.20±0.49 8.00 8.39
Midroot 8.51±0.57 8.29 8.74
Short medium 18 Arch dimensions Intercanine width 31.83±1.56 31.05 32.60
Interpremolar width 38.96±1.41 38.26 39.67
Intercanine depth* 3.05±0.52 2.79 3.31
Interpremolar depth* 8.45±1.10 7.90 9.00
Intercanine width/depth* 10.70±1.70 9.85 11.54
Bone thickness 3 mm below CEJ 8.35±0.72 7.98 8.72
Midroot 8.50±1.01 7.98 9.02
Long medium 36 Arch dimensions Intercanine width 32.26±1.02 31.91 32.60
Interpremolar width 38.75±0.84 38.46 39.03
Intercanine depth 5.43±1.07 5.07 5.79
Interpremolar depth 11.30±1.49 10.79 11.80
Intercanine width/depth* 6.14±1.07 5.78 6.30
Bone thickness 3 mm below CEJ* 8.86±0.53 8.67 9.05
Midroot* 9.33±0.87 9.02 9.64
Long wide 27 Arch dimensions Intercanine width* 35.01±1.26 34.51 35.51
Interpremolar width* 41.74±1.41 41.18 42.30
Intercanine depth 5.28±0.96 4.90 5.66
Interpremolar depth 11.35±1.42 10.79 11.91
Intercanine width/depth* 6.83±1.14 6.38 7.28
Bone thickness 3 mm below CEJ* 9.26±0.61 8.96 9.55
Midroot* 9.88±0.95 9.42 10.34
*: P<0.05 (LSD post hoc test), CEJ: cemento-enamel junction, SD: standard deviation
The average buccolingual bone thickness showed sig- nificant differences among groups of AA arch forms both at 3mm below the CEJ and at the mid-root level(P<.001) (Table 1). At the level of 3mm below the CEJ, the long wide arch group had the greatest bone thickness(9.26±
0.61mm) followed by the long medium arch group(8.86±
0.53mm), the long narrow arch group(8.20±0.49mm), and the short medium arch group(8.35±0.72mm). Sim- ilar results were found at the level of the mid-root, where the long wide arch group exhibited the greatest bucco- lingual bone thickness(9.88±0.95mm), followed by the long medium arch group(9.33±0.87mm), the long nar- row arch group(8.51±0.57mm), and the short medium arch group(8.50±1.01mm).
Discussion
Many previous studies have investigated human full arch forms at the tooth level, focusing on tooth alignment in orthodontic treatment,5,7-9,24,25 whereas few have paid attention to the alveolar arches and where the reference points were situated at the bone level, which is relevant for implant dentistry.10,18,19 Most authors used plaster or 3-dimensional virtual models to evaluate arch forms; few have utilized CBCT images,18,19 and none have focused on arch form in the maxillary anterior esthetic zone. This study, therefore, is the first to report a classification of AA arch forms and to characterize the buccolingual thickness of alveolar bone in the anterior esthetic zone using CBCT imaging techniques.
The root center points at the level of the coronal third of the right and left mandibular canines were used to evalu- ate the full alveolar arch form.18,19 These were considered more advantageous than the WALA ridge points because they are located in hard tissue, which is more stable;
hence, they were chosen as reference points in our study.
Previous authors have reported that the implant platform should be located 3-4mm below the free gingival margin to provide an esthetically satisfactory outcome.26,27 Our study evaluated AA arch forms at the recommended im- plant platform level; consequently, a point 3mm apical to the CEJ of the left and right canines was used as the reference, since the gingival margin can also be located at the CEJ. Moreover, as the most apical points, the zenith points of the gingival margin of the canines were general- ly equal to those of the central incisors. The zenith points of the lateral incisors and premolars were approximate- ly 1mm coronal to those of the central incisors and ca- nines,28,29 but still within the range of appropriate implant
positions.
Recent studies have presented arch form classifications based on transverse dimensions and the arch width-to- depth ratio.8,9,25 Our study used the intercanine width and interpremolar width, which represented the transverse dimensions of the anterior and posterior parts of the ante- rior esthetic arch, respectively, and the intercanine width- to-depth ratio, which described the anterior arch shape, as the parameters for AA arch form classification. Subjects were classified into 4 significantly different groups, as shown in Table 1. These results demonstrate that the arch forms of the maxillary anterior esthetic region can be classified at the level of the implant platform.
Although AA arch forms can be classified similarly to dental arch forms, the influence of the arch dimensions might be different. In our study, the intercanine width and interpremolar width, which represented the transverse di- mensions of the anterior alveolar arch, played an import- ant role in the AA arch form. These results corresponded to those of previous studies that evaluated the full maxil- lary arch form at the dental level and reported the effects of the anterior transverse dimension on the anterior dental arch form.8,9 The anteroposterior dimensions, as well as the anterior arch shape(represented by the arch depth and intercanine width-to-depth ratio, respectively), also influ- enced the AA arch form in our study. However, a previous study showed that the anterior dental arch depth and in- tercanine width-to-depth ratio did not affect the full max- illary dental arch form,9 in contrast to our results. This discrepancy was explained by Bayome(2013), who pre- sented a strong correlation between the anterior transverse dimensions of dental and alveolar arches. Nevertheless, no significant correlation was found between the antero- posterior dimension of the anterior arch and the anterior arch shape.19 Hence, the AA arch form may be different from the anterior dental arch form because of dissimilari- ties in the anteroposterior dimensions and the shape of the anterior arch.
Previous reports have applied various mathemati- cal functions to characterize human dental arches.5-8,24 Fourth-degree polynomial equations have been exten- sively applied to create best-fitting curves of dental and alveolar arches.9,18,24 However, parabolas and a mixed model have been used to represent arch forms in the an- terior esthetic zone.24,30 The principle of the mixed model was to analyze the anterior arch and posterior arch. The midpoints of the incisal edge of the anterior teeth and ca- nine cusp tips were fitted with semi-ellipse curves, while the buccal cusp tips of the posterior teeth were fitted with
parabolic curves. Ferrario(1994) compared fourth-degree polynomial equations with the mixed model and revealed that both equations could be used to define a mathemat- ical description of dental arches.24 Since no study has examined the best-fitting curve of arch forms in the ante- rior esthetic zone at the bone level, a pilot study was per- formed to validate the best-fitting curves among parabo- las, ellipses, and fourth-degree polynomial equations(data not shown). The fourth-degree polynomial equation was selected for curve-fitting in our study because it showed the closest correlation with the actual alveolar arch form.
Four different AA arch forms were displayed after fitting the average X and Y coordinates of each arch type with the fourth-degree polynomial equation, representing the shape of the maxillary anterior arch at the implant plat- form level(Fig. 3). The names of the AA arch forms were chosen based on the arch depth and arch width. Hence, the AA arch forms could be classified as long narrow, short medium, long medium, and long wide.
Buccolingual alveolar bone thickness is an important factor for the selection of implant diameter and num- ber, and for deciding whether to perform bone contour augmentation. Moreover, the different types of AA arch forms might have distinct characteristics in terms of buc- colingual alveolar bone thickness. Thus, our study investi- gated differences of buccolingual alveolar bone thickness between AA arch forms in the anterior esthetic region. At both the implant platform level and the mid-root level, the long wide arch group presented the greatest buccolin- gual bone thickness, followed by the long medium arch group. The smallest buccolingual bone thickness was ob- served in the long narrow and short medium arch groups.
These findings imply that for clinical treatment planning, small arches both in the anteroposterior(long narrow arch form) and transverse(short medium arch form) dimen- sions contained thin alveolar bone. Thus, for these types of arch forms, clinicians should carefully consider placing reduced-diameter implants or bone contour augmentation when horizontal bone loss has occurred.
In conclusion, arch forms in the anterior esthetic zone at the level of the implant platform were classified into 4 groups: long narrow arches, short medium arches, long medium arches, and long wide arches. The buccolingual alveolar bone thickness showed significant differences among the AA arch forms.
References
1. Araújo MG, Lindhe J. Dimensional ridge alterations follow-
ing tooth extraction. An experimental study in the dog. J Clin Periodontol 2005; 32: 212-8.
2. Misch CE. Stress treatment theorem for implant dentistry. In:
Misch CE. Contemporary implant dentistry. 3rd ed. St. Louis:
Mosby; 2008. p. 68-91.
3. Misch CE. Treatment plans related to key implant positions and implant numbers. In: Misch CE. Contemporary implant dentistry. 3rd ed. St. Louis: Mosby; 2008. p. 147-59.
4. Sagat G, Yalcin S, Gultekin BA, Mijiritsky E. Influence of arch shape and implant position on stress distribution around implants supporting fixed full-arch prosthesis in edentulous maxilla. Implant Dent 2010; 19: 498-508.
5. Braun S, Hnat WP, Fender DE, Legan HL. The form of the human dental arch. Angle Orthod 1998; 68: 29-36.
6. Currier JH. A computerized geometric analysis of human den- tal arch form. Am J Orthod 1969; 56: 164-79.
7. Noroozi H, Nik TH, Saeeda R. The dental arch form revisited.
Angle Orthod 2001; 71: 386-9.
8. Lee SJ, Lee S, Lim J, Park HJ, Wheeler TT. Method to classi- fy dental arch forms. Am J Orthod Dentofacial Orthop 2011;
140: 87-96.
9. Bayome M, Han SH, Choi JH, Kim SH, Baek SH, Kim DJ, et al. New clinical classification of dental arch form using facial axis points derived from three-dimensional models. Aust Or- thod J 2011; 27: 117-24.
10. Ronay V, Miner RM, Will LA, Arai K. Mandibular arch form:
the relationship between dental and basal anatomy. Am J Or- thod Dentofacial Orthop 2008; 134: 430-8.
11. Braut V, Bornstein MM, Belser U, Buser D. Thickness of the anterior maxillary facial bone wall - a retrospective radio- graphic study using cone beam computed tomography. Int J Periodontics Restorative Dent 2011; 31: 125-31.
12. Ghassemian M, Nowzari H, Lajolo C, Verdugo F, Pirronti T, D’Addona A. The thickness of facial alveolar bone overlying healthy maxillary anterior teeth. J Periodontol 2012; 83: 187- 13. Jin SH, Park JB, Kim N, Park S, Kim KJ, Kim Y, et al. The 97.
thickness of alveolar bone at the maxillary canine and premo- lar teeth in normal occlusion. J Periodontal Implant Sci 2012;
42: 173-8.
14. Lee SL, Kim HJ, Son MK, Chung CH. Anthropometric anal- ysis of maxillary anterior buccal bone of Korean adults using cone-beam CT. J Adv Prosthodont 2010; 2: 92-6.
15. Naitoh M, Hayashi H, Tsukamoto N, Ariji E. Labial bone assessment surrounding dental implant using cone-beam com- puted tomography: an in vitro study. Clin Oral Implants Res 2012; 23: 970-4.
16. Vera C, De Kok IJ, Reinhold D, Limpiphipatanakorn P, Yap AK, Tyndall D, et al. Evaluation of buccal alveolar bone dimension of maxillary anterior and premolar teeth: a cone beam computed tomography investigation. Int J Oral Maxillo- fac Implants 2012; 27: 1514-9.
17. Januario AL, Duarte WR, Barriviera M, Mesti JC, Araujo MG, Lindhe J. Dimension of the facial bone wall in the ante- rior maxilla: a cone-beam computed tomography study. Clin Oral Implants Res 2011; 22: 1168-71.
18. Suk KE, Park JH, Bayome M, Nam YO, Sameshima GT, Kook YA. Comparison between dental and basal arch forms in
normal occlusion and Class III malocclusions utilizing cone- beam computed tomography. Korean J Orthod 2013; 43: 15- 19. Bayome M, Park JH, Han SH, Baek SH, Sameshima GT, 22.
Kook YA. Evaluation of dental and basal arch forms using cone-beam CT and 3D virtual models of normal occlusion.
Aust Orthod J 2013; 29: 43-51.
20. Buser D, Martin W, Belser UC. Optimizing esthetics for im- plant restorations in the anterior maxilla: anatomic and sur- gical considerations. Int J Oral Maxillofac Implants 2004; 19 Suppl: 43-61.
21. Grunder U, Gracis S, Capelli M. Influence of the 3-D bone- to-implant relationship on esthetics. Int J Periodontics Restor- ative Dent 2005; 25: 113-9.
22. Darby I, Chen ST, Buser D. Ridge preservation techniques for implant therapy. Int J Oral Maxillofac Implants 2009; 24 Sup- pl: 260-71.
23. von Arx T, Buser D. Horizontal ridge augmentation using autogenous block grafts and the guided bone regeneration technique with collagen membranes: a clinical study with 42 patients. Clin Oral Implants Res 2006; 17: 359-66.
24. Ferrario VF, Sforza C, Miani A Jr, Tartaglia G. Mathematical definition of the shape of dental arches in human permanent healthy dentitions. Eur J Orthod 1994; 16: 287-94.
25. Park KH, Bayome M, Park JH, Lee JW, Baek SH, Kook YA.
New classification of lingual arch form in normal occlusion using three dimensional virtual models. Korean J Orthod 2015; 45: 74-81.
26. Saadoun AP. The key to peri-implant esthetics: hard- and soft-tissue management. Dent Implantol Update 1997; 8: 41- 27. Palacci P, Nowzari H. Soft tissue enhancement around dental 6.
implants. Periodontol 2000 2008; 47: 113-32.
28. Chu SJ, Tan JH, Stappert CF, Tarnow DP. Gingival zenith po- sitions and levels of the maxillary anterior dentition. J Esthet Restor Dent 2009; 21: 113-20.
29. Duran I, Yilmaz B, Tatar N, Ural C, Guler AU. Determining the localization of premolar zenith positions according to the gingival line. Niger J Clin Pract 2015; 18: 273-5.
30. Preti G, Pera P, Bassi F. Prediction of the shape and size of the maxillary anterior arch in edentulous patients. J Oral Rehabil 1986; 13: 115-25.