Prediction of Microbial Infection of Cultured Cells Using DNA Microarray Gene-Expression Profiles of Host Responses
Infection by microorganisms may cause fatally erroneous interpretations in the biologic researches based on cell culture. The contamination by microorganism in the cell culture is quite frequent (5% to 35%). However, current approaches to identify the presence of contamination have many limitations such as high cost of time and labor, and difficulty in interpreting the result. In this paper, we propose a model to predict cell infection, using a microarray technique which gives an overview of the whole genome profile. By analysis of 62 microarray expression profiles under various experimental conditions altering cell type, source of infection and collection time, we discovered 5 marker genes, NM_005298, NM_016408, NM_014588, S76389, and NM_001853. In addition, we discovered two of these genes, S76389, and NM_001853, are involved in a Mycolplasma-specific infection process. We also suggest models to predict the source of infection, cell type or time after infection. We implemented a web based prediction tool in microarray data, named Prediction of Microbial Infection (http://www.snubi.org/software/PMI).
Key Words: Prediction Model; Microbial Infection; DNA Microarray; Mycoplasma Yu Rang Park1*, Tae Su Chung1*,
Young Joo Lee2, Yeong Wook Song3, Eun Young Lee3, Yeo Won Sohn4, Sukgil Song5, Woong Yang Park2, and Ju Han Kim1,6
1Seoul National University Biomedical Informatics (SNUBI), 2Department of Biochemistry and Molecular Biology, and 3Department of Internal Medicine, Seoul National University College of Medicine, Seoul; 4Biologics Headquater, Korea Food and Drug Administration, Seoul; 5Department of Microbiology College of Pharmacy, Chungbuk National University, Cheongju; 6Systems Biomedical Informatics National Core Research Center, Division of Biomedical Informatics, Seoul National University College of Medicine, Seoul, Korea
*Yu Rang Park and Tae Su Chung contributed equally to this work.
Received: 16 February 2012 Accepted: 27 July 2012 Address for Correspondence:
Ju Han Kim, MD
Division of Biomedical Informatics, Seoul National University College of Medicine, 103 Daehak-ro, Jongno-gu, Seoul 110-799, Korea
Tel: +82.2-740-8320, Fax: +82.2-747-4830 E-mail: [email protected]
This work was supported by Basic Science Research Program through the National Research Foundation of Korea (NRF) funded by the Ministry of Education, Science and Technology, Republic of Korea Government (No.2011-0018257), and Systems Biomedical Informatics National Core Research Center.
http://dx.doi.org/10.3346/jkms.2012.27.10.1129 • J Korean Med Sci 2012; 27: 1129-1136
INTRODUCTION
Microbial contamination of cells, including Mycoplasma infec- tion, is a frequent problem in the study of cultured cells (esti- mated frequency varying from 5% to 35%) (1). The contamina- tion of cells influences cell-growth and causes unexpected cell- reactions. It also changes a wide array of immunological, bio- chemical and biological properties of the cells without apparent change in morphology of cell. In addition Mycoplasma is highly contagious and can rapidly spread through the cell stocks. The possible consequences of Mycoplasma infection for the host- cells are many and varied, ranging from no apparent effect to extensive changes which include inhibition of cell proliferation, induction of apoptosis, induction of cytokines and oxidative rad-
icals, and malignant transformation (2-4). There is also a possi- bility that Mycoplasma biological activities may be interpreted erroneously as being of host origin (5).
Microbial contamination, however, is often difficult to detect as the contaminated culture grows well and appears normal by ordinary light microscopy. In human, the Mycoplasma may also lead to genitourinary and neonatal infections (6). In addition, Mycoplasma have been implicated in the pathogenesis of AIDS (7) and rheumatoid arthritis (8), although their precise contri- bution is still under debate. Understanding the molecular basis of a host’s response to microbial infection is essential for prevent- ing disease and tissue damage as a result of the inflammatory response. A better understanding of this process should allow for the design of drugs that can more specifically and effectively
target infected cells with reduced side-effects. The host patho- gen interaction can result in changes to the host cell which in- cludes modulation of RNA expression, target receptor induc- tion, actin cytoskeletal rearrangements, signal transduction pathway activation, and vacuolar trafficking (3, 9).
DNA microarray technology has enabled us to describe a unique biological phenomenon in terms of genome-wide gene expression analysis (10). It can provide a detailed insight into observed phenomenon as well as complete list of the genes in- volved. Gene expression profiling using DNA microarray offers the potential to define patterns of gene expression during nor- mal biological or aberrant disease processes. Moreover, many of differentially expressed genes that may play an integral role in these processes can be identified.
In this paper, we have utilized spotted oligonucleotide micro- array methodology to examine the expression of 10,416 known regulatory genes following microbial infection. We compared the distribution of patterns of gene expression in keratinocytes and chondrocytes. We also compared gene expression patterns at day 1, day 3, and day 10 post-infection. We selected 30 genes that were expressed differentially in whole experimental sam- ples, as biomarkers for microbial infection. The model for the prediction of cell infection is also discussed.
MATERIALS AND METHODS Cell culture and experimental design
Human keratinocytes and chondrocytes were cultured and in- fected with 8 types of Mycoplasma (M. hyorhinis, M. orale, M.
arthritidis, M. bovis, M. pirum, M. pulminis, M. salivarium, M.
neurolyticumv), fungus (Candida albicans), bacteria (Staphylo- coccus aureus) or Adenovirus. Cells were collected after 1 day, 3 days and 10 days depending on the source of infection. For C.
albicans cells were collected after 1 day, for S. aureus and ade- novirus cells were collected after 3 days, and for Mycoplasma keratinocytes were collected after 3 days or 10 days. In total 62
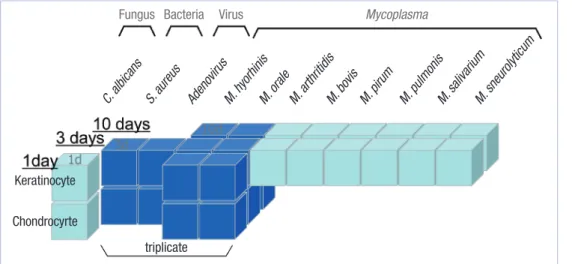
samples were analyzed; 37 samples of keratinocytes and 25 sam- ples of chondrocytes. RNA from these infected cells was marked with Cy5 and the RNA from uninfected cells was marked with Cy3. Fig. 1 shows experimental design of our study in 3 dimen- sional structures. The x axis means source of infection (12 dif- ferent types of source of infection), y axis means cell types (ke- ratinocyte or chondrocyte) and z axis means day of culture (1 day, 3 days or 10 days). The color of cube means a biological repetition. The dark blue means the triplicate sample. The light blue means that there is no biological repetition.
RNA extraction and oligonucleotide microarray
Total RNA from control or microbial-infected cells was used for experiments done in triplicate. Experiments were performed using the microarray system (Oligo-Human 10K, Macrogen Inc., Seoul, Korea) according to the manufacturer’s protocol. Briefly, 100 μg of total RNA was labelled by incubation with Cyanine-3- dUTP (6.0 mM) or Cyanine-5-dUTP (4.0 mM) (Perkin Elmer Life Sciences, Waltham, MA, USA), dNTP mixture, 0.1 M DTT, RnaseOUT, inorganic pyrophosphatase and reverse transcrip- tase at 40°C for 3 hr. Before hybridization 8 μg of Cyanine-3-CTP labelled cRNA and 8 μg of Cyanine-5-CTP labelled cRNA were mixed with 2.5 μL of Mouse Cot-1 DNA (Invitrogen, Carlsbad, CA, USA), 2.5 μL of Deposition control target (Operon Technol- ogies, Alameda, CA, USA) and 12.5 μL of 2 × hybridization buf- fer (Agilent Technologies, Santa Clara, CA, USA). Cy3 and Cy5 fluorescent intensity was determined using the GenePix scan- ner (Axon Instruments, Union City, CA, USA) and images were analyzed using the built-in software to calculate relative ratios and to determine confidence intervals.
Microarray data analysis and marker genes identification Fluorescence intensity was processed and measured using Ge- nePix Pro software (Axon Instruments) and intensity data were imported to the Xperanto in-house microarray database (11).
Variance stabilizing normalization (12) was applied using the
Fig. 1. The microarray experimental design in three dimensional spaces according to source of infection (x axis), cell type (y axis) and day of cul- ture (z axis).
triplicate
Fungus Bacteria Virus Mycoplasma
Chondrocyrte Keratinocyte
C. albicans S. aureus
Adenovirus M. hyorhinis
M. orale M. arthritidis
M. bovis M. pirum
M. pulmonis M. salivarium
M. sneurolyticum
‘vsn’ package in Bioconductor with the R statistical package.
After performing intensity-dependent global LOWESS regres- sion, spatial and intensity dependent effects were managed by pin-group LOWESS normalization using the method of Yang et al. (13).
Each sample represents a specific condition of infection (see Fig. 1) taking into account of infected cell type, source of infec- tion and collection time after infection. We can regard the dif- ferentially expressed genes for a given sample as a response to the specific conditions of infection. We used the log-odds value for each gene (14) to identify differentially expressed genes for each sample (single chip). In order to select a gene list for com- bined samples, we use an average of log-odds values in each sample and the number 1.0 as a threshold value to define dif- ferentially expressed genes. Contrary to simple and widely-used 2-fold method, Newton’s method relies on the average intensity of the varying critical zone which takes into consideration the uncertainty of small-intensity areas. From the definition of log- odds value (14), almost all genes have negative log-odds values and genes with high values have high probabilities of being dif- ferentially expressed. An infection score function L(g) for a gene g, is defined as the average of log-odds values under a given set of samples. This generates the equation
where log-odds(g, s) is the log-odds value for a gene g under the sample s, and s1,…,sK represent all samples within our ex- perimental design or a subset of samples which are of particu- lar interest. The score L(g) of a gene g represents the degree to which the gene g is associated with the general process of infec- tion with respect to the samples s1,…,sK.
The top ranking genes g1, …, gn were selected using the Score L(g) that defined them as possible marker genes for microbial infection. Using the marker genes g1, …, gn, we defined the mi- crobial contamination index (MCI) for a given sample (details are in supplement pages). To determine optimal number of marker genes (n) we performed a leave-one-out cross-valida- tion method and obtained cross-validation score, named cross-
validation (CV). The high score of CV means that the marker genes are consistent to predict microbial infection. Based on the CV score, we select the number of genes which has highest CV score. Statistical analyses were done using R/Bioconductor package. Using this MCI and CV score, we also select group of marker genes to predict source of infection, cell type and infec- tion time.
RESULTS
Overall distribution of differentially expressed genes with regard to the conditions of cell-infection
We examined the gene expression profiles of microbial-infect- ed cells using Oligo-Human 10K chips. In order to select differ- entially expressed genes, we use the log-odds values of each sample. Table 1 shows an overall distribution of differentially expressed genes following infection by Mycoplasma, Fungus, Bacteria and Virus. Up-regulated and down-regulated genes were numbered separately and samples were divided accord- ing to cell type.
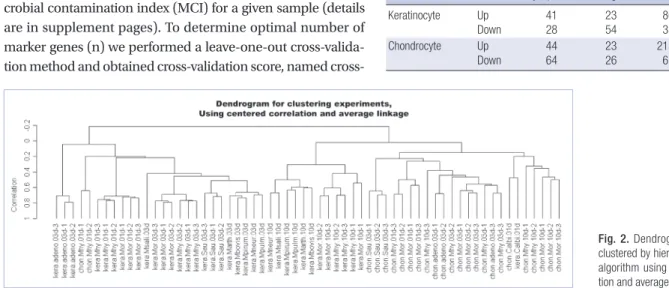
Fig. 2 shows a dendrogram of samples clustered using the Hierarchical clustering algorithm with centered-correlation and the average linkage method. From over 10,000 candidate genes, the 2,465 genes were selected for clustering which had no con- stant expression pattern with respect to the samples. Statistics V(g), were calculated for each gene g, defined by the variance of expression of gene g over a median of all variance of gene ex- pressions. A total of 2,465 genes satisfying a V(g) chi-square val- ue of P < 0.001 were selected.
All of the replicated samples had a strong correlation with in- fection and hence the reliability of experiment could be consid-
Table 1. Up or down regulated genes according to sources of infection and cultured cells
Cell type Up/Down Source of infection
Mycoplasma Fungus Bacteria Virus Keratinocyte Up
Down 41
28 23
54 86
33 98
9 Chondrocyte Up
Down
44 64
23 26
215 61
24 41
Fig. 2. Dendrogram for samples clustered by hierarchical clustering algorithm using centered correla- tion and average linkage.
K
L(g) = 1
∑
log-odds(g,sj) K j = 1ered sufficiently high. We also discovered that differential gene expression patterns exist depending on the cell types assayed and that the tree could be divided into two sub-trees for kerati- nocytes and chondrocytes. With regard to the time point of the type of the assay post infection, we can conclude that the gene expression pattern was similar regardless of the type of infection.
Selection of marker genes for microbial infection
In this section we have elucidated the genes associated with a general microbial infection process and suggest a model to pre- dict whether a sample is infected or not. According to our pre-
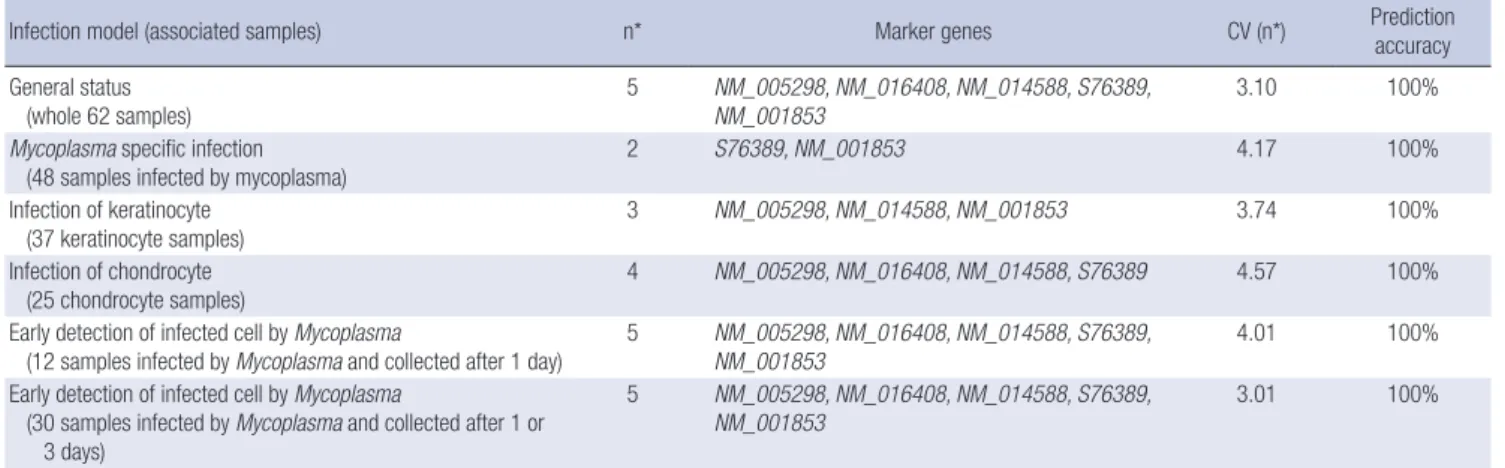
diction model associated with whole samples, the marker genes for cell infection are NM_005298, NM_016408, NM_014588, S76389, and NM_001853 (See Tables 2 and 3). Also, the cross- validation score of CV(n*) = 3.01 > 1.0 confirmed that the mark- er genes were correct. Fig. 3 shows the CV score according to the number of marker genes for detecting microbial infection (A) and Mycoplasma specific infection (B). We selected the num- ber of genes which has highest CV score.
We also built a model to determine whether the origin of in- fection was a species of Mycoplasma. We let Lmyco(g) and Lnon- myco(g) be the infection scores associated with 48 Mycoplasma
Table 2. Marker genes and their prediction accuracy in various infection models
Infection model (associated samples) n* Marker genes CV (n*) Prediction
accuracy General status
(whole 62 samples) 5 NM_005298, NM_016408, NM_014588, S76389,
NM_001853 3.10 100%
Mycoplasma specific infection (48 samples infected by mycoplasma)
2 S76389, NM_001853 4.17 100%
Infection of keratinocyte
(37 keratinocyte samples) 3 NM_005298, NM_014588, NM_001853 3.74 100%
Infection of chondrocyte
(25 chondrocyte samples) 4 NM_005298, NM_016408, NM_014588, S76389 4.57 100%
Early detection of infected cell by Mycoplasma
(12 samples infected by Mycoplasma and collected after 1 day)
5 NM_005298, NM_016408, NM_014588, S76389, NM_001853
4.01 100%
Early detection of infected cell by Mycoplasma
(30 samples infected by Mycoplasma and collected after 1 or 3 days)
5 NM_005298, NM_016408, NM_014588, S76389,
NM_001853 3.01 100%
Table 3. List of marker genes of microbial infection
Genes Gene symbol Gene name Model*
NM_005298 GPR25 G protein-coupled receptor 25 K C – E
NM_016408 CDK5RAP1 CDK5 regulatory subunit associated protein 1 – C – E
NM_014588 VSX1 Visual system homeobox 1 homolog, CHX10-like (zebrafish) K C – E
S76389 pml-rarafusion (junction sequence der 15) – C M E
NM_001853 COL9A3 Collagen, type IX, alpha 3 K – M E
The above 5 genes are extracted by our prediction model with whole samples. *The genes marked by “K” are extracted by model with keratinocyte-samples; “C” for chondro- cyte-samples, “M” for Mycoplasma-specific model and “E” for early-collected samples.
Fig. 3. Determining the optimal number of marker genes for microbial infection (A) or Mycoplasma-specific infection (B). The cross-validation score CV(n) for a positive integer represents the prediction power when we select n genes as marker genes.
CV score CV score
The number of marker genes for detecting microbial infection
The number of marker genes for detecting Mycoplasma specfic infection
5 10 15 20 25 5 10 15 20 25
4
3
2
1
0
4
3
2
1
0
A B
infection samples and 14 non-Mycoplsma infection samples respectively. With a newly defined infection score L(g) = Lmyco(g)- Lnon-myco(g), we found two marker genes S76389 and NM_001853 by applying the cross-validation model. Three marker genes (NM_005298, NM_014588, NM_001853) and four marker genes (NM_005298, NM_016408, NM_014588, S76389) were selected to build prediction model for detecting keratinocyte or chon- drocyte cell type, respectively. We also build prediction model for an early infected cell using following five marker genes; NM_
005298, NM_016408, NM_014588, S76389, and NM_001853.
Table 2 shows the marker genes depending on each prediction model. Table 3 shows the gene name, symbol and overlap of cell type specific, time specific and mycoplasma specific mark- er genes.
Classifications for sample groups
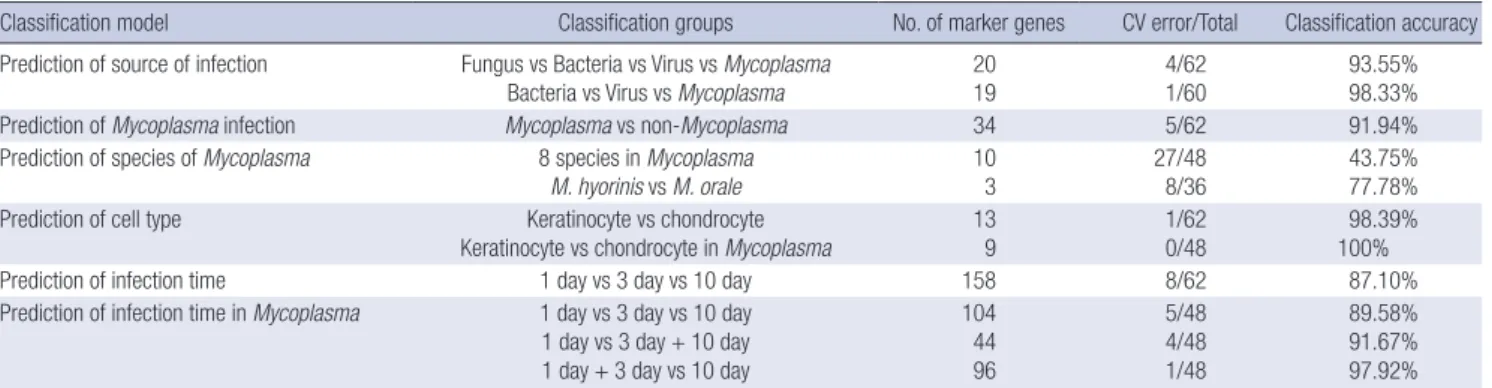
If a sample s is contaminated by certain source infection, it can be classified using PAM (Prediction Analysis for Microarrays) which is a class prediction program for data mining that finds genes and classifies them with prediction error using a cross- validation method. Table 4 shows the results of the detection of 4 sources of infection with 20 genes designated as classifier with a classification accuracy of 93.55%. Since the data on fungus was poor, we tried to classify 3 sources infection excluding fungus.
This gave a better result showing 19 genes with a classification accuracy of 98.33%. These 19 genes were included in the 20 genes detected using 4 sources of infection. For classification of Myco- plasma and non-Mycoplasma we detected 34 classifier genes with a classification accuracy of 91.94%. We easily conclude that the source of infection may cause different patterns of gene ex- pressions.
For classifying the species of Mycoplasma we obtained poor classification results. Table 4 shows that the prediction accuracy was 43.75% when classifying the 8 species of Mycoplasma, and 77.78% when classifying two species, M. hyorinis and M. orale, which are a common source of infection. Therefore the similar- ities between infections by different species of Mycoplasma are more pronounced than the differences between them.
Finally, for classifying the infection time of Mycoplasma, four
classification models were built. The classification result was shown in last 4 rows of Table 4. Classification of groups of early- collected samples using two time points (1 day or 3 day) and late-collected samples (3 day or 10 day) gave better results than when classifying groups using 3 time points (1, 3, and 10 day).
Implementation of prediction of the microbial infection We implemented a web based tool, named Prediction of Micro- bial Infection (PMI) to predict microbial infection in microarray data using MCI which we defined in this study (http://www.
snubi.org/software/PMI). Input to PMI is a common tab-delim- ited text file of log-odds value of gene-expression. The first row must contain column heading (i.e., Index, Reporter_ID, condi- tion 1, condition 2 …). The first column contains index of probe in array. The second column must contain either Entrez Gene ID, GenBank accession number, or an official gene symbol. The third to i-th columns contain log-odds value of gene expression levels across experimental conditions. PMI calculates Jaccard similarity coefficient as a prediction score of microbial infection between 5 marker genes (NM_005298, NM_016408, NM_014588, S76389, and NM_001853) and candidate marker genes calcu- lated from user’s input gene expression file by MCI.
DISCUSSION
In conclusion, we suggest a group of genes that are believed to be strongly implicated in the microbial infection of human ke- ratinocytes and chondrocytes. We also suggest a model to pre- dict whether a given sample is infected by the microbial con- tamination. This is a powerful model for the prediction of cell contamination, and is suitable for application to data consisting of gene expression profiles following infection under various experimental conditions. To obtain stronger prediction power for the non-contamination of a sample, structural experimental profiling data for host response to infection by a wide source of pathogens is required. To the best of our knowledge, this is first study to detect microbial contamination using gene expression profiles of host responses. This eliminates the need for addi- tional microarray experiment to distinguish microbial contami- Table 4. Prediction accuracies in various classification models
Classification model Classification groups No. of marker genes CV error/Total Classification accuracy
Prediction of source of infection Fungus vs Bacteria vs Virus vs Mycoplasma
Bacteria vs Virus vs Mycoplasma 20
19 4/62
1/60 93.55%
98.33%
Prediction of Mycoplasma infection Mycoplasma vs non-Mycoplasma 34 5/62 91.94%
Prediction of species of Mycoplasma 8 species in Mycoplasma
M. hyorinis vs M. orale 10
3 27/48
8/36 43.75%
77.78%
Prediction of cell type Keratinocyte vs chondrocyte
Keratinocyte vs chondrocyte in Mycoplasma
13 9
1/62 0/48
98.39%
100%
Prediction of infection time 1 day vs 3 day vs 10 day 158 8/62 87.10%
Prediction of infection time in Mycoplasma 1 day vs 3 day vs 10 day 1 day vs 3 day + 10 day 1 day + 3 day vs 10 day
104 44 96
5/48 4/48 1/48
89.58%
91.67%
97.92%
nation.
Previously, there are two basic testing methods for Mycoplas- ma contamination; direct culture in media, or indirect tests that measure specific characteristics of Mycoplasma. Direct culture is the most effective and a sensitive method for detecting Myco- plasma, but it is also the most difficult and time consuming (re- quiring up to 28 days). While DNA fluorochrome staining is an easy and relatively fast indirect procedures to perform (requiring up to 4 to 5 days), however it also has several limitations such as high cost, some equivocal staining results to interpret, and man- datory use of suitable positive and negative control slides (15).
In the present study, we examined the gene expression pro- files of microbial infected cells to select marker genes that could identify microbial infection on sample cell. The five genes se- lected as marker genes by MCI could predict whether biologi- cal sample is infected or not by the microbial contamination.
We also selected three and four marker genes to predict kerati- nocyte and chondrocyte cell type, respectively. But these three or four marker genes are included in the set of marker genes found in the model for whole samples, so we can conclude that our prediction model is robust for these types of cells, and also we can apply the general prediction model instead of cell type specific model without loss of prediction power.
The previous methods used to detect cell infection work poor- ly during the early stages of infection. Our microarray based pre- diction model can be used to detect infection in the early stages without the need for additional process or a loss of prediction power. Table 2 shows that the set of marker genes for early-col- lected samples coincide with the set of marker genes for whole samples thus substantiating our prediction model.
As previously mentioned, this is the first study to detect mi- crobial contamination using gene expression profiles of host response. The five marker genes (NM_005298, NM_016408, NM_014588, S76389, and NM_001853), which were selected in this study, are novel genes to distinguish microbial contamina- tion in microarray data. For understating biological mechanisms of these genes, we examined literature search. Among the five genes, three genes (NM_016408, NM_001853, and NM_014588) are related to the cell differentiation and cell cycle process (16- 18). Especially NM_016408 is one of the marker genes of human cell cycle PCA array, which distinguishes between G2 phase and G2/M transition. These results indicated that the microbial infection affects cell cycle process of host cell.
Efforts in functional genomics related to cancer research have yielded major successes in the pursuit of gene expression sig- natures. Approaches to gene expression analysis such as time- series analysis, pattern discovery, clustering, and class predic- tion, have recently been reviewed (19). Expression-based crite- ria and class predictors have been defined by neighborhood joining analysis (20), a method based on a subset of genes whose expression strongly correlates with specific classes, as well as
Bayesian regression models (21) and artificial neural networks (22). These predictors were successfully used to classify novel samples in a manner consistent with clinical assessments. Clas- sifications based on gene expression alone or class discovery have also been demonstrated and suggest that gene expression profiling has the capacity to identify subtypes that have not been previously defined (20). Although these results are promising, it should be noted that many of the previously conducted cancer line gene expression profiles are one dimensional. In contrast, a host expression profile evoked by pathogen exposure would be expected to be temporal and may also exhibit dose depen- dence. Comprehensive sets of gene expression profiles that ex- plore temporal and dose ranges for pathogen exposure must be produced to map the continuum of gene expression changes.
REFERENCES
1. Darin N, Kadhom N, Briere JJ, Chretien D, Bebear CM, Rotig A, Munnich A, Rustin P. Mitochondrial activities in human cultured skin fibroblasts contaminated by Mycoplasma hyorhinis. BMC Biochem 2003; 4: 15.
2. Browning GF, Marenda MS, Noormohammadi AH, Markham PF. The central role of lipoproteins in the pathogenesis of mycoplasmoses. Vet Microbiol 2011; 153: 44-50.
3. Rottem S. Interaction of mycoplasmas with host cells. Physiol Rev 2003;
83: 417-32.
4. Cimolai N. Do mycoplasmas cause human cancer? Can J Microbiol 2001; 47: 691-7.
5. Choi JW, Haigh WG, Lee SP. Caveat: mycoplasma arginine deiminase masquerading as nitric oxide synthase in cell cultures. Biochim Biophys Acta 1998; 1404: 314-20.
6. Blanchard A, Bébéar CM. Mycoplasmas of humans. In: Shmuel R and Richard H, editor, Molecular biology and pathogenicity of mycoplasmas.
New York, NY: Springer, 2002, p45-71.
7. Uuskula A, Kohl PK. Genital mycoplasmas, including Mycoplasma gen- italium, as sexually transmitted agents. Int J STD AIDS 2002; 13: 79-85.
8. Gilroy CB, Keat A, Taylor-Robinson D. The prevalence of Mycoplasma fermentans in patients with inflammatory arthritides. Rheumatology (Oxford) 2001; 40: 1355-8.
9. Citti C, Nouvel LX, Baranowski E. Phase and antigenic variation in my- coplasmas. Future Microbiol 2010; 5: 1073-85.
10. Mandruzzato S. Technological platforms for microarray gene expression profiling. Adv Exp Med Biol 2007; 593: 12-8.
11. Park JY, Park YR, Park CH, Kim JH, Kim JH. Xperanto: a web-based inte- grated system for DNA microarray data management and analysis. Ge- nomics and Informatics 2005; 3: 39-42.
12. Huber W, von Heydebreck A, Sultmann H, Poustka A, Vingron M. Vari- ance stabilization applied to microarray data calibration and to the quantification of differential expression. Bioinformatics 2002; 18 Suppl 1:
S96-104.
13. Yang YH, Dudoit S, Luu P, Lin DM, Peng V, Ngai J, Speed TP. Normaliza- tion for cDNA microarray data: a robust composite method addressing single and multiple slide systematic variation. Nucleic Acids Res 2002;
30: e15.
14. Newton MA, Kendziorski CM, Richmond CS, Blattner FR, Tsui KW.
On differential variability of expression ratios: improving statistical in- ference about gene expression changes from microarray data. J Comput Biol 2001; 8: 37-52.
15. Stacey GN. Cell culture contamination. Methods Mol Biol 2011; 731:
79-91.
16. Padua MB, Hansen PJ. Changes in expression of cell-cycle-related genes in PC-3 prostate cancer cells caused by ovine uterine serpin. J Cell Bio- chem 2009; 107: 1182-8.
17. Shi Z, Jervis D, Nickerson PE, Chow RL. Requirement for the paired-like homeodomain transcription factor VSX1 in type 3a mouse retinal bipo- lar cell terminal differentiation. J Comp Neurol 2012; 520: 117-29.
18. Mizukami T, Kanai Y, Fujisawa M, Kanai-Azuma M, Kurohmaru M, Hayashi Y. Five azacytidine, a DNA methyltransferase inhibitor, specifi- cally inhibits testicular cord formation and Sertoli cell differentiation in
vitro. Mol Reprod Dev 2008; 75: 1002-10.
19. Reis-Filho JS, Pusztai L. Gene expression profiling in breast cancer: clas- sification, prognostication, and prediction. Lancet 2011; 378: 1812-23.
20. Li Z, Zhang W, Wu M, Zhu S, Gao C, Sun L, Zhang R, Qiao N, Xue H, Hu Y, et al. Gene expression-based classification and regulatory networks of pediatric acute lymphoblastic leukemia. Blood 2009; 114: 4486-93.
21. Bhattacharjee M, Sillanpaa MJ. A bayesian mixed regression based pre- diction of quantitative traits from molecular marker and gene expres- sion data. PLoS One 2011; 6: e26959.
22. van den Akker EB, Verbruggen B, Heijmans BT, Beekman M, Kok JN, Slagboom PE, Reinders MJ. Integrating protein-protein interaction net- works with gene-gene co-expression networks improves gene signatures for classifying breast cancer metastasis. J Integr Bioinform 2011; 8: 188.
■
Supplement
■
m + 3s was