The Corpus Callosum Area and Brain Volume in Alzheimer’s Disease, Mild Cognitive Impairment
and Healthy Controls
1Hee Seok Choi, M.D.1,2, Hyung Suk Seo, M.D.3, Kwang Ki Kim, M.D.4, Yup Yoon, M.D.1
1Department of Radiology, Dongguk University International Hospital, Goyang-si, Gyeonggi-do, Korea.
2Department of Radiology, Seoul National University Bundang Hospital, Seong Nam-si, Gyeongido, Korea.
3Department of Radiology, Korea University Ansan Hospital, Ansan-si, Gyunggi-do, Korea.
4Department of Neurology, Dongguk University International Hospital, Goyang-si, Gyeonggi-do, Korea.
Received February 6, 2009 ; Accepted February 23, 2009
Address reprint requests to : Hyung Suk Seo, M.D., Department of Radiology, Korea University Ansan Hospital, 516 Gojan-dong, Danwon-gu, Ansan-si, Gyunggi-do, 425-707, Korea.
Tel. 82-31-412-5247 Fax. 82-31-961-8281 E-mail: [email protected]
Purpose: To compare the corpus callosum (CC) area and brain volume among individ- uals with Alzheimer’s disease (AD), mild cognitive impairment (MCI) and healthy con- trols (HC).
Materials and Methods: To evaluate the relationship of CC area and brain volume in 111 subjects (M:F = 48:63; mean age, 56.9 years) without memory disturbance and 28 subjects (11:17; 66.7years) with memory disturbance. The 11 AD (3:8; 75.7 years), 17 MCI (8:9; 60.9 years) and 28 selected HC (11:17; 66.4 years) patients were investigated for comparison of their CC area and brain volume.
Results: A good positive linear correlation was found between CC area and brain vol- ume in subjects without and with memory disturbance (r = 0.64 and 0.66, respective- ly, p < 0.01). The CC area and brain volume in AD patients (498.7 ± 72 mm2, 715.4 ± 107 cm3) were significantly smaller than in MCI patients (595.9 ± 108, 844.1 ± 85) and the HCs (563.2 ± 75, 818.9 ± 109) (p < 0.05). The CC area and brain volume were not significantly different between MCI patients and the HCs.
Conclusion: The CC area was significantly correlated with brain volume. Both CC area and brain volume were significantly smaller in the AD patients.
Index words :Alzheimer’s disease Cognition disorders Corpus callosum
Magnetic resonance (MR) Brain
Alzheimer’s disease (AD) is a progressive, neurode- generative disorder associated with cognitive impair- ment and memory dysfunction, which is severe enough to interfere with the activities of daily living (1, 2).
Moreover, Alzheimer’s disease is the most common cause of dementia in all age groups (3). With increasing life expectancy worldwide, the number of elderly peo- ple at risk for developing dementia and AD is growing rapidly. Accordingly, the worldwide cost of caring for patients with dementia in 2005 was estimated to be
$315.4 billion USD on the basis of a population 29.3 mil- lion persons with dementia (4). The early detection and intervention in persons with mild memory symptoms who are at risk for progressing to AD is becoming more important (3).
Mild cognitive impairment (MCI) is a disorder that in- cludes mild memory impairment. Patients with MCI do
not meet the criteria for dementia and have otherwise normal cognition and the ability to function indepen- dently in their daily activities (5, 6). MCI is thought to be a transitional stage between normal aging and dementia.
The early diagnosis of patients with MCI is important because treatment of MCI may be effective in delaying the progression to AD (7).
MR imaging is now recognized as an important tool for the diagnosis of AD and the monitoring of the pro- gression of AD (8). The accumulation of β-amyloid plaques and neurofibrillary tangles in the neocortex of the AD brain produces diffuse brain atrophy, gross widening of the sulci, and enlarged ventricles. These symptoms represent the major MR findings of AD (9).
However, it is hard to differentiate the brain atrophy in AD from normal aging because all contiguous sections of the brain MR images must be considered.
A
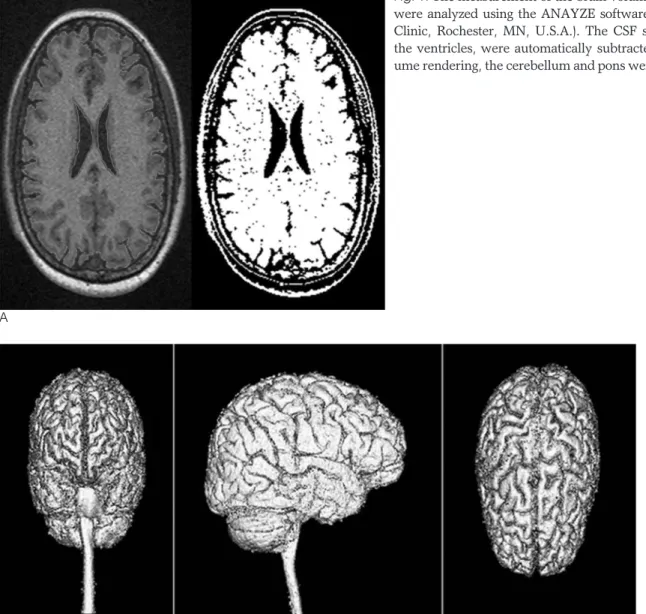
Fig. 1. The measurement of the brain volume. The MR scans were analyzed using the ANAYZE software package (Mayo Clinic, Rochester, MN, U.S.A.). The CSF spaces, including the ventricles, were automatically subtracted (A). With vol- ume rendering, the cerebellum and pons were subtracted (B).
B
Disproportionate atrophy of the amygdale (10), hip- pocampus (10), entorhinal cortex (11), and substantia in- nominata (12) has been proposed as hallmarks of AD.
However, tracing these brain structures is difficult in a clinical setting. In addition, inter-observer variation in the assessment of these brain structures on MR images makes the interpretation of the findings subjective.
The corpus callosum (CC) is a major inter-hemispheric commissure connecting the right and left cerebral hemi- spheres (13, 14). Several reports have shown a positive relationship between the CC and brain volume in healthy and young populations (15-17). The measure- ment of the CC area is relatively easy and reproducible.
There have been several studies reporting on the atro- phy of the CC in patients with AD (18, 19). However, there is little knowledge on the change of the CC in pa- tients with MCI.
The purpose of this study was to investigate the rela- tionship between the CC area and brain volume in pa- tients with memory impairment as well as in a large healthy population with a wide age range and to com- pare the CC area and brain volume among patients with AD and MCI, as well as in healthy controls (HC).
Materials and Methods
Study population
From March 2006 to October 2007, 183 consecutive patients presented at our hospital with memory distur- bance. All patients were evaluated by the MMSE (mini- mental status examination) and CDR (clinical dementia rating). The MMSE is a brief 30-point questionnaire test
that is used to assess cognition. The CDR is a numeric scale used to quantify the severity of symptoms of de- mentia with scores ranging from 0 through 3.5 A MMSE score below 25 and a CDR score of 1 or 2 were consid- ered to indicate AD. A MMSE score of 25 to 30 and a CDR score of 0.5 of CDR were considered to indicate MCI. Patients with structural abnormalities on MR imaging that could have affected the brain volume were excluded from the study. In addition, patients with cere- bral lesions associated with previous trauma, surgery, an ischemic infarction larger than the lacunar size, or hemorrhage, were excluded from the study.
From March, 2007 to September, 2007, 111 consecu- tive subjects (48 men and 63 women; mean age, 56.9 years; age range, 34-81 years) without memory distur- bance and who visited the neurology department at our hospital were examined via a brain MRI, were included in this retrospective study to evaluate the relationship of the CC area with brain volume. Their chief complaints included headache (n=60), dizziness (n=20), facial palsy (n=12), peripheral neuropathy (n=10), syncope (n=6), and essential tremor (n=1). To compare the CC area and brain volume among the patients with AD and MCI, age and sex matched HCs without memory disturbance were selected from the 111 HCs.
MRI Acquisition
The MR imaging of the brain was performed with a 1.5T MR scanner (Avanto; Siemens Medical, Erlangen, Germany). Sagittal T1-weighted spoiled gradient-re- called acquisition (SPGR) in the steady state MR imag- ing (TR/TE = 1100/4 msec; matrix size = 320×320;
FOV = 240 × 240 or 220 × 220 mm; slice thickness = 1.0 mm with no gap between slices), was performed. In addition, axial T1-weighted images (TR/TE, 476/10; field of view, 167 × 220 mm; matrix size, 256 × 224; slice thickness, 5 mm), axial FLAIR images (9,000/121; FOV, 167 × 220 mm; matrix size, 320 × 196; slice thickness, 5 mm), and axial T2-weighted images (4,270/97; FOV, 167 × 220 mm; matrix size 512 × 269; slice thickness, 5 mm) were obtained.
MRI Analysis
The MR scans were transferred to an independent Windows workstation and analyzed using the ANAYZE software package (Mayo Clinic, Rochester, MN, U.S.A.).
An experienced neuroradiologist, blinded to the clinical data, retrospectively reviewed all of the MR images.
Conventional MR images were used to detect structural Fig. 2. The measurement of the corpus callosum area. On the
midsagittal slice, the outer boundary of the corpus callosum was manually traced based on the outline of the regions of in- terest (ROI).
abnormalities that would exclude a patient from the study. The brain volume was obtained by automated subtraction of the CSF spaces (Fig. 1, 2). The ventricular CSF spaces were also subtracted. With volume render- ing, the cerebellum and brainstem were removed. The CC area was measured manually at the midsagittal slice using the regions of interest (ROI) (Fig. 3). The midsagit- tal slice was defined as the slice where the cerebral aqueduct was the most prominent and only the vermis of the cerebellum (no hemispheres) was in view.
Statistical Analysis
The statistical analyses were performed using SPSS 12.0 (SPSS Inc., Chicago, IL, U.S.A.). A linear regression analysis was carried out to evaluate the relationship be- tween the CC area and brain volume. The statistical re- lationship between the CC area and brain volume was evaluated in 111 subjects without memory disturbance
and 28 patients with memory disturbance (total n=139 subjects). The CC area and brain volume among pa- tients with AD and MCI, as well as the HCs were com- pared using a one-way analysis of variance (ANOVA). P- values less than 0.05 were considered to be statistically significant.
Results
Clinical characteristics and Demographics
Among the 183 patients with memory disturbance, 11 (3 men and 8 women; mean age 75.7 years; age range 67-80 years) were diagnosed with AD and 17 (8 men and 9 women; mean age 60.9 years; age range 44-79 years) were diagnosed with MCI. Twenty eight age- and sex-matched HCs (11 men and 17 women; mean age 66.4 years; age range 44-81 years) were selected among the 111 subjects without memory disturbance.
A B
C
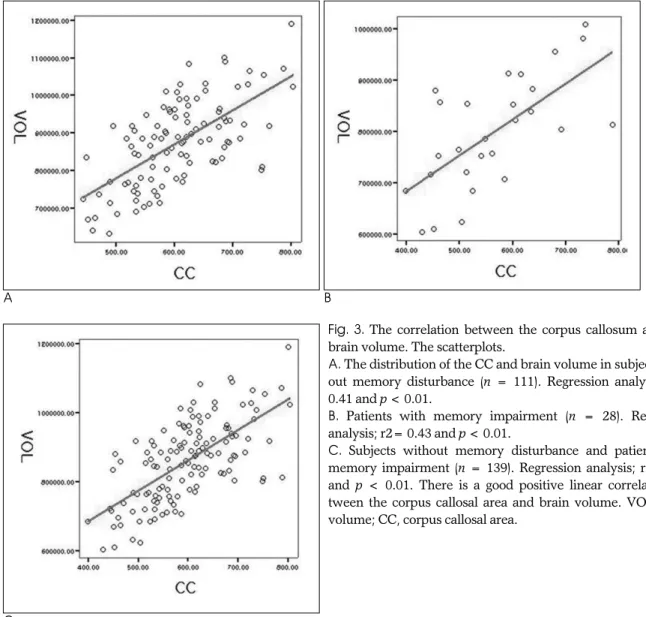
Fig. 3. The correlation between the corpus callosum area and brain volume. The scatterplots.
A. The distribution of the CC and brain volume in subjects with- out memory disturbance (n = 111). Regression analysis; r2=
0.41 and p < 0.01.
B. Patients with memory impairment (n = 28). Regression analysis; r2= 0.43 and p < 0.01.
C. Subjects without memory disturbance and patients with memory impairment (n = 139). Regression analysis; r2= 0.44 and p < 0.01. There is a good positive linear correlation be- tween the corpus callosal area and brain volume. VOL, brain volume; CC, corpus callosal area.
The general patient information is shown in Table 1.
The mean scores of the MMSE were 17.5 ± 5.5 and 27.8 ± 1.4 in patients with AD and MCI, respectively.
The mean scores of the CDR were 1.5 ± 1.5 and 0.5 in the patients with AD and MCI, respectively. The MMSE and CDR were not evaluated in the 111 subjects without memory disturbance (M/F = 48/63; mean age 56.9 ± 12.3 years) and the 28 selected HCs (M/F = 11/17; mean age 66.4 ± 11.6 years).
The relationship between the CC area and brain volume The regression analysis of the CC area and brain vol- ume showed a good positive linear correlation for the 111 subjects without memory disturbance (r = 0.64, p
< 0.01). The same is true for the 28 patients with memo- ry disturbance (r = 0.66, p < 0.01). Hence, the CC area and brain volume were positively correlated in all of the 139 subjects (r = 0.66, p < 0.01). This correlation could be statistically expressed as follows: CC area (mm3) = 0.49 × Brain volume (cm3) + 169.6 (Fig. 3).
The comparison of the CC area and brain volume among AD, MCI and the HCs
The brain volume of patients with AD (715.4 ± 107
cm3) was significantly smaller than in MCI patients (844.1 ± 85 cm3, p<0.05) and the HCs (818.9 ± 109 cm3, p < 0.05). There was no significant difference be- tween MCI patients and the HCs (Table 2) (Fig. 4). The
Fig. 4. The comparison of the brain volumes using a box plot.
The brain volume in patients with Alzheimer’s disease is sig- nificantly smaller than in patients with mild cognitive impair- ment and healthy controls. The comparison of the brain vol- ume between patients with mild cognitive impairment and healthy controls is not statistically significant. VOL, brain vol- ume; AD, Alzheimer disease; MCI, mild cognitive impair- ment; HC, healthy control.
Table 1. Demographic Characteristics
Characteristics AD* (n = 11) MCI* (n = 17) HC* (n = 28) Age (years) 75.7 ± 3.8 60.9 ± 11.7 66.4 ± 11.6
Sex (M/F) 3/8 8/9 11/17
MMSE� 17.5 ± 5.5 27.8 ± 1.40 NA�
CDR� 01.5 ± 0.5 0.5 ± 00. NA�
Values are expressed as means ± S.D
*AD, Alzheimer dementia; MCI, mild cognitive impairment; HC, Healthy control
�MMSE=mini-mental status examination; CDR=clinical demen- tia rating
�NA=not analyzed
Table 2. Comparison of the Brain Volume
AD* (cm3) MCI* (cm3) HC* (cm3) Mean ± SD 715.4 ± 107.3 844.1 ± 85.5 818.9 ± 109.7 Minimum 591.8 715.2 632.1
Maximum 991.3 1008.6 1029.4
*AD, Alzheimer dementia; MCI, mild cognitive impairment; HC, Healthy control
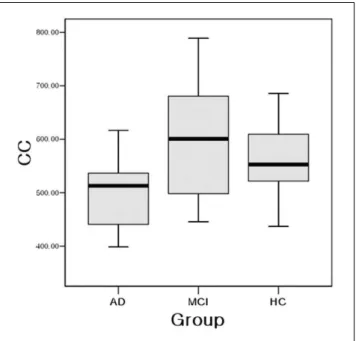
Fig. 5. The comparison of the corpus callosum (CC) area using a box plot. The CC area in patients with Alzheimer’s disease is significantly smaller than in patients with mild cognitive im- pairment and in the healthy controls. There is no significant difference in the CC area between patients with mild cognitive impairment and the healthy controls. VOL, brain volume; AD, Alzheimer disease; MCI, mild cognitive impairment; HC, healthy control.
CC area in AD patients (498.7 ± 72 mm2) was signifi- cantly smaller than in MCI patients (595.9 ± 108 mm2, p<0.05) and the HCs (563.2 ± 75 mm2, p < 0.05). No significant difference was found between MCI patients and the HCs (Table 3) (Fig. 5).
Discussion
Patients with AD complain of memory impairment that is abnormal for aging, in addition to impairment of at least one other cognitive function such as attention, language, visuospatial skills, or problem solving. These deficits in AD patients are sufficiently severe to compro- mise daily activities. Patients with MCI complained of memory impairment that is abnormal for aging; howev- er, unlike AD patients have generally normal cognition and the ability to function independently in their daily activities. The evaluation of the clinical course of pa- tients with MCI is important because individuals with MCI are at increased risk for developing AD; 10-15% of patients develop AD per year. MCI is thought to be a transitional stage between normal aging and dementia (1, 5, 6). Therefore, the treatment of patients with MCI may be effective in delaying the progression to AD, al- though management of patients with MCI is currently nonspecific (7).
Many studies have examined the structural and func- tional changes of the brain in patients with AD and MCI using various MR techniques. For example, studies have been performed on cross-sectional or longitudinal stud- ies of regional brain areas and volume (8, 20), the appar- ent diffusion coefficient (ADC) and diffusion tensor in- dex (DTI) (21, 22), and the magnetization transfer ratio (MTR) (23, 24). Based on the histopathological evidence that the entorhinal cortex (ERC) and hippocampus are early sites affected by AD, most structural MRI studies in patients with AD and MCI have focused on these two structures located in the medial temporal lobe (25). An increase in the ADC and a decrease in the fraction anisotropy have been reported in the temporal lobe, hip- pocampus, and corpus callosum (21, 22). Although the
volumetric and functional MR techniques need to be re- producible and ubiquitous for use in a clinical setting, the measurements of the changes in these small struc- tures are laborious and hard to replicate (8). The authors of a recent study noted the need for uniformity in the use of structural measures for the diagnosis and evalua- tion of patients with cognitive impairment (26).
Studies on brain activity using altered cerebral glucose metabolism with PET have also been reported (25). The hypometabolism observed on PET scans can help differ- entiate AD, frontotemporal dementia, and vascular de- mentia (27). The 18F-FDG PET may provide an objec- tive and sensitive imaging technique for the clinical di- agnosis of early dementia (28). Recent use of the amy- loid PET imaging tracer ligands offer the possibility of measuring fibrillar beta amyloid (Aβ) and the evaluation of the progression of amyloid in the brain (29).
However, these functional neuro-imaging procedures are not as cost effective for the diagnosis of AD (30, 31).
The CC is the largest connective pathway in the hu- man brain. It consists of more than 200 million nerve fibers that connect the right and left hemispheres of the brain (13, 14). The midsagittal cross-sectional area of the corpus callosum correlates with the number of callosal fibers (32). Several studies have showed a significant re- lationship between the CC area and brain volume in healthy and relatively young individuals (15-17). Our study revealed a stronger positive correlation, not only in healthy individuals with a wide age range, but also in patients with memory impairment (r = 0.64 and 0.66, respectively).
The regional degeneration of the cerebral cortex may cause atrophy of the CC due to the underlying patholo- gy (18, 33, 34). In patients with AD, it has been shown that the accumulation of β-amyloid plaques and neu- rofibrillary tangles in the cerebral cortex with neuronal and synaptic loss, produce cerebral atrophy (8). The CC atrophy is assumed to be the anatomical correlate of in- ter-hemispheric disconnection; namely, Wallerian de- generation of the interhemispheric commissural nerve fibers due to cerebral atrophy (35). In addition, Teipel et al. (19) reported that the CC size was significantly re- duced in AD patients. Accordingly, the annual rates of atrophy of the CC were significantly greater in the AD patients than in the HCs. Wang et al. (36), as well as Thomann et al. (37), recently reported that the CC area was significantly smaller in patients with AD than in comparison to patients with MCI and the HCs.
Moreover, there was no significant difference between Table 3. Comparison of the Corpus Callosal Area
AD (mm2) MCI (mm2) HC (mm2) Mean ± SD 498.7±72.2 595.9±108.4 563.2±75.1
Minimum 398.5 445.7 436.7
Maximum 616.3 788.9 685.8
*AD, Alzheimer dementia; MCI, mild cognitive impairment; HC, Healthy control
MCI patients and the HCs. The results of this study are consistent with the aforementioned reports (Citations??).
However, this is the only study that included a simulta- neous comparison of the forebrain volume and CC area among AD and MCI patients and the HCs.
This study has several limitations. The mean age of the patients with AD was significantly greater than the patients with MCI (Table1). Age is an important factor affecting brain volume (38, 39). Therefore, the older age of the patients with AD may a confounding factor in the finding of a smaller brain volume and CC area in the pa- tients with AD. The wide age difference between the pa- tients with AD and those with MCI was reflected in an older mean age of the HCs compared to the patients with MCI. The smaller brain volume and CC area in the HCs compared to the patients with MCI may also have been influenced by the age differences; although, upon comparison of patients with MCI and the HCs, there were no statistically significant differences between the brain volume and CC area.
In conclusion, the results of this study suggest that the CC area was significantly correlated with brain volume in patients with or without memory impairment. In ad- dition, CC atrophy was significant in the patients with AD compared to patients with MCI and the HCs.
References
1. Kelly BJ, Peterson RC. Alzheimer’s disease and mild cognitive im- pairment. Neurol Clin 2007;25:577-609
2. Petrella JR, Coleman RE, Doraiswamy PM. Neuroimaging and early diagnosis of Alzheimer disease: a look to the future. Radiology 2003;226:315-336
3. Matsuda H. The role of neuroimaging in mild cognitive impair- ment. Neuropathology 2007;27:570-577
4. Wimo A, Winblad B, Jonsson L. An estimate of the total world- wide societal costs of dementia in 2005. Alzheimer Dement 2007;3:81-91
5. Peterson RC, Doody R, Kurz A, Mohs RC, Morris JC, Rabins PV.
Current concepts in mild cognitive impairment. Arch Neurol 2001;58:1985-1992
6. Peterson RC, Smith GE, Waring SC, Ivnik RJ, Tangalos EG, Kokmen E. Mild cognitive impairment. Clinical characterization and outcome. Arch Neurol 1999;56:303-308
7. Mariani E, Monastero R, Mecocci P. Mild cognitive impairment: a systemic review. J Alzheimers Dis 2007;12:23-35
8. Ramani A, Jensen JH, Helpern JA. Quantitative MR imaging in Alzheimer disease. Radiology 2006;241:26-44
9. Osborn AG. Acquired metabolic, white matter, and degenerative dis- ease of the brain. In Diagnostic neuroradiology. St. Louis: Mosby-year Book, 1994;748-781
10. Krasuski JS, Alexander GE, Horwitz B, Daly EM, Murphy DG, Rapoport SI, et al. Volumes of medial temporal lobe structures in patients with Alzheimer’s disease and mild cognitive impairment (and in healthy controls). Biol Psychiatry 1998;43:60-68
11. Killiany RJ, Hyman BT, Gomez-Isla T, Moss MB, Kikinis R, Jolesz F, et al. MRI measures of entorhinal cortex vs hippocampus in pre- clinical AD. Neurology 2002;58:1188-1196
12. Hanyu H, Asano T, Sakurai H, Tanaka Y, Takasaki M, Abe K. MR analysis of the substantia innominata in normal aging, Alzheimer disease, and other types of dementia. AJNR Am J Neuroradiol 2002;
23:27-32
13. Anstey KJ, Mack HA, Christensen H, Li SC, Reglade-Meslin C, Maller J, et al. Corpus callosum size, reaction time speed and vari- ability in mild cognitive disorders and in normative sample.
Neuropsychologia 2007;45:1911-1920
14. Ryberg C, Rostrup E, Stegmann MB, Barkhof F, Scheltens P, van Straaten EC, et al. Clinical significance of corpus callosum atrophy in a mixed elderly population. Neurobiol Aging 2007;28:955-963 15. Mitchell TN, Free SL, Merschhemke M, Lemieux L, Sisodiya SM,
Shorvon SD, et al. Reliable callosal measurement: population nor- mative data confirm sex-related differences. AJNR Am J Neuroradiol 2003;24:410-418
16. Ja¨ncke L, Preis S, Steinmetz H. The relation between forebrain volume and midsagittal size of corpus callosum in children.
Neuroreport 1999;10:2981-2985
17. Ja¨ncke L, Staiger JF, Schlaug G, Huang Y, Steinmetz H. The rela- tionship between corpus callosum size and forebrain volume.
Cereb Cortex 1997;7:48-56
18. Hampel H, Teipel SJ, Alexander GE, Horwitz B, Teichberg D, Schapiro MB, et al. Corpus callosum atrophy is a possible indicator of region- and cell type-specific neuronal degeneration in Alzheimer disease: a magnetic resonance imaging analysis. Arch Neurol 1998;55:193-198
19. Teipel SJ, Bayer W, Alexander GE, Zebuhr Y, Teichberg D, Kulic L, et al. Progression of corpus callosum atrophy in Alzheimer dis- ease. Arch Neurol 2002;59:243-248
20. Thompson PM, Hayashi KM, de Zubicaray G, Janke AL, Rose SE, Semple J, et al. Dynamics of gray matter loss in Alzheimer’s dis- ease. J Neurosci 2003;23:994-1005
21. Parente DB, Gasparetto EL, da Cruz LC Jr, Domingues RC, Baptista AC, Carvalho AC, et al. Potential role of diffusion tensor MRI in the differential diagnosis of mild cognitive impairment and Alzheimer’s disease. AJR Am J Roentgenol 2008;190:1369-1374 22. Chua TC, Wen W, Slavin MJ, Sachdev PS. Diffusion tensor imag-
ing in mild cognitive impairment and Alzheimer’s disease: a re- view. Curr Opin Neurol 2008;21:83-92
23. Van Der Flier WM, Van Den Heuvel DM, Weverling-Rijnsburger AW, Bollen EL, Westendorf RG, van Buchem MA, et al.
Magnetization transfer imaging in normal aging, mild cognitive im- pairment, and Alzheimer’s disease. Ann Neurol 2002;52:62-67 24. Hanyu H, Asano T, Iwamoto T, Takasaki M, Shindo H, Abe K.
Magnetization transfer measurements of thehippocampus in pa- tients with Alzheimer’s disease, vascular dementia, and other types of dementia. AJNR Am J Neuroradiol 2000;21:1235-1242 25. Schuff N, Zhu XP. Imaging of mild cognitive impairment and early
dementia. Br J Radiol 2007;80:S109-S114
26. Luis CA, Loewenstein DA, Acevedo A, Barker WW, Duara R. Mild cognitive impairment directions for further research. Neurology 2003;61:438-444
27. O’Brien JT. Role of imaging techniques in the diagnosis of demen- tia. Br J Radiol 2007;80:S71-77
28. Mosconi L, Tsui WH, Herholz K, Pupi A, Drzezga A, Lucignani G, et al. Multicenter standardized 18F-FDG PET diagnosis of mild cognitive impairment, Alzheimer’s disease, and other dementias. J Nucl Med 2008;49:390-398
29. Nordberg A. Amyloid imaging in Alzheimer’s disease.
Neuropsychologia 2008;46:1636-1641
30. McMahon PM, Araki SS, Neumann PJ, Harris GJ, Gazelle GS.
Cost-effectiveness of functional imaging tests in the diagnosis of Alzheimer disease. Radiology 2000;217:58-68
31. McMahon PM, Arakl SS, Sandberg EA, Neumann PJ, Gazelle GS.
Cost-effective of PET in the diagnosis of Alzheimer disease.
Radiology 2003;228:515-522
32. Aboitiz F, Scheibel AB, Fisher RS, Zaidel E. Fiber composition of the human corpus callosum. Brain Res 1992;598:143-153
33. Moses P, Courchesne E, Stiles J, Trauner D, Egaas B, Edwards E.
Regional size reduction in the human corpus callosum following pre- and perinatal brain injury. Cereb Cortex 2000;10:1200-1210 34. Pelletier J, Suchet L, Witjas T, Habib M, Guttmann CR, Salamon
G, et al. A longitudinal study of callosal atrophy and interhemi- sphereic dysfunction in relapsing-remitting multiple sclerosis.
Arch Neurol 2001;58:105-111
35. Tomimoto H, Lin JX, Matsuo A, Ihara M, Ohtani R, Shibata M, et al. Different mechanisms of corpus callosal atrophy in Alzheimer’s
disease and vascular dementia. J Neurol 2004;251:398-406 36. Wang PJ, Saykin AJ, Flashman LA, Wishart HA, Rabin LA,
Santulli RB, et al. Regionally specific atrophy of the corpus callo- sum in AD, MCI and cognitive complaints. Neurobiol Aging 2006;
27:1613-1617
37. Thomann PA, Wu¨stenberg T, Pantel J, Essiq M, Schroder J.
Structural changes of the corpus callosum in mild cognitive im- pairment and Alzheimer’s disease. Dement Geriatr Cogn Disord 2006;21:215-220
38. Ge Y, Grossman RI, Babb JS, Rabin ML, Mannon LJ, Kolson DL.
Age-related total gray matter and white matter changes in normal adult brain. Part I: volumetric MR imaing anaylsis. AJNR Am J Neuroradiol 2002;23:1327-1333
39. Ikram MA, Vrooman HA, Vernooij MW, van der Lijn F, Hofman A, van der Luqt A, et al. Brain tissue volumes in the general elder- ly population The Rotterdam scan study. Neurobiol Aging 2008;29:
882-890
대한영상의학회지 2009;61:1-8
알츠하이머병, 경도인지장애 및 정상 대조군의 뇌량 면적과 뇌 용적의 비교1
1동국대학교병원 영상의학과
2분당서울대학교병원 영상의학과
3고려대학교 안산병원영상의학과
4동국대학교병원 신경과 최희석1,2∙서형석3∙김광기4∙윤 엽1
목적: 알츠하이머병과 경도 인지장애 그리고 정상 대조군에서 뇌량 면적과 뇌 용적의 관계를 알아보는 것을 목적으 로 하였다.
대상과 방법: 뇌량 면적과 뇌 용적의 상관 관계를 알아보기 위해, 기억력 장애가 없는 111명(남: 여 = 48:63; 평균 연령 56.9세)과 기억력 장애가 있는 28명(남: 여 = 11:17; 66.7세)을 분석하였다. 그리고 알츠하이머병과 경도 인 지장애 그리고 정상 대조군 사이의 뇌량 면적과 뇌 용적을 비교하기 위해, 11명의 알츠하이머병 환자(남: 여 = 3:8; 75.7세), 17명의 경도 인지장애 환자(남: 여 = 8:9; 60.9세) 그리고 28명의 선택된 정상 대조군(남: 여 = 11:17; 66.4세)을 대상으로 하였다.
결과: 기억력 장애가 없는 군과 기억력 장애가 있는 환자 군 모두에서 뇌량 면적과 뇌 용적 사이에 뚜렸한 양적 선형 관계가 있었다(r = 0.64 and 0.66, respectively, p < 0.01). 알츠하이머병 환자(498.7 ± 72 mm2, 715.4 ± 107 cm3)에서 뇌량 면적과 뇌 용적은 경도 인지장애 환자(595.9 ± 108 mm2, 844.1 ± 85 cm3) 및 정상 대조군 에 비해 유의하게 작았다(563.2 ± 75 mm2, 818.9 ± 109 cm3) (p < 0.05). 경도 인지장애 환자 및 정상 대조군 사이에 의미 있는 차이는 없었다.
결론: 뇌량 면적은 뇌 용적과 의미 있는 상관관계를 보이며, 알츠하이머병 환자에서 의미 있게 감소한다.