INTRODUCTION
Benign prostatic hyperplasia (BPH) is highly preva- lent in older men and increases with age [1]. In spite of extensive research efforts, the etiology of BPH has not been fully established. BPH might be caused by many
factors, including inflammation, metabolic syndrome (MetS), and endocrine hormones. In terms of endocrine factors, the roles of testosterone, estrogen, and growth factor have been reported [2]. However, scant data con- cerning the relationships between thyroid hormone and BPH are available.
Received: Sep 6, 2018 Revised: Dec 7, 2018 Accepted: Dec 7, 2018 Published online Jan 4, 2019 Correspondence to: Sung Won Lee https://orcid.org/0000-0001-6608-9050
Department of Urology, Samsung Medical Center, Sungkyunkwan University School of Medicine, 81 Irwon-ro, Gangnam-gu, Seoul 06351, Korea.
Tel: +82-2-3410-3552, Fax: +82-2-3410-3027 (ext. 221), E-mail: [email protected] Copyright © 2019 Korean Society for Sexual Medicine and Andrology
pISSN: 2287-4208 / eISSN: 2287-4690 World J Mens Health 2019 Sep 37(3): 364-371 https://doi.org/10.5534/wjmh.180084
The Relationships between Thyroid Hormone
Levels and Lower Urinary Tract Symptoms/Benign Prostatic Hyperplasia
Jun Ho Lee1 , Yeon Won Park1 , Sung Won Lee2
1Department of Urology, National Police Hospital, 2Department of Urology, Samsung Medical Center, Samsung Biomedical Research Institute, Sungkyunkwan University School of Medicine, Seoul, Korea
Purpose: We examined the association between thyroid hormone and lower urinary tract symptoms (LUTS)/benign prostatic hyperplasia (BPH).
Materials and Methods: A total of 5,708 middle aged men were included. LUTS/BPH were assessed using the international prostate symptom score (IPSS), total prostate volume (TPV), maximal flow rate (Qmax), and a full metabolic workup. Thyroid stimulating hormone (TSH) and free thyroxine (FT4) levels were measured using chemiluminescence immunoassay. We di- vided participants into quartiles based on their TSH and FT4 levels: first to fourth quartile (Q1–Q4).
Results: There was a significant increase in the percentage of men with IPSS>7, Qmax<10 mL/s, and TPV≥30 mL with in- crease of FT4 quartile. The adjusted odds ratio (OR) for TPV≥30 mL and IPSS>7 were significantly different between FT4 quartile groups (ORs; [5–95 percentile interval], p; TPV≥30 mL, Q1: 0.000 [references]; Q2: 1.140 [0.911–1.361], p=0.291;
Q3: 1.260 [1.030–1.541], p=0.025; Q4: 1.367 [1.122–1.665], p=0.002; IPSS>7: Q1: 0.000 [references]; Q2: 0.969 [0.836–
1.123], p=0.677; Q3: 1.123 [0.965–1.308], p=0.133; Q4: 1.221 [1.049–1.420], p=0.010). In men with above median levels of testosterone, the FT4 correlated positively with TPV, even after adjusting for confounders. However, the FT4 was not cor- related with TPV in men with below median levels of testosterone. TSH was not related to LUTS/BPH measurements.
Conclusions: TPV, IPSS, and Qmax were significantly related to FT4. TPV and IPSS were significantly and independently re- lated to FT4. Additionally, the relationship between FT4 and TPV was distinct when testosterone levels are high.
Keywords: Prostate; Prostatic hyperplasia; Testosterone; Thyroid; Urinary tract diseases
This is an Open Access article distributed under the terms of the Creative Commons Attribution Non-Commercial License (http://creativecommons.org/licenses/by-nc/4.0) which permits unrestricted non-commercial use, distribution, and reproduction in any medium, provided the original work is properly cited.
Investigational data have shown that thyroid hor- mones have a role in cell differentiation and growth as well as metabolism [3]. Recent clinical data reported that an increase in thyroid hormone is related to vari- ous cancers, including prostate cancer [4]. Addition- ally, some benign neoplasms are related to thyroid disease [5,6]. The possible relationships between thyroid hormone and BPH could be inferred from previous accumulated data. Therefore, we investigated the rela- tionship between thyroid hormone and BPH in middle aged men to better understand the etiology of BPH.
Additionally, we examine the role of testosterone in the relationships between thyroid hormone and BPH because testosterone is fundamental for developing BPH.
MATERIALS AND METHODS
1. Subjects and ethics statement
From September 2012 to November 2013, 5,708 men over 40 years of age received routine health check-ups at the Health Promotion Center of the National Police Hospital (Seoul, Korea). All of the participants provided written informed consent, and data concerning the participants were collected prospectively. The Institu- tional Review Board (IRB) of National Police Hospital approved this study (IRB number: 11100176-201611-HR- 011).
2. Lower urinary tract symptoms/benign prostatic hyperplasia assessments
The validated Korean version of international pros- tate symptom score (IPSS) was used. We divided par- ticipants into two categories: mild lower urinary tract symptoms (LUTS) (IPSS≤7) and moderate to severe LUTS (IPSS>7).
The maximal flow rate (Qmax) and postvoid residual urine volume (PVR) were assessed by uroflowmetry (Medtronic Inc., Minneapolis, MN, USA) and transab- dominal ultrasonography (UltraView 800; BK Medical, Herlev, Denmark), respectively. If voided volume dur- ing uroflowmetry was less than 150 mL [7], we omitted the data of Qmax and PVR. We divided participant according to Qmax of 10 mL/s [7] or PVR of 50 mL [7], because Qmax<10 mL/s or PVR≥50 mL is significantly related to bladder outlet obstruction [7].
Total prostate volume (TPV) was calculated using transrectal ultrasonography (UltraView 800; BK Medi-
cal). TPV measurements were performed by a single sonographer. We calculated TPV according to previous methods [8]. We divided the participants according to TPV of 30 mL, because TPV≥30 mL [9-11] is used in previous BPH epidemiologic studies.
In terms of prostate-specific antigen (PSA), we di- vided the participants according to PSA of 1.5 ng/mL, because PSA of >1.5 ng/mL is significantly related to bladder outlet obstruction [12].
3. Metabolic syndrome assessment
Two blood-pressure (mmHg) measurements, obtained 5 minutes apart using a mercury sphygmomanometer on the right arm, were averaged. Waist circumference (cm), to the nearest 0.1 cm, was measured midway be- tween the lowest rib and the iliac crest. Body weight (kg) and body height (cm) were also recorded. Serum was collected in the morning (between 7:00 and 9:00 AM) after an overnight fast. The biochemical analyses performed measured fasting serum glucose level, tri- glyceride level, and high-density lipoprotein cholesterol level. A diagnosis of MetS required the satisfaction of three or more of the NCEP-ATP III criteria [13].
4. Hormonal assay
Serum testosterone was measured via radioimmuno- assay using a kit from Cisbio Bioassays, Inc. (Codolet, France). The intra-assay coefficients of variation for all assays were less than 9%, and the inter-assay coeffi- cients of variation were less than 12%. For each assay, all samples from each subject were measured in the same assay run.
Free thyroxine (FT4) and thyroid-stimulating hor- mone (TSH) were estimated by chemiluminescence (Advia Centaur CP, Erlangen, Germany) using reagent kits from Siemens Diagnostic (Erlangen, Germany).
The intra-assay coefficients of variation for all assays were less than 9%, and the inter-assay coefficients of variation were less than 12%.
5. Statistical analysis
We excluded 126 men for whom testosterone, FT4, TSH, IPSS, uroflowmetry, body mass index, or TPV data were missing; men who had been administered related drugs including alpha blockers, phosphodiester- ase-5 inhibitors, anti-psychotics, thyroid supplements or anti-thyroid drugs, steroids, or beta-blockers; men who had undergone surgery or had been hospitalized due to
trauma in last 3 months; and men with pyuria.
We divided participants into quartiles based on their TSH and FT4 measurements. TSH: first quartile (Q1) (≤0.96 ng/mL); second quartile (Q2) (>0.96, ≤1.44 ng/mL);
third quartile (Q3) (>1.44, ≤2.1325 ng/mL); and fourth quartile (Q4) (>2.1325 ng/mL). FT4: Q1 (≤0.97 ng/mL), Q2 (>0.97, ≤1.05 ng/mL), Q3 (>1.05, ≤1.13 ng/mL), and Q4 (>1.13 ng/mL). We also divided participants into two groups based on their median testosterone level: testos- terone≤5.06 ng/mL and testosterone >5.06 mL.
First, we evaluated whether the ratio of IPSS>7, Qmax<10 mL/s, TPV≥30 mL, PVR≥50 mL, and PSA>1.5 ng/mL increased as FT4 or THS quartile increased, us- ing the Cochran-Armitage trend test (testing for the presence of a trend in case control or cross sectional studies where a series of increasing or decreasing expo- sures is being studied).
Second, the adjusted odds ratios (ORs) for IPSS>7, Qmax<10 mL/s, TPV≥30 mL, PVR≥50 mL, and PSA>1.5 ng/mL in relation to FT4 or TSH quartile were calcu- lated using logistic regression.
Third, we analyzed the trend of the ratio of TPV≥30 mL according to testosterone level to examine the im- pact of testosterone level (testosterone≤5.06 ng/mL and testosterone>5.06 mL) on the relationship between thy- roid hormone and TPV using the Cochran-Armitage trend test. Additionally, adjusted ORs for TPV≥30 mL in relation to FT4 quartile were calculated according to testosterone level (testosterone≤5.06 ng/mL and testos- terone>5.06 mL) to confirm the impact of testosterone level on the relationship between thyroid hormone and TPV after adjustment.
All tests were two-sided, with statistical significance set at p<0.05. Analyses were conducted with the R sta-
Table 1. Participants’ characteristics (n=5,582)
Variable Value
Age (y) 51.1±5.2
BMI (kg/m2) 25.0±2.4
No. of MetS component
0 675 (12.1)
1 1,188 (21.3)
2 1,381 (24.7)
3 1,293 (23.2)
4 827 (14.8)
5 218 (3.9)
FT4 (ng/dL) 1.05±0.14
TSH (ng/dL) 1.44 (0.96–2.13)
TPV (mL)
<20 1,481 (26.5)
20–29 3,142 (56.3)
30–39 770 (13.8)
≥40 189 (3.4)
Uroflowmetry
Voided volume (mL) 354.0 (244.0–486.0) Qmax
<15 mL/s 1,097 (19.7)
<10 mL/s 214 (3.8)
PVR ≥50 mL 782 (14.0)
PSA 0.71 (0.048–1.08)
IPSS
Mild LUTS 2,283 (40.9)
Moderate LUTS 2,612 (46.8)
Severe LUTS 687 (12.3)
Testosterone (ng/mL) 5.2±1.5
Values are presented as mean±standard deviation, number (%), or median (interquartile range).
BMI: body mass index, MetS: metabolic syndrome, FT4: free thyrox- ine, TSH: thyroid stimulating hormone, TPV: total prostate volume, Qmax: maximal flow rate, PVR: postvoid residual urine volume, PSA:
prostate specific antigen, IPSS: international prostate symptom score, LUTS: lower urinary tract symptoms.
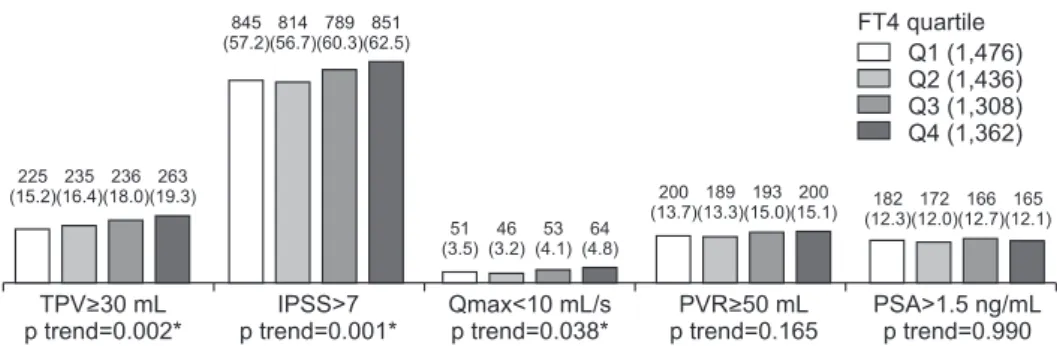
Fig. 1. Relationships between FT4 and LUTS/BPH measurements. Values are presented as number (%). Cochran-Armitage trend test were used for statistical analysis. FT4: free thyroxine, LUTS: lower urinary tract symptoms, BPH: benign prostatic hyperplasia, TPV: total prostate volume, IPSS:
international prostate symptom score, Qmax: maximal flow rate, PVR: postvoid residual urine volume, PSA: prostate specific antigen, Q1: first quartile, Q2: second quartile, Q3: third quartile, Q4: fourth quartile. *p-value statistically significant <0.05.
TPV>30 mL p trend=0.002*
IPSS>7 p trend=0.001*
Qmax<10 mL/s p trend=0.038*
PVR>50 mL p trend=0.165
PSA>1.5 ng/mL p trend=0.990 51
(3.5) 46 (3.2)
53 (4.1)
64 (4.8)
182 (12.3)
172 (12.0)
166 (12.7)
165 (12.1) 200
(13.7) 189 (13.3)
193 (15.0)
200 (15.1) 225
(15.2) 235 (16.4)
236 (18.0)
263 (19.3)
845 (57.2)
814 (56.7)
789 (60.3)
851 (62.5)
Q1 (1,476) Q2 (1,436) Q3 (1,308) Q4 (1,362) FT4 quartile
tistical package v.2.13.1 (R Foundation for Statistical Computing, Vienna, Austria).
RESULTS
1. Patient characteristics
The characteristics of the patient population are shown in Table 1. Mean TPV, IPSS, and Qmax was 24.1±7.0 mL, 10.6±7.1, and 23.0±8.6 mL/s, respectively. In addition, the ratio of MetS was 41.9%, and the median PVR (interquartile range) was 0 mL (0–38.0 mL).
2. Free thyroxine and lower urinary tract symptoms/benign prostatic hyperplasia
There was a significant increase in the percentage of men with IPSS>7, Qmax<10 mL/s, and TPV≥30 mL with increase in FT4 quartile, but not PVR≥50 mL and PSA>1.5 ng/mL (Fig. 1). After adjusting, the ORs for TPV≥30 mL of FT4 Q3 and FT4 Q4 were significantly higher than FT4 Q1 (Table 2). Additionally, the adjust- ed ORs for IPSS>7 of FT4 Q4 were significantly higher than that of FT4 Q1 (Table 2). However, the adjusted ORs for Qmax<10 mL/s, PVR≥50 mL, and PSA>1.5 ng/
mL were not significantly different between FT4 quar- tile groups (Table 2). In sum, IPSS, Qmax, and TPV were significantly related to FT4, and IPSS. In addi- tion, TPV were significantly and independently related to FT4.
3. Thyroid-stimulating hormone and lower urinary tract symptoms/benign prostatic hyperplasia
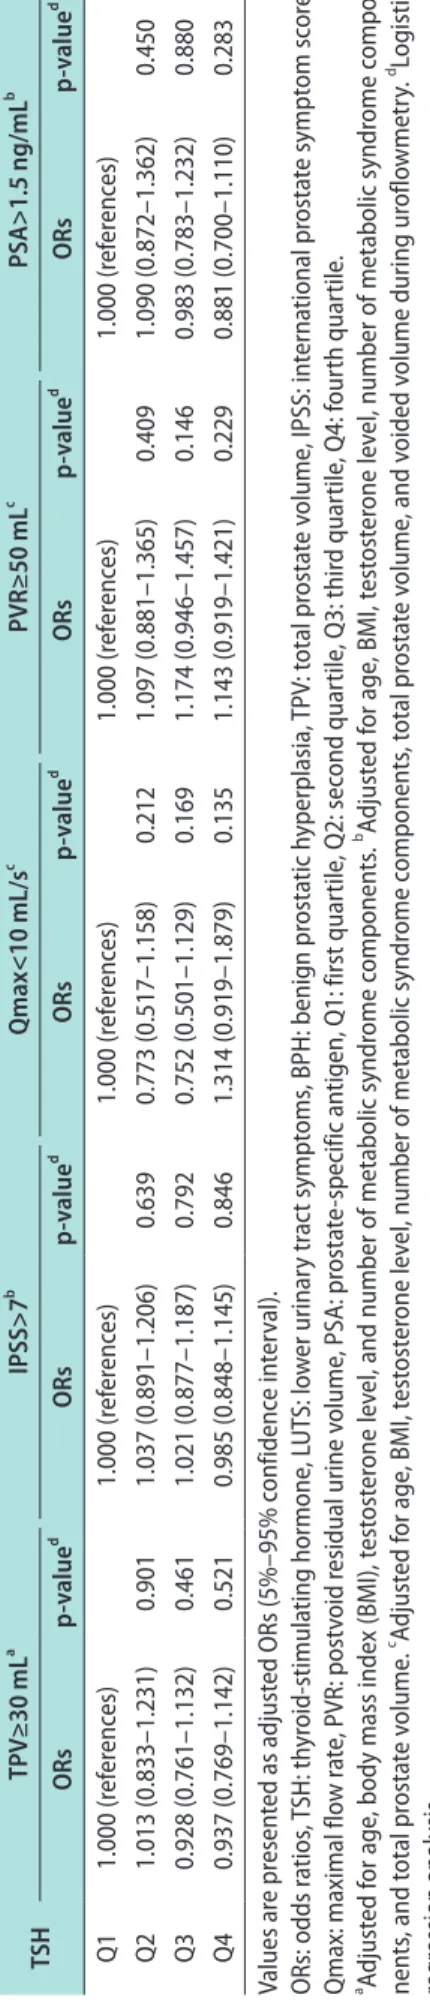
TSH was not significantly related to IPSS, TPV, Qmax, PVR, or PSA in univariate and multivariate analysis (Fig. 2, Table 3).
4. Impact of testosterone level on the relationship between free thyroxine and total prostate volume
TPV among LUTS/BPH measurements was most re- lated to FT4 in this study (smallest p-value), and pros- tate enlargement is one of the most important compo- nents of LUTS/BPH development. And, testosterone is fundamental for developing LUTS/BPH. Therefore, we examined whether the relationship between FT4 and TPV is maintained after subgroup analysis according to testosterone level. In high testosterone levels (testos-
terone>5.06 mL), the percentage of men with TPV≥30 Table 2.
Adjusted ORs of FT4 for LUTS/BPH measurement FT4TPV≥30 mLa IPSS>7b Qmax<10 mL/secc PVR≥50 mLc PSA>1.5 ng/mLb ORsp-valued ORsp-valued ORsp-valued ORsp-valued ORsp-valued Q11.000 (references)1.000 (references)1.000 (references)1.000 (references)1.000 (references) Q21.113 (0.910–1.361)0.2960.970 (0.837–1.124)0.6840.890 (0.592–1.338)0.5760.970 (0.782–1.203)0.7790.967 (0.773–1.210)0.770 Q31.256 (1.027–1.537)0.027*1.121 (0.963–1.305)0.1411.145 (0.772–1.698)0.5001.097 (0.885–1.361)0.3981.056 (0.842–1.324)0.638 Q41.364 (1.120–1.662)0.002*1.215 (1.044–1.414)0.012*1.340 (0.918–1.955)0.1291.092 (0.882–1.353)0.4190.990 (0.789–1.242)0.932 Values are presented as adjusted ORs (5%–95% confidence interval). ORs: odds ratios, FT4: free thyroxine, LUTS: lower urinary tract symptoms, BPH: benign prostatic hyperplasia, TPV: total prostate volume, IPSS: international prostate symptom score, Qmax: maximal flow rate, PVR: postvoid residual urine volume, PSA: prostate-specific antigen, Q1: first quartile, Q2: second quartile, Q3: third quartile, Q4: fourth quartile. a Adjusted for age, body mass index (BMI), testosterone level, and number of metabolic syndrome components. b Adjusted for age, BMI, testosterone level, number of metabolic syndrome compo- nents, and total prostate volume. c Adjusted for age, BMI, testosterone level, number of metabolic syndrome components, total prostate volume, and voided volume during uroflowmetry. d Logistic regression analysis. *p-value statistically significant <0.05.
mL significantly increased with an increase of FT4 quartile, but not in low testosterone levels (testoster- one≤5.06 ng/mL) (Table 4). The relationship between TPV≥30 mL and FT4 in high testosterone levels was maintained after adjusting for confounding factors (Table 5), but not in the low testosterone level. Accord- ing to our results, the relationship between FT4 and TPV was distinct only in high testosterone levels.
DISCUSSION
In this study, TPV, IPSS, and Qmax were significant- ly related to FT4 in univariate analysis. Additionally, TPV and IPSS were significantly related to FT4 in multivariate analysis. However, TSH was not related to LUTS/BPH measurements.
BPH is induced by static and/or dynamic pathways [14]. According to this theory, the dynamic component of bladder outlet obstruction was induced by the ten- sion of prostate smooth muscle by increased alpha- adrenoceptors. The static component of bladder outlet obstruction was induced by the anatomic obstruction resulting from enlargement of the prostate.
In terms of static components, previous data showed the relationship between thyroid hormone levels and prostate enlargement. A case-control study [15] (includ- ing 20 BPH cases and 27 normal controls) from the USA reported that mean tri-iodothyronine was higher in BPH cases compared to controls (72.0±24.9 ng/dL vs.
94.4±12.3 ng/dL, p<0.001). However, the data concern- ing exact prostate size was missing in this data [15]. A case-control study [16] (including 40 BPH cases and 40 normal controls) conducted in India showed that free tri-iodothyronine and FT4 were significantly higher
in BPH cases (median TPV: 45.5 mL) when compared with normal controls (median TPV: 18 mL). However, the Indian data had few participants and did not ad- just for confounding factors, such as age, testosterone level, and MetS, which are very important factors in developing BPH. In our data including a large popu- lation of middle-aged men, TPV was related to FT4 throughout the statistical analyses, including univari- ate and multivariate analyses. Our data confirm the significant and independent relationship between thy- roid hormone and prostate enlargement in more pre- cise ways than any other study. Therefore, our results suggest a possible role of FT4 in the development of LUTS/BPH.
The mechanism of the relationship between thyroid hormone and prostate enlargement is unclear [16].
Some type of mechanism connecting thyroid hormone and cancer could be applied to our results [16]. There are several pathways that may explain the relation- ship between cancer and thyroid function, as follow [17]: first, the binding of thyroid hormone to thyroid hormone receptors initiates the oncogenic phospha- tidylinositol-3-kinase (PI3K) pathway [4,17], then the PI3K pathway induces the expression of transcription factor hypoxia-inducible factor 1 (HIF1). HIF1 target genes induce tumor development, growth, invasion and metastasis. Second, thyroid hormone binds to the protein integrin αvβ3. This binding leads to activa- tion of the PI3K and ERK1/2 pathways. The latter pathway induces fibroblast growth factor 2, which is a stimulator of angiogenesis [4,17]. In addition, thyroid hormone activates mitogen-activated protein kinase (MAPK) [17,18]. MAPK induces the serine phosphoryla- tion of thyroid receptors, which induces angiogenesis Fig. 2. Relationships between TSH and LUTS/BPH measurements. Values are presented as number (%). Cochran-Armitage trend test were used for statistical analysis. TSH: thyroid stimulating hormone, LUTS: lower urinary tract symptoms, BPH: benign prostatic hyperplasia, TPV: total prostate volume, IPSS: international prostate symptom score, Qmax: maximal flow rate, PVR: postvoid residual urine volume, PSA: prostate specific anti- gen, Q1: first quartile, Q2: second quartile, Q3: third quartile, Q4: fourth quartile.
TPV>30 mL p trend=0.386
IPSS>7 p trend=0.668
Qmax<10 mL/s p trend=0.199
PVR>50 mL p trend=0.269
PSA>1.5 ng/mL p trend=0.280 58
(4.1) 43 (3.2)
42 (3.1)
71 (5.2)
176 (12.3)
183 (13.3)
169 (12.2)
157 (11.3) 185
(13.2) 193 (14.3)
206 (15.4)
198 (14.4) 250
(17.5) 247 (17.9)
230 (16.6)
232 (16.6)
843 (59.0)
822 (59.7)
821 (59.4)
813
(58.3) Q1 (1,428)
Q2 (1,377) Q3 (1,382) Q4 (1,395) TSH quartile
and tumor proliferation [17,18]. Further investigational research is needed to identify the exact mechanism in the relation between prostate enlargement and thyroid function.
In contrast to FT4, TSH is not clearly correlated with LUTS/BPH measurements. However, TSH was related to prostate size in previous data from India [16]. Approximately 85% of thyroid hormone produced in the body is T4. The 99.8% of thyroid hormones are protein-bound, and only the free components, including FT4 have the ability to bind to their respective recep- tors. TSH, which is released from the pituitary gland, regulates the production of thyroid hormone, but TSH itself does not act as thyroid hormone. Therefore, FT4 is more representative of thyroid function rather than TSH. Considering the aforementioned issues, our re- sults showing that TSH is not related to LUTS/BPH measurements does not hinder the fact that thyroid function is related to LUTS/BPH.
In this study, the relationship between FT4 and Table 3. Adjusted ORs of TSH for LUTS/BPH measurement TSHTPV≥30 mLa IPSS>7b Qmax<10 mL/sc PVR≥50 mLc PSA>1.5 ng/mLb ORsp-valued ORsp-valued ORsp-valued ORsp-valued ORsp-valued Q11.000 (references)1.000 (references)1.000 (references)1.000 (references)1.000 (references) Q21.013 (0.833–1.231)0.9011.037 (0.891–1.206)0.6390.773 (0.517–1.158)0.2121.097 (0.881–1.365)0.4091.090 (0.872–1.362)0.450 Q30.928 (0.761–1.132)0.4611.021 (0.877–1.187)0.7920.752 (0.501–1.129)0.1691.174 (0.946–1.457)0.1460.983 (0.783–1.232)0.880 Q40.937 (0.769–1.142)0.5210.985 (0.848–1.145)0.8461.314 (0.919–1.879)0.1351.143 (0.919–1.421)0.2290.881 (0.700–1.110)0.283 Values are presented as adjusted ORs (5%–95% confidence interval). ORs: odds ratios, TSH: thyroid-stimulating hormone, LUTS: lower urinary tract symptoms, BPH: benign prostatic hyperplasia, TPV: total prostate volume, IPSS: international prostate symptom score, Qmax: maximal flow rate, PVR: postvoid residual urine volume, PSA: prostate-specific antigen, Q1: first quartile, Q2: second quartile, Q3: third quartile, Q4: fourth quartile. a Adjusted for age, body mass index (BMI), testosterone level, and number of metabolic syndrome components. b Adjusted for age, BMI, testosterone level, number of metabolic syndrome compo- nents, and total prostate volume. c Adjusted for age, BMI, testosterone level, number of metabolic syndrome components, total prostate volume, and voided volume during uroflowmetry. d Logistic regression analysis.
Table 4. Relationships between FT4 and TPV ≥30 mL according to testosterone level
Testosterone level
FT4 p-valuea
Q1 Q2 Q3 Q4
≤5.06 ng/mL 16.6 14.8 18.4 18.2 0.189
>5.06 ng/mL 13.9 18.0 17.7 20.5 0.002*
Values are presented as percent only.
FT4: free thyroxine, TPV: total prostate volume, Q1: first quartile, Q2:
second quartile, Q3: third quartile, Q4: fourth quartile.
aCochran-Armitage trend test. *p-value statistically significant <0.05.
Table 5. Adjusted ORs of FT4 for TPV ≥30 mLa according to testoster- one level
Testosterone
level FT4 Adjusted ORs (5%–95%
confidence interval) p-valueb
≤5.06 ng/mL Q1 1.000 (references)
Q2 0.883 (0.663–1.175) 0.393 Q3 1.145 (0.864–1.516) 0.345 Q4 1.222 (0.851–1.481) 0.414
>5.06 ng/mL Q1 1.000 (references)
Q2 1.394 (1.050–1.851) 0.022*
Q3 1.386 (1.036–1.852) 0.028*
Q4 1.661 (1.253–2.203) <0.001*
ORs: odds ratios, FT4: free thyroxine, TPV: total prostate volume, Q1:
first quartile, Q2: second quartile, Q3: third quartile, Q4: fourth quartile.
aAdjusted for age, body mass index, and number of metabolic syn- drome components. bLogistic regression analysis. *p-value statisti- cally significant <0.05.
TPV was maintained only in high testosterone levels.
Similar results have been reported in the relationship between estrogen and BPH. In the Olmsted County co- hort [19], in men with above median levels of testoster- one, the estradiol level correlated positively with TPV.
In dogs, treatment of castrated male dogs with andro- gens and estrogens led to more extensive prostate en- largement than androgen or estrogen single treatment [20]. Therefore, it has been suggested that androgens may serve as a potential “pool” for metabolism to estro- gens that can promote or inhibit prostatic proliferation [21]. We speculate that androgens may also serve as a potential “pool” for metabolism to thyroid hormone.
Several limitations of the present study warrant dis- cussion. First, the cross-sectional nature of the dataset makes causal inferences problematic. In addition, there may be a potential selection bias because our data are from a single institution. However, we think that our data are highly relevant because this study was a large cross-sectional study.
CONCLUSIONS
In summary, TPV, IPSS, and Qmax were signifi- cantly related to FT4. TPV and IPSS were significantly and independently related to FT4. Additionally, the relationship between FT4 and TPV is distinct when testosterone levels are high. We found a possible role of thyroid hormone in the development of LUTS/BPH, and we demonstrated a possible role of testosterone in the relationship between thyroid hormone and TPV.
Disclosure
The authors have no potential conflicts of interest to disclose.
Author Contribution
Lee JH conceived of the study, drafted the manuscript, and performed the statistical analysis. Park YW participated in data collection. Lee SW participated in its design and coordination and helped to draft the manuscript. All authors read and ap- proved the final manuscript.
REFERENCES
1. Ziada A, Rosenblum M, Crawford ED. Benign prostatic hy- perplasia: an overview. Urology 1999;53(3 Suppl 3a):1-6.
2. La Vignera S, Condorelli RA, Russo GI, Morgia G, Calogero AE. Endocrine control of benign prostatic hyperplasia. An- drology 2016;4:404-11.
3. Hercbergs A. The thyroid gland as an intrinsic biologic re- sponse-modifier in advanced neoplasia: a novel paradigm. In Vivo 1996;10:245-7.
4. Moeller LC, Führer D. Thyroid hormone, thyroid hormone receptors, and cancer: a clinical perspective. Endocr Relat Cancer 2013;20:R19-29.
5. Anil C, Guney T, Gursoy A. The prevalence of benign breast diseases in patients with nodular goiter and Hashimoto’s thy- roiditis. J Endocrinol Invest 2015;38:971-5.
6. Spinos N, Terzis G, Crysanthopoulou A, Adonakis G, Markou KB, Vervita V, et al. Increased frequency of thyroid nodules and breast fibroadenomas in women with uterine fibroids.
Thyroid 2007;17:1257-9.
7. Gratzke C, Bachmann A, Descazeaud A, Drake MJ, Maders- bacher S, Mamoulakis C, et al. EAU guidelines on the assess- ment of non-neurogenic male lower urinary tract symptoms including benign prostatic obstruction. Eur Urol 2015;67:
1099-109.
8. Kim SH, Kim SH. Correlations between the various methods of estimating prostate volume: transabdominal, transrectal, and three-dimensional US. Korean J Radiol 2008;9:134-9.
9. Egan KB. The epidemiology of benign prostatic hyperplasia associated with lower urinary tract symptoms: prevalence and incident rates. Urol Clin North Am 2016;43:289-97.
10. Barry MJ, Fowler FJ Jr, O’Leary MP, Bruskewitz RC, Holt- grewe HL, Mebust WK, et al. The American Urological As- sociation symptom index for benign prostatic hyperplasia.
The Measurement Committee of the American Urological Association. J Urol 1992;148:1549-57; discussion 1564.
11. Huh JS, Kim YJ, Kim SD. Prevalence of benign prostatic hyperplasia on Jeju Island: analysis from a cross-sectional community-based survey. World J Mens Health 2012;30:131- 7.
12. Lim KB, Ho H, Foo KT, Wong MY, Fook-Chong S. Compari- son of intravesical prostatic protrusion, prostate volume and serum prostatic-specific antigen in the evaluation of bladder outlet obstruction. Int J Urol 2006;13:1509-13.
13. Grundy SM, Cleeman JI, Daniels SR, Donato KA, Eckel RH, Franklin BA, et al. Diagnosis and management of the meta- bolic syndrome: an American Heart Association/National Heart, Lung, and Blood Institute scientific statement. Circula- tion 2005;112:2735-52.
14. Lepor H. Pathophysiology of benign prostatic hyperplasia:
insights from medical therapy for the disease. Rev Urol 2009;
11:S9-13.
15. Lehrer S, Diamond EJ, Stone NN, Droller MJ, Stock RG. Se- rum triiodothyronine is increased in men with prostate can- cer and benign prostatic hyperplasia. J Urol 2002;168:2431-3.
16. Eldhose A, Nandeesha H, Dorairajan LN, Sreenivasulu K, Arul Vijaya Vani S. Thyroid and parathyroid hormones in be- nign prostatic hyperplasia. Br J Biomed Sci 2016;73:94-6.
17. Khan SR, Chaker L, Ruiter R, Aerts JG, Hofman A, Dehghan A, et al. Thyroid function and cancer risk: the Rotterdam study. J Clin Endocrinol Metab 2016;101:5030-6.
18. Kress E, Samarut J, Plateroti M. Thyroid hormones and the control of cell proliferation or cell differentiation: paradox or
duality? Mol Cell Endocrinol 2009;313:36-49.
19. Roberts RO, Jacobson DJ, Rhodes T, Klee GG, Leiber MM, Jacobsen SJ. Serum sex hormones and measures of benign prostatic hyperplasia. Prostate 2004;61:124-31.
20. Moore RJ, Gazak JM, Quebbeman JF, Wilson JD. Concentra- tion of dihydrotestosterone and 3 alpha-androstanediol in naturally occurring and androgen-induced prostatic hyper- plasia in the dog. J Clin Invest 1979;64:1003-10.
21. Nicholson TM, Ricke WA. Androgens and estrogens in be- nign prostatic hyperplasia: past, present and future. Differen- tiation 2011;82:184-99.