FDG PET or PET/CT in Evaluation of Renal Angiomyolipoma
Chun-Yi Lin, MD
1, Hui-Yi Chen, MD
2, Hueisch-Jy Ding, PhD
3, Kuo-Yang Yen, BSC
4, Chia-Hung Kao, MD
41Department of Nuclear Medicine, Show Chwan Memorial Hospital, Changhua 500, Taiwan; 2Department of Radiology, China Medical University Hospital, Taichung 404, Taiwan; 3Department of Nuclear Medicine, E-DA Hospital I-Shou University, Kaohsiung 840, Taiwan; 4Department of Nuclear Medicine and PET Center, China Medical University Hospital, Taichung 404, Taiwan
Objective: Angiomyolipoma is the most common benign kidney tumor. However, literature describing FDG PET findings on renal angiomyolipoma (AML) is limited. This study reports the FDG PET and PET/CT findings of 21 cases of renal AML.
Materials and Methods: The study reviews FDG PET and PET/CT images of 21 patients diagnosed with renal AML. The diagnosis is based on the classical appearance of an AML on CT scan with active surveillance for 6 months. The study is focused on the observation of clinical and radiographic features.
Results: Six men and 15 women were included in our study. The mean age of the patients was 57.14 ± 9.67 years old. The mean diameter of 21 renal AML on CT scans was 1.76 ± 1.00 cm (Min: 0.6 cm; Max: 4.4 cm). CT scans illustrated renal masses typical of AMLs, and the corresponding FDG PET scans showed minimal FDG activities in the area of the tumors.
None of the 21 AMLs showed a maximum standardized uptake value (SUVmax) greater than 1.98. No statistically significant correlation was present between SUVmax and tumor size.
Conclusion: Renal AMLs demonstrate very low to low uptake on FDG PET and PET/CT imaging in this study. When a fat- containing tumor in the kidney is found on a CT scan, it is critical to differentiate an AML from a malignant tumor including an RCC, liposarcoma, and Wilms tumor. This study suggests that FDG PET or PET/CT imaging is useful for differentiating a renal AML from a fat-containing malignant tumor.
Index terms: Computed tomography; Fluorine-18 fluoro-2-deoxy-D-glucose; Positron emission tomography; Renal angiomylipoma.
Received June 20, 2012; accepted after revision August 31, 2012.
This study was supported by grants (DMR-101-061 and DMR-101-080) from the Taiwan Department of Health Clinical Trial and Research Center of Excellence (DOH102-TD-B-111-004), and the Taiwan Department of Health Cancer Research Center for Excellence (DOH102- TD-C-111-005).
Corresponding author: Chia-Hung Kao, MD, Department of Nuclear Medicine and PET Center, China Medical University Hospital, No. 2, Yuh-Der Road, Taichung 404, Taiwan.
• Tel: (886) 4-22052121x7412 • Fax: (886) 4-22336174 • E-mail: [email protected]
This is an Open Access article distributed under the terms of the Creative Commons Attribution Non-Commercial License (http://
creativecommons.org/licenses/by-nc/3.0) which permits unrestricted non-commercial use, distribution, and reproduction in any medium, provided the original work is properly cited.
Korean J Radiol 2013;14(2):337-342 pISSN 1229-6929 · eISSN 2005-8330
INTRODUCTION
Renal angiomyolipoma (AML) is a relatively rare renal cortical neoplasm that has been identified in less than 0.2%
of the general population. AMLs are composed of smooth
muscle cells, dysmorphic blood vessels, and fatty tissue with a known benign nature. AML is usually asymptomatic and is often managed with active surveillance protocols (1).
AMLs account for 24% of spontaneous renal hematomas and sudden-onset flank pain is the most common symptom (2).
Conditions for intervention are suspicion of malignancy, size greater than 4 cm, spontaneous hemorrhage, and pain (3).
The classical appearance of an AML on a CT scan is a predominantly fatty inhomogeneous mass with varying amounts of tissue density interspersed within it. The fat seen in this lesion is similar in appearance to subcutaneous or retroperitoneal fat (4). On a CT, fat is characterized by its negative number of Hounsfield units (HUs). A tissue attenuation of -10 HU is typically a reliable indicator of fat. A well-circumscribed renal mass with intratumoral fat on CT scan is similar to the diagnostic finding of renal angiomyolipoma (5).
Currently, positron emission tomography (PET) forms part of the routine assessment of malignant diseases. The vast majority of PET scans are performed with fluorine-18 fluoro-2-deoxy-D-glucose (FDG), an analogue of glucose.
Many cancers correlate with their metabolic activities, as indicated by the degree of FDG accumulation on PET imaging (6).
Angiomyolipoma is the most common benign tumor of the kidney (5). However, literature describing the FDG PET or PET/CT findings on renal AML is limited. This study reports FDG PET and PET/CT findings of 21 cases of renal AML.
MATERIALS AND METHODS
Between January 2006 and December 2010, 473 patients were diagnosed with typical AMLs on CT scan with active surveillance for 6 months in our hospital. Researchers retrospectively extracted clinical and radiographic data from the complete medical records. Twenty-one cases had received FDG PET or PET/CT imaging for other oncologic surveys; these formed the basis of this study. The time gap between the diagnostic CT and the FDG PET (or PET/CT) was within one month. This study was approved by the hospital ethics committee (DMR-99-IRB-010-2).
Computed Tomography Scan
In all patients, triple-phase dynamic CT examination was performed using MDCT scanners (LightSpeed 16; GE Medical Systems Milwaukee, WI, USA). The images were reconstructed at 5-mm intervals to provide contiguous sections. All patients underwent a contrast-enhanced biphase helical CT examination including arterial and equilibrium phases. Following a bolus-triggered technique, the arterial phase began 20-35 s after a 100-mL injection of nonionic iodinated contrast material with an automatic
power injector, at a rate of 3 mL/s. The venous phase began 180 s after initiating the contrast injection.
FDG PET and PET/CT Imaging
For the 18F-FDG PET and PET/CT examinations, patients were asked to fast for at least 4 hours before scanning. Each patient was injected intravenously with 370 megabecquerel (MBq) of 2-18F-FDG PET and rested supine in a quiet, dimly lit room. Imaging was performed with a positron emission tomography/computed tomography (PET/CT) scanner or PET scanner (PET/CT: Discovery STE, PET: Advance NXi, General Electric Healthcare, Milwaukee, WI, USA). Scanning began approximately 60 min after the FDG injection. When patients were positioned in the PET/CT scanner, a molded headrest and a head-restraining Velcro band were applied to secure their heads firmly, to reduce motion artifact.
Fluorine-18 fluoro-2-deoxy-D-glucose positron emission tomography scanning was performed with an axial field of view of 14.6 cm. Emission scans required a 3-min acquisition time in 2-D mode at every table position, typically requiring 6 or 7 bed positions to cover the entire field of view. After emission scanning a transmission scan was started using 68Ge pin sources rotating around the body.
Transmission scans were performed from the head to the pelvic floor of the patient, with a 2-min acquisition time at every table position. Image data sets were reconstructed using an iterative algorithm with segmented attenuation correction from the collected data, which had been corrected for scatter, random events, and dead time.
The PET/CT examinations were started by acquiring a CT topogram to define the axial examination range of the PET/CT study. After defining the axial imaging range, a spiral non-contrast-enhanced low-radiation-dose CT scan (0.8-second rotation time, 120 kVp, variable mA with AutomA technique, 3.75-mm slice thickness, and 1.75 : 1 pitch) was acquired for anatomical references and attenuation correction. PET emission images were then acquired after CT scans at 2 min per field of view (FOV) in the 3-D acquisition mode with 11-slice overlap at the FOV borders. The CT images were reconstructed onto a 512 × 512 matrix and converted to a 128 x 128 matrix, with 511-keV- equivalent attenuation factors for attenuation correction of the corresponding PET emission images. The PET images were then reconstructed to attenuation-corrected, 3.27-mm transaxial slice thickness for further interpretation.
Researchers measured the maximum standardized uptake values (SUVmax) of each AML on the FDG PET and PET-CT
images.
Statistical Analysis
We expressed the values of age, tumor size on CT scan, and SUVmax of tumor on FDG PET and PET/CT as mean ± standard deviation. The relationship between tumor size on CT scan and SUVmax of tumor on FDG PET and PET/CT in renal AML of our study was analyzed using a Spearman rank correlation. All analyses were conducted by STATA 11.0 using a 0.05 level of significance.
RESULTS
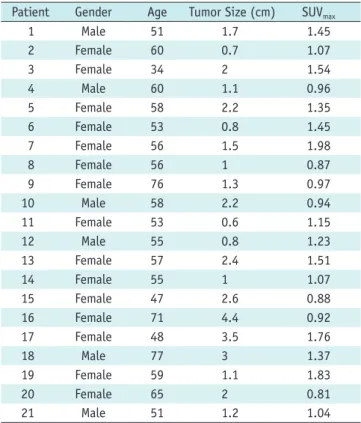
Table 1 shows the profile of the renal AML patients, tumor size on CT scan, and SUVmax of tumor on FDG PET and PET/
CT. Of the 21 patients, 15 were women and 6 were men. The mean age of the patients was 57.14 ± 9.67 years. The mean diameter of 21 renal AMLs on CT scan was 1.76 ± 1.00 cm.
The minimum tumor diameter on CT scans was 0.6 cm and maximum diameter was 4.4 cm. The mean SUVmax was 1.25 ± 0.34. None of the 21 AML showed SUVmax greater than 1.98 (Figs. 1, 2). Generally, FDG uptake (expressed as SUVmax > 2.5) is interpreted as being “positive” or PET-avid. No positive FDG PET or PET/CT imaging was found in the renal AML of our study. There was no statistically significant correlation between SUVmax and tumor size (B = 0.045, p = 0.85).
DISCUSSION
Renal angiomyolipoma is a fairly common benign renal tumor that is often found incidentally. Renal AML is composed of mature adipose tissue, smooth muscle and
blood vessels. AML is not always located in the kidney, but may also be found in the liver, spleen, uterus, and tubes (7).
Literature on the role of FDG PET or PET/CT in the diagnosis AMLs is limited. Lhommel et al. (8) reported a case where a liver AML did not have increased FDG uptake but had increased C11 acetate uptake. Ho et al. (9) reported increased C11 acetate uptake but no abnormal FDG uptake
Table 1. Clinical Features of Patients, Size on CT Scan and SUVmax on FDG PET or PET/CT of Renal AML
Patient Gender Age Tumor Size (cm) SUVmax
1 Male 51 1.7 1.45
2 Female 60 0.7 1.07
3 Female 34 2 1.54
4 Male 60 1.1 0.96
5 Female 58 2.2 1.35
6 Female 53 0.8 1.45
7 Female 56 1.5 1.98
8 Female 56 1 0.87
9 Female 76 1.3 0.97
10 Male 58 2.2 0.94
11 Female 53 0.6 1.15
12 Male 55 0.8 1.23
13 Female 57 2.4 1.51
14 Female 55 1 1.07
15 Female 47 2.6 0.88
16 Female 71 4.4 0.92
17 Female 48 3.5 1.76
18 Male 77 3 1.37
19 Female 59 1.1 1.83
20 Female 65 2 0.81
21 Male 51 1.2 1.04
Note.— SUVmax = maximum standardized uptake values, AML = angiomyolipoma
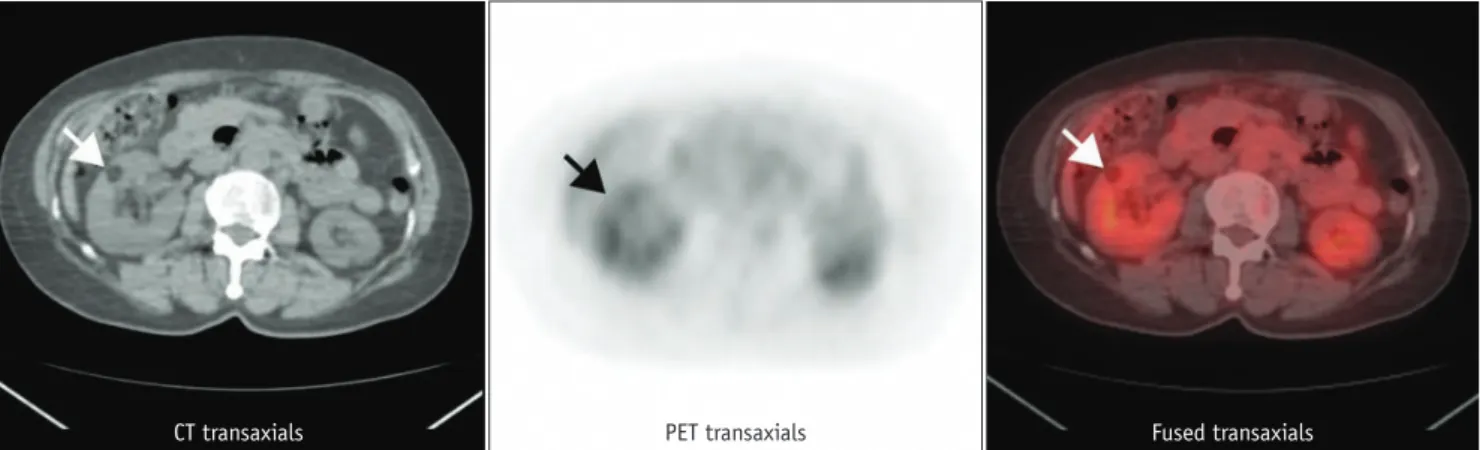
Fig. 1. 58-year-old hepatoma male patient with liver cirrhosis with massive ascites and angiomyolipoma (AML) in left kidney received whole body FDG PET/CT for detecting extrahepatic metastases (patient no. 10 in Table 1). Uptake of 18F-FDG in renal AML was lower than that of spine (arrows).
CT transaxials PET transaxials Fused transaxials
in a renal AML. Arnold and Myers (10) documented renal AML as metabolically active on FDG PET and falsely positive for renal cell carcinoma (RCC).
Diagnosis of renal AMLs relies on demonstrating
macroscopic fat within a lesion on a CT scan. Some studies report that renal AML may be distinguished from RCC on
images by identifying macroscopic fat (11). Davenport et al. reported that a threshold of -10 HU or lower enables accurate differentiation of renal AML from RCC on non- enhanced phase (12). Although demonstrable fat on a CT scan is highly suggestive of an AML, with differential diagnosis of a fat-containing tumor in the kidney, the
Fig. 3. 30-year-old male with renal cell carcinoma in right kidney (arrows). Maximum standardized uptake value on FDG PET is 5.43.
CT transaxials PET transaxials
Fused transaxials Contrast enhanced CT
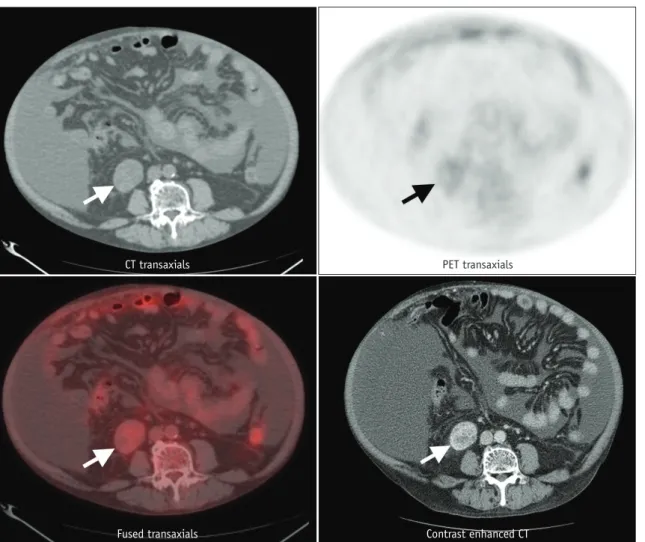
Fig. 2. 59-year-old female patient with angiomyolipoma (AML) in right kidney (patient no. 19 in Table 1). Uptake of 18F-FDG in renal AML was higher than that of spine but lower than hepatic activity (arrows).
CT transaxials PET transaxials Fused transaxials
possibility that it may be an RCC, lipoma, liposarcoma, and Wilms tumor needs to be considered. The most important differential is that of an RCC (5). The mean SUVmax value of pathologic confirmed primary RCC in Namura et al. (13) was 10.62 (range, 5.2 - 16.6), which was much higher than the SUVmax of renal AML in our study (mean, 1.25; range, 0.81 - 1.98).
Renal cell carcinoma accounts for 3.5% of all adult malignancies and 25% of patients with RCC will not survive (14). Bachor et al. (15) reported that the true positive rate of solid renal masses with confirmed RCC on PET is 77%. A pathologic confirmed RCC case with high SUVmax is shown in Figure 3. Kang et al. (16) found that on clinical use of PET in detection of RCC, FDG PET exhibited a sensitivity of 60% and specificity of 100% for primary RCC. Aide et al.
(17) reported that high false negative rates of diagnosis of RCC on FDG PET resulted in a sensitivity, specificity, and accuracy of 47%, 80%, and 51%, respectively. A false negative case of pathologic confirmed RCC is shown in Figure 4. One meta-analysis study suggested that FDG PET
can be useful in detecting recurrent or metastatic RCC, with 85.7% accuracy (18). The significant variability in the uptake of FDG by RCC is partly due to the excretion of FDG via the urinary tract.
Determinants of FDG accumulation include tumor blood flow, glucose transport, and glycolytic rate. All renal AMLs in this study demonstrated very low to low uptake on FDG PET and PET/CT imaging, suggesting that these tumors were not FDG-avid. AMLs are known to be hyper-vascular with an associated risk of spontaneous hemorrhage; however, there was no significant correlation between tumor size and SUVmax in this study. Neither tumor size nor blood flow explains the relative paucity of FDG activity in renal AML.
Studies report glycolytic enzyme expression to be under the influence of mammalian target of rapamycin (mTRO), and that treatment with rapamycin suppressed the rate of glycolysis (19). Jiang et al. (20) reported that mammalian rapamycin complex (mTROC1) is insufficient for increased glycolysis in tumors and that constitutive mTROC1 activity with negatively regulated glucose transporter trafficking.
Fig. 4. 58-year-old male with renal cell carcinoma in right kidney (arrows). Maximum standardized uptake value on FDG PET is 1.88.
CT transaxials
Fused transaxials
PET transaxials
Contrast enhanced CT
Their in vivo data indicated that constitutive activation of mTORC1 negatively regulates hexose transporter trafficking and glucose uptake. Their study’s 3 renal AML cases confirm the relevance of their findings in humans (20). The minimal FDG uptake in 21 renal AML patients in the present study may be explained by mTROC1 activity with negatively regulated glucose transporter trafficking and resulting in a reduction in glucose uptake in our 21 renal AMLs.
Conclusion
Renal AMLs demonstrated very low to low uptake on FDG PET and PET/CT imaging in this study. When a fat- containing tumor in the kidney is present on a CT scan, it is critical to differentiate an AML from a malignant tumor.
Based on the results of this study, the authors suggest that FDG PET or PET/CT imaging is a useful tool to differentiate a renal AML from a fat-containing malignant tumor.
REFERENCES
1. Mues AC, Palacios JM, Haramis G, Casazza C, Badani K, Gupta M, et al. Contemporary experience in the management of angiomyolipoma. J Endourol 2010;24:1883-1886 2. Kawashima A, Sandler CM, Ernst RD, Tamm EP, Goldman
SM, Fishman EK. CT evaluation of renovascular disease.
Radiographics 2000;20:1321-1340
3. Bissler JJ, Kingswood JC. Renal angiomyolipomata. Kidney Int 2004;66:924-934
4. Sherman JL, Hartman DS, Friedman AC, Madewell JE, Davis CJ, Goldman SM. Angiomyolipoma: computed tomographic- pathologic correlation of 17 cases. AJR Am J Roentgenol 1981;137:1221-1226
5. Halpenny D, Snow A, McNeill G, Torreggiani WC. The
radiological diagnosis and treatment of renal angiomyolipoma- current status. Clin Radiol 2010;65:99-108
6. Kochhar R, Brown RK, Wong CO, Dunnick NR, Frey KA, Manoharan P. Role of FDG PET/CT in imaging of renal lesions.
J Med Imaging Radiat Oncol 2010;54:347-357
7. Zapardiel I, Delafuente-Valero J, Bajo-Arenas JM. Renal angiomyolipoma during pregnancy: review of the literature.
Gynecol Obstet Invest 2011;72:217-219
8. Lhommel R, Annet L, Bol A, Gigot JF, Sempoux C, Mathieu
I, et al. PET scan with 11C-acetate for the imaging of liver masses: report of a false positive case. Eur J Nucl Med Mol Imaging 2005;32:629
9. Ho CL, Chan WK, Chen S, Leung YL, Cheng TK. Education and Imaging. Hepatobiliary and pancreatic: imaging for hepatic angiomyolipoma. J Gastroenterol Hepatol 2010;25:1589 10. Arnold RT, Myers DT. Visualization of renal angiomyolipoma on
F-18 FDG PET/CT. Clin Nucl Med 2009;34:539-540
11. Lemaitre L, Claudon M, Dubrulle F, Mazeman E. Imaging of angiomyolipomas. Semin Ultrasound CT MR 1997;18:100-114 12. Davenport MS, Neville AM, Ellis JH, Cohan RH, Chaudhry HS,
Leder RA. Diagnosis of renal angiomyolipoma with hounsfield unit thresholds: effect of size of region of interest and nephrographic phase imaging. Radiology 2011;260:158-165 13. Namura K, Minamimoto R, Yao M, Makiyama K, Murakami T, Sano F, et al. Impact of maximum standardized uptake value (SUVmax) evaluated by 18-Fluoro-2-deoxy-D-glucose positron emission tomography/computed tomography (18F-FDG- PET/CT) on survival for patients with advanced renal cell carcinoma: a preliminary report. BMC Cancer 2010;10:667 14. Jemal A, Siegel R, Ward E, Murray T, Xu J, Thun MJ. Cancer
statistics, 2007. CA Cancer J Clin 2007;57:43-66
15. Bachor R, Kotzerke J, Gottfried HW, Brändle E, Reske SN, Hautmann R. [Positron emission tomography in diagnosis of renal cell carcinoma]. Urologe A 1996;35:146-150
16. Kang DE, White RL Jr, Zuger JH, Sasser HC, Teigland CM.
Clinical use of fluorodeoxyglucose F 18 positron emission tomography for detection of renal cell carcinoma. J Urol 2004;171:1806-1809
17. Aide N, Cappele O, Bottet P, Bensadoun H, Regeasse A, Comoz F, et al. Efficiency of [(18)F]FDG PET in characterising renal cancer and detecting distant metastases: a comparison with CT. Eur J Nucl Med Mol Imaging 2003;30:1236-1245
18. Martínez de Llano SR, Delgado-Bolton RC, Jiménez-Vicioso A, Pérez-Castejón MJ, Carreras Delgado JL, Ramos E, et al.
[Meta-analysis of the diagnostic performance of 18F-FDG PET in renal cell carcinoma]. Rev Esp Med Nucl 2007;26:19-29 19. Edinger AL, Linardic CM, Chiang GG, Thompson CB, Abraham
RT. Differential effects of rapamycin on mammalian target of rapamycin signaling functions in mammalian cells. Cancer Res 2003;63:8451-8460
20. Jiang X, Kenerson H, Aicher L, Miyaoka R, Eary J, Bissler J, et al. The tuberous sclerosis complex regulates trafficking of glucose transporters and glucose uptake. Am J Pathol 2008;172:1748-1756