ABSTRACT
Purpose: The tumor microenvironment is known to be associated with the metabolic activity
of cancer cells and local immune reactions. We hypothesized that glucose metabolism measured by 2-deoxy-2-(
18F)fluoro-D-glucose (
18F-FDG) positron emission tomography (PET)-computed tomography (CT) (
18F-FDG PET-CT) would be associated with local immune responses evaluated according to the presence of tumor infiltrating lymphocytes (TILs).
Materials and Methods: We retrospectively reviewed 56 patients who underwent 18
F-FDG PET-CT prior to gastrectomy. In resected tumor specimens, TIL subsets, including cluster of differentiation (CD) 3, CD4, CD8, Forkhead box P3 (Foxp3), and granzyme B, were subjected to immunohistochemical analysis. The prognostic nutritional index (PNI) was calculated as: (10×serum albumin value)+(0.005×peripheral lymphocyte counts). Additionally, the maximum standard uptake value (SUV
max) was calculated to evaluate the metabolic activity of cancer cells.
Results: The SUVmax
was positively correlated with larger tumor size (R=0.293; P=0.029) and negatively correlated with PNI (R=−0.407; P=0.002). A higher SUV
maxshowed a marginal association with higher CD3 (+) T lymphocyte counts (R=0.227; P=0.092) and a significant association with higher Foxp3 (+) T lymphocyte counts (R=0.431; P=0.009). No other clinicopathological characteristics were associated with SUV
maxor TILs. Survival analysis, however, indicated that neither SUV
maxnor Foxp3 held prognostic significance.
Conclusions: FDG uptake on PET-CT could be associated with TILs, especially regulatory
T cells, in gastric cancer. This finding may suggest that PET-CT could be of use as a non- invasive tool for monitoring the tumor microenvironment in patients with gastric cancer.
Keywords:
Fluorodeoxyglucose F18; PET-CT; Tumor infiltrating lymphocytes;
Regulatory T-cells; Tumor microenvironment
INTRODUCTION
Gastric cancer is the fourth most common cancer worldwide, and the third leading cause of cancer-related death [1]. Despite improvements in diagnostic methods and therapeutic strategies, the prognosis of gastric cancer is still determined by cancer stage alone [2].
However, accurate tumor staging can only be achieved after surgical resection.
Original Article
Received: Dec 19, 2017 Revised: Dec 22, 2017 Accepted: Dec 22, 2017 Correspondence to Hyoung-Il Kim
Department of Surgery, Yonsei University College of Medicine, Yonsei University Health System, 50-1 Yonsei-ro, Seodaemun-gu, Seoul 03722, Korea.
E-mail: [email protected]
Copyright © 2017. Korean Gastric Cancer Association
This is an Open Access article distributed under the terms of the Creative Commons Attribution Non-Commercial License (https://
creativecommons.org/licenses/by-nc/4.0) which permits unrestricted noncommercial use, distribution, and reproduction in any medium, provided the original work is properly cited.
ORCID iDs Seungho Lee
https://orcid.org/0000-0001-6958-7581 Seohee Choi
https://orcid.org/0000-0002-9384-8646 Sang Yong Kim
https://orcid.org/0000-0001-6066-849X Hyoung-Il Kim
https://orcid.org/0000-0002-6134-4523 Funding
This work was supported by the National Research Foundation of Korea (NRF) grant funded by the Korean government (MSIP) (No.
2016R1A2B4014984).
Seungho Lee
1, Seohee Choi
1, Sang Yong Kim
2,3, Mi Jin Yun
4, Hyoung-Il Kim
1,2,31Department of Surgery, Yonsei University College of Medicine, Yonsei University Health System, Seoul, Korea
2Medical Research Center, Yonsei University College of Medicine, Seoul, Korea
3 Open NBI Convergence Technology Research Laboratory, Severance Hospital, Yonsei University Health System, Seoul, Korea
4Department of Nuclear Medicine, Yonsei University College of Medicine, Seoul, Korea
Potential Utility of FDG PET-CT as a
Non-invasive Tool for Monitoring Local
Immune Responses
Author Contributions
Conceptualization: Y.M.J., K.H.I.; Data curation: L.S., C.S., K.S.Y.; Formal analysis:
L.S., K.H.I.; Funding acquisition: K.H.I.;
Investigation: Y.M.J., K.H.I.; Methodology:
L.S., C.S., K.S.Y.; Project administration: K.H.I.;
Supervision: Y.M.J., K.H.I.; Writing - original draft: L.S.; Writing - review & editing: K.H.I.
Conflict of Interest
No potential conflict of interest relevant to this article was reported.
To predict prognosis in patients with cancer, 2-deoxy-2-(
18F)fluoro-D-glucose (
18F-FDG)-positron emission tomography (PET)-computed tomography (CT) (
18F-FDG PET-CT) has been widely used [3-5]. In PET-CT analysis, increased cell metabolic activity is reflected by increased FDG uptake.
This mechanism of action allows PET-CT to be used in diagnosing cancer severity [3,6] and in predicting response to preoperative chemotherapy [7]. In this respect, the metabolic activity of cancers can be considered an important factor affecting tumor biology and patient prognosis.
In gastric cancer, however, the sensitivity and specificity of
18F-FDG PET-CT have been found to vary according to histologic type [8], limiting the role of this modality in the detection of primary tumors [9]. Notwithstanding, several studies have reported that increased FDG uptake by primary tumors and metastatic lymph nodes is associated with poor prognosis in gastric cancer [10-12].
Recently, the tumor microenvironment has emerged as another aspect important in the further understanding of tumor biology [13]. In particular, the tumor microenvironment has been found to play an essential role in the metabolic activity of cancers [14]. In this respect, the potential utility of
18F-FDG PET-CT as an indirect tool for monitoring the tumor microenvironment has been suggested [14-17]. Additional factors associated with the tumor microenvironment are tumor infiltrating lymphocytes (TILs) [18-20]. TILs are considered prognostic factors in local anti-tumor immunity and oncologic outcomes [21-24]. Indeed, in gastric cancer, several studies have reported a relationship between subsets of TILs and oncologic outcomes [22,25,26]. Interestingly, regulation of TIL subsets and the function of T cells have been shown to be influenced by the tumor microenvironment [18,19,27,28].
We hypothesized that the tumor microenvironment would be associated with the metabolic activity of cancer cells and would contribute to local immune responses in gastric cancer.
Accordingly, we explored associations between FDG uptake on PET-CT and TILs in patients with gastric cancer.
MATERIALS AND METHODS
Patients
The present study included 56 patients with gastric cancer who underwent surgical resection and
18F-FDG PET-CT for staging workup at Severance Hospital, Yonsei University College of Medicine between June 2005 and December 2010. The medical records of these patients were retrospectively reviewed, and clinicopathological data were collected, including age, sex, tumor size, histologic type, pathologic T classification, and N classification. Tumor staging and pathologic grading were based on the American Joint Committee on Cancer (AJCC), seventh edition [29]. We obtained PET-CT workup and laboratory data, including serum albumin levels and lymphocyte counts, from baseline workup conducted within 2 months prior to surgery. The prognostic nutritional index (PNI) was calculated as follows [30]:
PNI=(10×serum albumin value [g/dL])+(0.005×peripheral lymphocyte count [number/mm
3]) This study was approved by the Institutional Review Board of Severance Hospital, Yonsei University Health System (4-2017-0824).
18
F-FDG PET-CT imaging
18
F-FDG PET-CT scans were performed with a PET-CT scanner (Discovery STe; GE Healthcare,
Little Chalfont, UK; or Biograph TruePoint 40; Siemens Healthcare, Erlangen, Germany). All
patients fasted for at least 6 hours before undergoing PET-CT scan, and a dose of 5.5 MBq/
kg of
18F-FDG was intravenously injected 60 minutes prior to PET-CT. CT scans were initially performed at 30 mA and 130 kVp without contrast enhancement. After the CT scan was complete, a PET scan was performed with an acquisition time of 3 minutes per bed position in 3-dimensional mode. PET images were reconstructed using ordered subset expectation maximization with an attenuation correction.
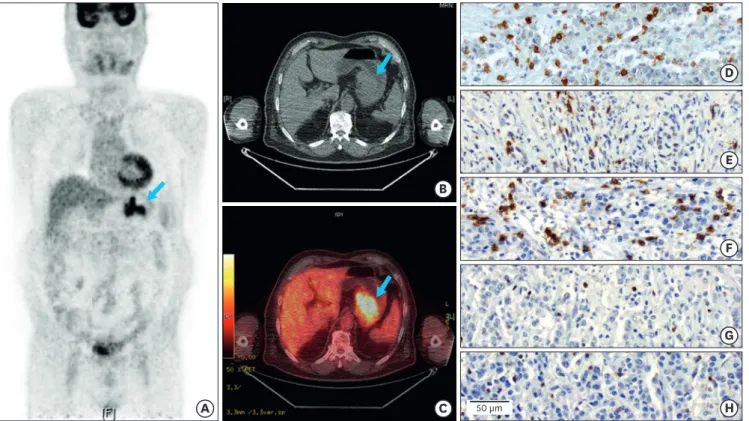
18F-FDG PET-CT images were reviewed by nuclear medicine physicians (Fig. 1A). The maximum standard uptake value (SUV
max) on PET images was measured using volume viewer software (MIM-6.4; MIM software Inc., Cleveland, OH, USA). Each tumor was examined with a spherical-shaped volume of interest (VOI) that included the entire lesion in the axial, sagittal, and coronal planes. Using CT images,
18F-FDG uptake of normal organs, such as the brain, heart, liver, kidney, and small bowel was not included in the VOI. The SUV
maxof the VOI was calculated as:
SUV
maxof the VOI=(decay corrected activity/tissue volume)/(injected dose/body weight) Immunohistochemistry of TILs
Immunohistochemical staining was performed on formalin-fixed, paraffin-embedded gastric cancer tissue sections. We used primary monoclonal antibodies for TIL subsets, including cluster of differentiation (CD) 3 (T lymphocytes, 1:100; Lab Vision Corp., Fremont, CA, USA; Fig. 1B), CD4 (helper T lymphocytes, 1:100; Novocastra Laboratories Ltd., Newcastle Upon Tyne, UK; Fig. 1C), CD8 (cytotoxic T lymphocytes, 1:100 Novocastra Laboratories Ltd.; Fig. 1D), Forkhead box P3 (Foxp3) (regulatory T lymphocytes, 1:100, ab20034; Abcam, A
B
C
50 µmD
E
F
G
H
Fig. 1. Representative images of 18F-FDG PET-CT and immunohistochemical staining for TILs. (A) Whole-body 18F-FDG PET image demonstrates increased FDG uptake in stomach. (B, C) Axial CT and fused images indicate primary gastric cancer. (D-H) Immunohistochemical analysis of TILs, including CD3, CD4, CD8, Foxp3, and granzyme B.
18F-FDG = 2-deoxy-2-(18F)fluoro-D-glucose; PET = positron emitting tomography; CT = computed tomography; TIL = tumor infiltrating lymphocyte; CD = cluster of differentiation; Foxp3 = Forkhead box P3.
Cambridge, UK; Fig. 1E), and granzyme B (activated cytotoxic T lymphocytes, 1:100; Lab Vision Corp.; Fig. 1F). Stained slides were reviewed by an experienced pathologist who was blinded to patient data. Precise immunohistochemical staining methods and quantification of TILs were described in our previous study [22].
Statistical analysis
Categorical data are expressed as numbers with percentages, and continuous variables are expressed as means±standard deviations. Continuous variables were analyzed with analysis of variance (ANOVA). Correlation analyses were performed with Spearman's correlation analysis test. P-values less than 0.05 were considered statistically significant. Overall survival (OS) was compared with Kaplan-Meier analysis and the log-rank test. All statistical analyses were performed with SPSS software, version 23 (IBM Corporation, Chicago, IL, USA).
RESULTS
Patients
Clinicopathologic characteristics of the patients are shown in Table 1. Fifty-six patients with gastric cancer who underwent radical resection were included, including 36 men and 20 women. The mean tumor size was 57.6 mm. The majority of patients had poorly differentiated cancer (44.6%), T3 (30.4%), and T4 (32.1%) tumors, N0 tumors (33.9%), and stage III (37.5%) tumors. The mean SUV
maxwas 7.59, and the mean numbers of patients with CD3, CD4, CD8, Foxp3, and granzyme B TILs were 173.1, 104.2, 84.4, 18.0, and 19.9, respectively.
SUV
maxon PET-CT and associated characteristics
In correlation analysis of clinicopathological characteristics, SUV
maxwas not associated with age, sex, histologic subtype, N classification, or final stage. A high SUV
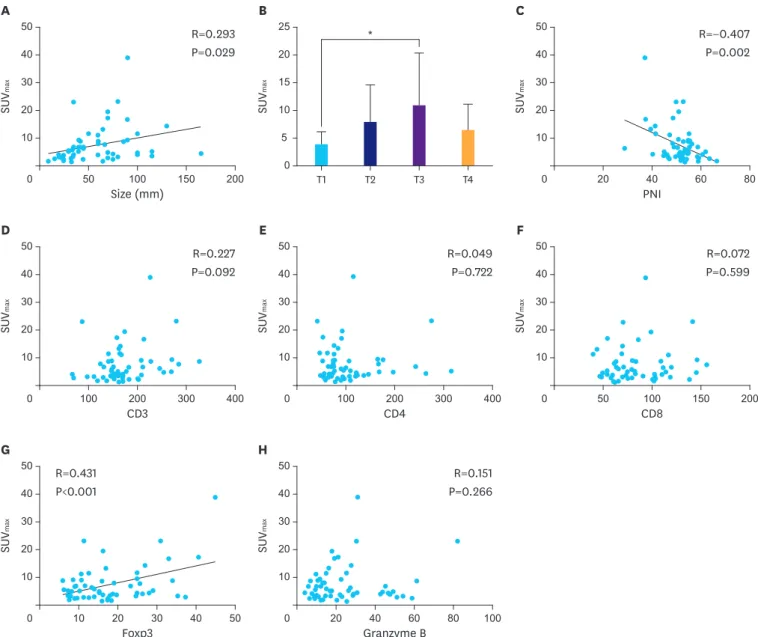
maxvalue was associated with larger tumor size (Fig. 2A, R=0.293; P=0.029) and advanced T classification (Fig. 2B, P=0.039), and showed a negative correlation with PNI (Fig. 2C, R=−0.407; P=0.002). In correlation analysis of TILs (Fig. 2D-H), SUV
maxshowed a marginal association with CD3 (+) lymphocytes (Fig. 2D, R=0.227; P<0.092) and a significant association with Foxp3 (+) regulatory T cell counts (Fig. 2G, R=0.431; P<0.001). CD4, CD8, and granzyme B were not associated with SUV
max.
Foxp3 (+)TILs and associated characteristics
Because only Foxp3 was correlated with SUV
max, we performed further investigation of Foxp3 and clinicopathological characteristics. Although Foxp3 and SUV
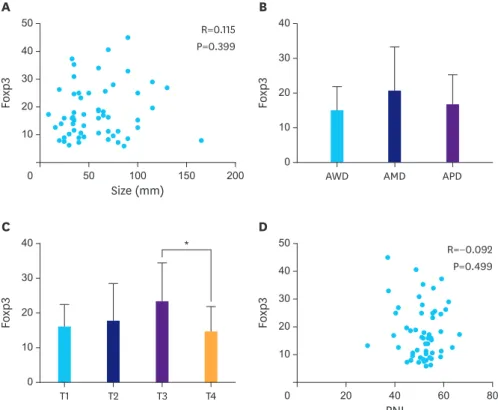
maxwere significantly correlated, Foxp3 counts showed poor correlation with clinicopathological characteristics, as shown in
Fig. 3. Notably, however, Foxp3 counts were highest in patients with T3 disease and lowest inthose with T4 disease (Fig. 3C, mean Foxp3 count=23.27 and 14.65, respectively, P=0.033).
Survival analysis
No OS differences were found between the groups with high and low SUV
max(Fig. 4A) or between the high and low Foxp3 (+) T cell groups (Fig. 4B).
DISCUSSION
In this study, we used SUV
maxon
18F-FDG PET-CT to evaluate the metabolic activity of gastric
cancer tumors and TIL subsets as a reflection of local immune responses. SUV
maxshowed positive
correlations with tumor size and regulatory T lymphocytes, and a negative correlation with PNI. We noted no prognostic significance for SUV
maxand regulatory T lymphocytes in the present study.
Standard uptake value is the ratio between
18F-FDG concentrations in a tumor and those throughout the entire body, and SUV
maxis the maximum concentration of
18F-FDG in an organ of interest. High SUV
maxgenerally indicates increased cancer metabolism, and has been shown to be associated with aggressive behavior, advanced disease status, and poor oncologic outcomes [5,11,31,32]. In the present study, we identified associations among tumor size, SUV
max, and regulatory T lymphocytes. The observed association between large tumor size and high SUV
maxcorroborates the findings of a previous report on gastric cancer [16]. To the best of our knowledge, however, we are the first to report a strong association between SUV
maxand TILs: this relationship had never previously been explored in gastric cancer, and has rarely been studied in other solid cancers [33].
Hypothetically, increased glucose uptake in cancerous tissue would likely be associated with changes in the tumor microenvironment, reflecting tumor proliferation and increased
Table 1. Patient characteristicsCharacteristics Value
Age (yr) 59.3±12.5
Sex
Male 36 (64.3)
Female 20 (35.7)
Tumor size (mm) 57.6±31.7
Histologic subtype
AWD 8 (14.3)
AMD 14 (25.0)
APD 25 (44.6)
Other* 9 (16.1)
Pathologic T classification
T1 13 (23.2)
T2 8 (14.3)
T3 17 (30.4)
T4 18 (32.1)
Pathologic N classification
N0 19 (33.9)
N1 13 (23.2)
N2 9 (16.1)
N3 15 (26.8)
TNM stage
I 13 (23.2)
II 17 (30.4)
III 21 (37.5)
IV 5 (8.9)
PNI 51.4±6.9
SUVmax 7.6±6.7
TIL subset
CD3 173.1±52.0
CD4 104.2±59.5
CD8 84.4±28.5
Foxp3 18.0±9.5
Granzyme B 19.9±19.1
Foxp3/CD4 (%) 21.9±16.6
Data are shown as mean±standard deviation or number (%).
AWD = well-differentiated; AMD = moderately differentiated; APD = poorly differentiated; TNM = tumor, node, and metastasis; PNI = prognostic nutritional index; SUVmax = maximum standard uptake value; TIL = tumor infiltrating lymphocyte; CD = cluster of differentiation; Foxp3 = Forkhead box P3.
*Mucinous-1, signet-ring cell cancer-1, and undifferentiated-7.
glucose metabolism [34,35]. These changes are also known to influence regulation of TIL subsets and the function of T cells [18,19,27,28]. Among the many factors in the tumor microenvironment that modulate the differentiation and function of TILs [36-39], the most relevant connection between SUV
maxand Foxp3 could be hypoxia and acidic conditions.
Regarding the former, FDG uptake is upregulated in hypoxic conditions [17,40,41], and it is well-known that hypoxia modulates immune responses in the tumor microenvironment [36,42] and promotes proliferation of regulatory T cells [18,43]. In relation to the latter, high lactate concentrations in the tumor microenvironment have been found to block lactate export in T cells, thereby perturbing the metabolism and function of these cells [27]. Although our study did not explore the mechanism linking high FDG uptake and high
20 40 60 80
PNI R=0.293
P=0.029
R=−0.407 P=0.002
R=0.227 P=0.092
R=0.072 P=0.599 R=0.049
P=0.722
R=0.431 P<0.001
R=0.151 P=0.266
C
SUVmax
0
B
SUVmax
A
SUVmax 30
50 40
20 10
30 50 40
20 10 15
25 20
10 5
0
50 100 150 200
Size (mm)
0
50 100 150 200
CD8
F
SUVmax
0
E
SUVmax
D
SUVmax 30
50 40
20 10
30 50 40
20 10
100 200 300 400
0 CD4
100 200 300 400
0 CD3
H
SUVmax
G
SUVmax 30
50 40
20 10
30 50 40
20 10
30 50 40
20 10
40 60 80 100
Granzyme B
0
20 30 40 50
Foxp3 20
10 0
T1 T2 T3 T4
*
Fig. 2. SUVmax on PET-CT and associated characteristics. (A) Correlation analysis of SUVmax and tumor size. (B) SUVmax in comparison to T classification. (C-H) Correlation analysis of SUVmax and TIL subsets, including CD3, CD4, CD8, Foxp3, and granzyme B. Significant correlation shown only between Foxp3 and SUVmax
(R=0.431, P<0.001).
SUVmax = maximum standard uptake value; PET = positron emitting tomography; CT = computed tomography; TIL = tumor infiltrating lymphocyte; CD = cluster of differentiation; Foxp3 = Forkhead box P3.
*P<0.05.
regulatory T lymphocyte infiltration, our results suggest that
18F-FDG PET-CT could be of use as a potential diagnostic modality for assessing the tumor-immune microenvironment and as a predictive tool for identifying patients who might benefit from regulatory T cell depleting immunotherapy.
R=0.115 P=0.399
R=−0.092 P=0.499
AWD AMD APD
B
Foxp3
30 40
20 10 0
A
Foxp3 30
50 40
20 10
50 100 150 200
Size (mm)
0
20 40 60 80
PNI
D
Foxp3 30
40 50
20 10 0
C
Foxp3
30 40
20 10
T1 T2 T3 T4
*
0
Fig. 3. Foxp3 (+) TILs and associated characteristics. (A) Correlation analysis of tumor size and Foxp3.
(B, C) Comparison of Foxp3 according to histologic grade of gastric cancer and T classification. No significant associations among histologic grade and T classification were noted, except between T3 and T4. (D) Correlation analysis of PNI and Foxp3.
Foxp3 = Forkhead box P3; TIL = tumor infiltrating lymphocyte; PNI = prognostic nutritional index; AWD = well- differentiated; AMD = moderately differentiated; APD = poorly differentiated.
*P<0.05.
Time (mo)
0.8
0.6
0.4
0 20 40 60 80
OS
1.0
0.2
100
Time (mo)
0.8
0.6
0.4
0 20 40 60 80
OS
1.0
0.2
100
P=0.425 P=0.767
Low SUVmax
High SUVmax
Low Foxp3 High Foxp3
Fig. 4. Kaplan-Meier analysis according to SUVmax and Foxp3 positivity. (A) OS for the high SUVmax and low SUVmax groups. A median OS of 89 months was recorded in the low SUVmax group. However, a median OS was not defined in the high SUVmax group (P=0.425). (B) OS between high Foxp3 and low Foxp3 groups. The median OS in the low Foxp3 group was 89 months, while the median OS in the high Foxp3 group was undefined (P=0.767). The differences between the groups were calculated using the log-rank test.
SUVmax = maximum standard uptake value; Foxp3 = Forkhead box P3; OS = overall survival.
The present study has several limitations. First, this was a retrospective observational study of a small number of cases. As a potential result thereof, our study identified no survival differences between the groups with high and low SUV
maxand between the high and low Foxp3 (+) T cell groups, despite the fact that SUV
maxand Foxp3 are well-known prognostic factors in gastric cancer [11,22]. Second, the biologic mechanisms underlying associations between higher numbers of regulatory TILs and high FDG uptake were not assessed. Nonetheless, the strength of the present study is that it is the first to evaluate associations among
18F-FDG uptake on PET-CT, clinicopathological characteristics, and TILs in gastric cancer.
In conclusion, the present study highlights a novel association between SUV
maxon
18F-FDG PET-CT and regulatory T cells in gastric cancer, suggesting that the metabolic activity of gastric cancer cells could be related to local immune responses. Accordingly, this study provides the rationale for further studies of the role of
18F-FDG PET-CT as a non-invasive tool for monitoring cancer metabolism and immune responses in the tumor microenvironment of gastric and other cancers.
REFERENCES
1. Torre LA, Bray F, Siegel RL, Ferlay J, Lortet-Tieulent J, Jemal A. Global cancer statistics, 2012. CA Cancer J Clin 2015;65:87-108.
PUBMED | CROSSREF
2. Shiraishi N, Inomata M, Osawa N, Yasuda K, Adachi Y, Kitano S. Early and late recurrence after gastrectomy for gastric carcinoma. Univariate and multivariate analyses. Cancer 2000;89:255-261.
PUBMED | CROSSREF
3. Bomanji JB, Costa DC, Ell PJ. Clinical role of positron emission tomography in oncology. Lancet Oncol 2001;2:157-164.
PUBMED | CROSSREF
4. Huang Y, Feng M, He Q, Yin J, Xu P, Jiang Q, et al. Prognostic value of pretreatment 18F-FDG PET-CT for nasopharyngeal carcinoma patients. Medicine (Baltimore) 2017;96:e6721.
PUBMED | CROSSREF
5. Kim YH, Lee JA, Baek JM, Sung GY, Lee DS, Won JM. The clinical significance of standardized uptake value in breast cancer measured using 18F-fluorodeoxyglucose positron emission tomography/computed tomography. Nucl Med Commun 2015;36:790-794.
PUBMED | CROSSREF
6. Pauwels EK, Ribeiro MJ, Stoot JH, McCready VR, Bourguignon M, Mazière B. FDG accumulation and tumor biology. Nucl Med Biol 1998;25:317-322.
PUBMED | CROSSREF
7. Ott K, Fink U, Becker K, Stahl A, Dittler HJ, Busch R, et al. Prediction of response to preoperative chemotherapy in gastric carcinoma by metabolic imaging: results of a prospective trial. J Clin Oncol 2003;21:4604-4610.
PUBMED | CROSSREF
8. Yun M. Imaging of gastric cancer metabolism using 18 F-FDG PET/CT. J Gastric Cancer 2014;14:1-6.
PUBMED | CROSSREF
9. Dassen AE, Lips DJ, Hoekstra CJ, Pruijt JF, Bosscha K. FDG-PET has no definite role in preoperative imaging in gastric cancer. Eur J Surg Oncol 2009;35:449-455.
PUBMED | CROSSREF
10. Song BI, Kim HW, Won KS, Ryu SW, Sohn SS, Kang YN. Preoperative standardized uptake value of metastatic lymph nodes measured by 18F-FDG PET/CT improves the prediction of prognosis in gastric cancer. Medicine (Baltimore) 2015;94:e1037.
PUBMED | CROSSREF
11. Wu Z, Zhao J, Gao P, Song Y, Sun J, Chen X, et al. Prognostic value of pretreatment standardized uptake value of F-18-fluorodeoxyglucose PET in patients with gastric cancer: a meta-analysis. BMC Cancer 2017;17:275.
PUBMED | CROSSREF
12. Park JC, Lee JH, Cheoi K, Chung H, Yun MJ, Lee H, et al. Predictive value of pretreatment metabolic activity measured by fluorodeoxyglucose positron emission tomography in patients with metastatic advanced gastric cancer: the maximal SUV of the stomach is a prognostic factor. Eur J Nucl Med Mol Imaging 2012;39:1107-1116.
PUBMED | CROSSREF
13. Hui L, Chen Y. Tumor microenvironment: Sanctuary of the devil. Cancer Lett 2015;368:7-13.
PUBMED | CROSSREF
14. Cairns RA, Harris IS, Mak TW. Regulation of cancer cell metabolism. Nat Rev Cancer 2011;11:85-95.
PUBMED | CROSSREF
15. Kaira K, Serizawa M, Koh Y, Takahashi T, Yamaguchi A, Hanaoka H, et al. Biological significance of 18F-FDG uptake on PET in patients with non-small-cell lung cancer. Lung Cancer 2014;83:197-204.
PUBMED | CROSSREF
16. Takebayashi R, Izuishi K, Yamamoto Y, Kameyama R, Mori H, Masaki T, et al. [18F]Fluorodeoxyglucose accumulation as a biological marker of hypoxic status but not glucose transport ability in gastric cancer. J Exp Clin Cancer Res 2013;32:34.
PUBMED | CROSSREF
17. van Baardwijk A, Dooms C, van Suylen RJ, Verbeken E, Hochstenbag M, Dehing-Oberije C, et al. The maximum uptake of (18)F-deoxyglucose on positron emission tomography scan correlates with survival, hypoxia inducible factor-1alpha and GLUT-1 in non-small cell lung cancer. Eur J Cancer 2007;43:1392-1398.
PUBMED | CROSSREF
18. Clambey ET, McNamee EN, Westrich JA, Glover LE, Campbell EL, Jedlicka P, et al. Hypoxia-inducible factor-1 alpha-dependent induction of FoxP3 drives regulatory T-cell abundance and function during inflammatory hypoxia of the mucosa. Proc Natl Acad Sci U S A 2012;109:E2784-E2793.
PUBMED | CROSSREF
19. Deng B, Zhu JM, Wang Y, Liu TT, Ding YB, Xiao WM, et al. Intratumor hypoxia promotes immune tolerance by inducing regulatory T cells via TGF-β1 in gastric cancer. PLoS One 2013;8:e63777.
PUBMED | CROSSREF
20. Kumar V, Gabrilovich DI. Hypoxia-inducible factors in regulation of immune responses in tumour microenvironment. Immunology 2014;143:512-519.
PUBMED | CROSSREF
21. Clemente CG, Mihm MC Jr, Bufalino R, Zurrida S, Collini P, Cascinelli N. Prognostic value of tumor infiltrating lymphocytes in the vertical growth phase of primary cutaneous melanoma. Cancer 1996;77:1303-1310.
PUBMED | CROSSREF
22. Kim HI, Kim H, Cho HW, Kim SY, Song KJ, Hyung WJ, et al. The ratio of intra-tumoral regulatory T cells (Foxp3+)/helper T cells (CD4+) is a prognostic factor and associated with recurrence pattern in gastric cardia cancer. J Surg Oncol 2011;104:728-733.
PUBMED | CROSSREF
23. Zhuang Y, Peng LS, Zhao YL, Shi Y, Mao XH, Guo G, et al. Increased intratumoral IL-22-producing CD4(+) T cells and Th22 cells correlate with gastric cancer progression and predict poor patient survival. Cancer Immunol Immunother 2012;61:1965-1975.
PUBMED | CROSSREF
24. Peng LS, Zhuang Y, Shi Y, Zhao YL, Wang TT, Chen N, et al. Increased tumor-infiltrating CD8(+)Foxp3(+) T lymphocytes are associated with tumor progression in human gastric cancer. Cancer Immunol Immunother 2012;61:2183-2192.
PUBMED | CROSSREF
25. Choi HS, Ha SY, Kim HM, Ahn SM, Kang MS, Kim KM, et al. The prognostic effects of tumor infiltrating regulatory T cells and myeloid derived suppressor cells assessed by multicolor flow cytometry in gastric cancer patients. Oncotarget 2016;7:7940-7951.
PUBMED | CROSSREF
26. Kim KJ, Lee KS, Cho HJ, Kim YH, Yang HK, Kim WH, et al. Prognostic implications of tumor-infiltrating FoxP3+ regulatory T cells and CD8+ cytotoxic T cells in microsatellite-unstable gastric cancers. Hum Pathol 2014;45:285-293.
PUBMED | CROSSREF
27. Fischer K, Hoffmann P, Voelkl S, Meidenbauer N, Ammer J, Edinger M, et al. Inhibitory effect of tumor cell-derived lactic acid on human T cells. Blood 2007;109:3812-3819.
PUBMED | CROSSREF
28. Chang CH, Qiu J, O'Sullivan D, Buck MD, Noguchi T, Curtis JD, et al. Metabolic competition in the tumor microenvironment is a driver of cancer progression. Cell 2015;162:1229-1241.
PUBMED | CROSSREF
29. Stomach. In: Compton CC, Byrd DR, Garcia-Aguilar J, Kurtzman SH, Olawaiye A, Washington MK, eds.
AJCC Cancer Staging Atlas: a Companion to the Seventh Editions of the AJCC Cancer Staging Manual and Handbook. 2nd ed. New York (NY): Springer, 2012:143-153.
30. Lee JY, Kim HI, Kim YN, Hong JH, Alshomimi S, An JY, et al. Clinical significance of the prognostic nutritional index for predicting short- and long-term surgical outcomes after gastrectomy: a retrospective analysis of 7781 gastric cancer patients. Medicine (Baltimore) 2016;95:e3539.
PUBMED | CROSSREF
31. Sunnetcioglu A, Arısoy A, Demir Y, Ekin S, Dogan E. Associations between the standardized uptake value of (18)F-FDG PET/CT and demographic, clinical, pathological, radiological factors in lung cancer. Int J Clin Exp Med 2015;8:15794-15800.
PUBMED
32. Hsu HH, Ko KH, Chou YC, Lin LF, Tsai WC, Lee SC, et al. SUVmax and tumor size predict surgical outcome of synchronous multiple primary lung cancers. Medicine (Baltimore) 2016;95:e2351.
PUBMED | CROSSREF
33. Lopci E, Toschi L, Grizzi F, Rahal D, Olivari L, Castino GF, et al. Correlation of metabolic information on FDG-PET with tissue expression of immune markers in patients with non-small cell lung cancer (NSCLC) who are candidates for upfront surgery. Eur J Nucl Med Mol Imaging 2016;43:1954-1961.
PUBMED | CROSSREF
34. Vander Heiden MG, Cantley LC, Thompson CB. Understanding the Warburg effect: the metabolic requirements of cell proliferation. Science 2009;324:1029-1033.
PUBMED | CROSSREF
35. Avril N. GLUT1 expression in tissue and (18)F-FDG uptake. J Nucl Med 2004;45:930-932.
PUBMED
36. Labiano S, Palazon A, Melero I. Immune response regulation in the tumor microenvironment by hypoxia.
Semin Oncol 2015;42:378-386.
PUBMED | CROSSREF
37. Renner K, Singer K, Koehl GE, Geissler EK, Peter K, Siska PJ, et al. Metabolic hallmarks of tumor and immune cells in the tumor microenvironment. Front Immunol 2017;8:248.
PUBMED | CROSSREF
38. Sinicrope FA, Rego RL, Garrity-Park MM, Foster NR, Sargent DJ, Goldberg RM, et al. Alterations in cell proliferation and apoptosis in colon cancers with microsatellite instability. Int J Cancer 2007;120:1232-1238.
PUBMED | CROSSREF
39. Sukumar M, Roychoudhuri R, Restifo NP. Nutrient competition: a new axis of tumor immunosuppression. Cell 2015;162:1206-1208.
PUBMED | CROSSREF
40. Li XF, Du Y, Ma Y, Postel GC, Civelek AC. (18)F-fluorodeoxyglucose uptake and tumor hypoxia: revisit (18) f-fluorodeoxyglucose in oncology application. Transl Oncol 2014;7:240-247.
PUBMED | CROSSREF
41. Jeong YJ, Jung JW, Cho YY, Park SH, Oh HK, Kang S. Correlation of hypoxia inducible transcription factor in breast cancer and SUVmax of F-18 FDG PET/CT. Nucl Med Rev Cent East Eur 2017;20:32-38.
PUBMED | CROSSREF
42. Duechler M, Peczek L, Szubert M, Suzin J. Influence of hypoxia inducible factors on the immune microenvironment in ovarian cancer. Anticancer Res 2014;34:2811-2819.
PUBMED
43. Facciabene A, Peng X, Hagemann IS, Balint K, Barchetti A, Wang LP, et al. Tumour hypoxia promotes tolerance and angiogenesis via CCL28 and T(reg) cells. Nature 2011;475:226-230.
PUBMED | CROSSREF