https://doi.org/10.5468/ogs.19196 pISSN 2287-8572 · eISSN 2287-8580
Introduction
Anemia represents a global problem that affects people from all walks of life in all societies. Around a quarter of the world’s population suffers from this disease. The problem is not constrained to the medical sector, and its roots can be traced to education, demography, and nutrition. Iron defi- ciency accounts for about half of the world’s anemia. Anemia has caused 19.7 million years of life adapted with disability.
The average annual economic loss incurred as a result of iron deficiency anemia in 10 developing countries is estimated at approximately $16.78 per capita or 4% of gross domestic
Prevalence of iron deficiency anemia in Asian female population and human development index (HDI): an ecological study
Elham Goodarzi, MSc 1 , Reza Beiranvand, MSc 2 , Hasan Naemi, MSc 3 , Isan Darvishi, MSc 4 , Zaher Khazaei, MSc 5
1
Social Determinants of Health Research Center, Lorestan University of Medical Sciences, Khorramabad;
2Student Research Committee, Dezful University of Medical Sciences, Dezful;
3Iranian Research Center on Healthy Aging, Sabzevar University of Medical Sciences, Sabzevar;
4Department of Operating Room, School of Nursing and Midwifery, Shahrekord University of Medical Science, Shahrekord;
5Department of Epidemiology, School of Public Health, Ilam University of Medical Sciences, Ilam, Iran
Objective
Anemia is a major problem in developing countries, the purpose of the present study was to investigate the relationship between the human development index (HDI) and the prevalence of anemia among Asian women.
Methods
This was a descriptive-analytic ecological study. The study analyzed data including HDI and prevalence of anemia extracted from the World Bank. The correlation coefficient and analysis of variance were used for data analysis. The significance level was considered to be less than 0.05. Analyses were performed using Stata-14 software.
Results
The results revealed that the prevalence of anemia in women of reproductive age (R=−0.626, P<0.001), pregnant women (R=−0.576, P<0.001) and non-pregnant women (R=−0.623, P<0.0001) was significantly negatively correlated with HDI index. In the analysis of HDI components and the prevalence of anemia, a significant negative correlation was observed between the prevalence of anemia and the mean years of schooling, life expectancy at birth, and expected years of schooling indices in all 3 groups of women (non-pregnant, pregnant, and of reproductive age) (P<0.05).
Conclusion
Since there was a negative correlation between the prevalence of anemia in women and HDI, paying greater attention to factors which influence anemia may contribute to the prevention of anemia in developing countries.
Keywords: Prevalence; Anemia; Asia
Received: 2019.10.08. Revised: 2020.02.09. Accepted: 2020.02.10.
Corresponding author: Zaher Khazaei, MSc
Department of Epidemiology, School of Public Health, Ilam University of Medical Sciences, Ilam 7419654459, Iran E-mail: [email protected]
https://orcid.org/0000-0001-8619-3664
Articles published in Obstet Gynecol Sci are open-access, distributed under the terms of the Creative Commons Attribution Non-Commercial License (http://creativecommons.
org/licenses/by-nc/3.0/) which permits unrestricted non-commercial use, distribution, and reproduction in any medium, provided the original work is properly cited.
Copyright © 2020 Korean Society of Obstetrics and Gynecology
product (GDP) [1].
Although adults only need 1 mg of absorbable iron daily, iron deficiency anemia remains a widespread issue. Women of reproductive age who have poor diets and suffer from malnutrition are at a greater risk for anemia [2,3]. The preva- lence of iron deficiency anemia in women is higher than that of men. Despite the economic-scientific advances in recent years, anemia is still prevalent especially in pregnant women and children before school age [4].
The World Health Organization (WHO) estimates that iron deficiency anemia took the lives of 273,000 people in 2004.
Of this figure, 45% were Southeast Asian, 31% African, 9% Eastern Mediterranean, 4% Oceania, and 3% Euro- pean. Of all anemia cases, 97% are found in middle-income countries [5]. Anemia is particularly prevalent in women of reproductive age and children under the age of 5. Studies in developed countries such as Japan, Sweden, and the United States indicate the rising incidence of iron deficiency anemia in affluent societies. It has also posed a major problem in de- veloping countries such as India over the last 50 years [6].
The results of a study in 185 countries from 1990 to 2011 exhibited that anemia was the most prevalent in Southeast Asia. Extreme cases of iron deficiency anemia can escalate to maternal mortality and preterm labor [3,7]. Several factors contribute to the widespread prevalence of micronutrient de- ficiencies in South Asia including iron deficiency in the diet, poor health, genetic causes, chronic infections, malaria and schistosomiasis [8,9]. The prevalence of anemia varies widely in different parts of the world and it is more salient in lower socioeconomic classes [10].
Moreover, as far as the relationship between anemia and the human development index (HDI) is concerned, in areas with a high HDI, anemia-related problems are less noticeable.
HDI represents the essence of human development mea- sures. This index measures the average success of a country in 3 main dimensions of human development, i.e. a long and healthy life, education and appropriate living standards [11].
Given the prevalence of anemia in Asian countries, it is necessary to raise awareness about its contributing factors in order to plan and manage the financial and human resources required to curb its incidence. It is essential for countries to introduce the necessary interventions by comparing their data with those of other countries with regard to the effect of socioeconomic status on the root causes of anemia [11].
The purpose of this study was to explore the impact of so-
cioeconomic development (based on HDI) on the prevalence of anemia among Asian women based on data retrieved from the World Bank in 2018.
Materials and methods
The present research was a descriptive-analytic ecological study that investigated the relationship between anemia prevalence in 3 groups of women and its connection with HDI in Asian countries. The study data included HDI and the prevalence of anemia obtained from the World Bank [12].
1. Definition of anemia
Percentage of women aged 15−49 years with a hemoglobin concentration less than 120 g/L for non-pregnant women and lactating women and less than 110 g/L for pregnant women, adjusted for altitude and smoking [13,14].
2. Human development index
The HDI provided by the World Bank delivers the latest data on global development, which includes national, regional and global estimates. According to the Human Development Report, countries are divided into 4 groups: very high human development, high human development, medium human development, and low human development based on the level of the HDI. The numerical value of the HDI is between 0 and 1. It measures efforts taken by each country to reach the highest possible HDI value, and also allows comparisons between countries. HDI represents the essence of human development measures. It measures the mean success of a country in 3 main dimensions of human development: a long and healthy life, access to education and proper living stan- dards [15].
3. Statistical analysis
In this study, data analysis was performed using correlation coefficients and an analysis of variance (ANOVA) to investi- gate the relationship between the prevalence of anemia and HDI. A P-value of less than 0.05 was considered significant.
Analyses were performed using the Stata-14 software (Stata-
Corp, College Station, TX, USA).
Results
According to the results reported in 2016, the global preva- lence of anemia is 32.5% in non-pregnant women, 40.1%
in pregnant women, and 32.8% in women of reproductive age. The highest prevalence of anemia in all 3 groups of women (non-pregnant, pregnant, and of reproductive age) was observed in South-East Asia and the lowest in America (Table 1). The analysis of trends in anemia prevalence in 3 groups of women between 2000 and 2016 demonstrates that the prevalence of anemia in all 3 groups was the highest in the South-East Asia region, which was above the global average during these years (Fig. 1).
According to the analysis of the prevalence of anemia, the highest prevalence of anemia in non-pregnant women was recorded in Yemen (70.2%), Pakistan (52.2%), and In- dia (51.5%); the highest prevalence of anemia in pregnant women was recorded in Yemen (63%), Cambodia (55.8%), and Myanmar (53.8%); and the highest prevalence of ane- mia in women of reproductive age was recorded in Yemen (69.6%), Pakistan (52.1%), and India (51.4%) (Table 2).
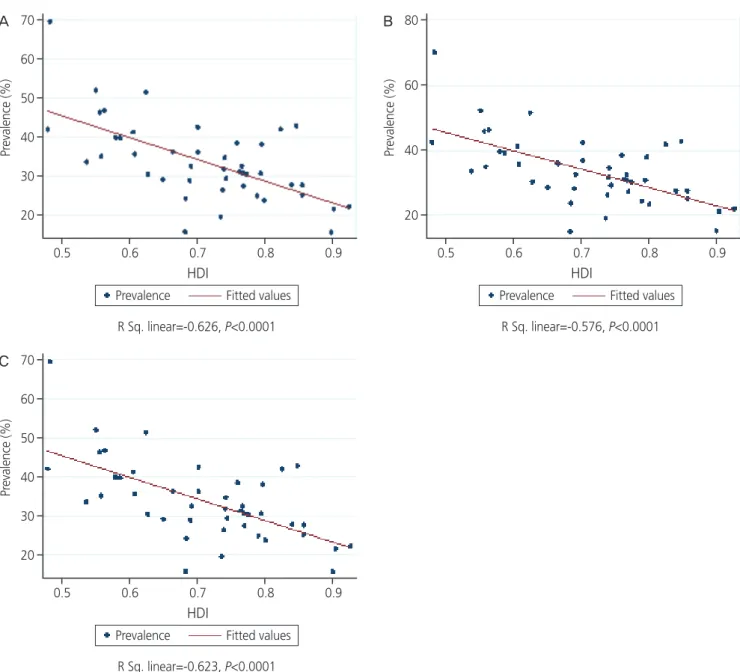
The results revealed a significant negative correlation be- tween the prevalence of anemia in women of reproductive age (R=−0.626, P<0.001), pregnant women (R=−0.576, P<0.001) and non-pregnant women (R=−0.623, P<0.001) and HDI index (Fig. 2).
In the analysis of HDI components and the prevalence of anemia in 3 groups of women, a significant negative cor- relation was observed between the prevalence of anemia in non-pregnant women and mean years of schooling (MYS) (r=−0.564, P<0.001), life expectancy at birth (LEB) (r=−0.552, P<0.001), and expected years of schooling (EYS) (r=−0.564, P<0.001). There was a significant negative correlation be- tween anemia prevalence in pregnant women and MYS (r=−0.563, P<0.001), LEB (r=−0.439, P<0.001), and EYS (r =−0.534, P<0.01). Moreover, there was also a significant negative correlation between the prevalence of anemia in women of reproductive age and MYS (r=−0.567, P<0.001), LEB (r=−0.553, P<0.001), and EYS (r=−0.566, P<0.01). No significant correlation was observed between the prevalence of anemia and GDP in all 3 groups of women (P>0.05) (Table 3).
The results of the ANOVA suggested that in non-pregnant women, the highest mean prevalence (48.7±19.1) belonged to low human development and the lowest mean prevalence (27.4±9.2) to very high human development, and this differ- Table 1.
Prev alence of anemia in women estimates by W orld Health Organization (WHO) region WHO r egion Pr evalence of anemia in non-pr egnant woman (%) Pr evalence of anemia in pr egnant woman (%) Pr evalence of anemia in woman r epr oductive age (%) 2000 2005 2010 2015 2016 2000 2005 2010 2015 2016 2000 2005 2010 2015 2016 Africa 44.8 (39.8–49.0) 42.6 (38.2–46.5) 39.1 (34.7–43.2) 38.0 (32.0–44.1) 38.2 (31.7–45.0) 52.1 (48.9–54.9) 50.5 (47.6–52.9) 48.1 (44.8–50.7) 46.3 (41.0–50.7) 46.2 (40.3–51.3) 45.6 (41.0–49.5) 43.4 (39.3–47.0) 40.1 (36.0–43.9) 38.8 (33.1–44.5) 39.0 (32.7–45.4) America 19.8 (16.5–23.7) 18.7 (16.1–21.5) 17.5 (14.5–21.1) 18.2 (13.5–24.7) 18.8 (13.5–26.4) 28.9 (22.9–34.5) 26.8 (21.7–31.7) 25.4 (20.5–30.4) 25.3 (19.5–32.3) 25.5 (19.2–32.8) 20.2 (17.0–24.0) 19.1 (16.5–21.7) 17.8 (14.9–21.3) 18.4 (13.9–24.8) 19.1 (13.9–26.5) South-East Asia 47.4 (42.3–52.2) 46.5 (41.1–51.2) 44.9 (39.4–50.2) 45.2 (39.0–50.2) 45.6 (38.8–51.2) 50.3 (45.6–55.1) 49.2 (43.8–53.6) 48.0 (42.5–52.8) 47.9 (42.3–53.1) 48.1 (42.1–53.7) 47.6 (42.7–52.2) 46.7 (41.4–51.2) 45.0 (39.7–50.2) 45.3 (39.3–50.2) 45.8 (39.1–51.2) Eur ope 20.2 (16.1–25.5) 19.8 (16.0–25.0) 19.5 (15.7–24.5) 21.7 (16.2–28.8) 22.5 (16.4–30.7) 27.5 (22.0–33.6) 26.0 (21.2–31.5) 25.3 (20.6–31.1) 26.1 (20.3–33.9) 26.5 (20.3–35.0) 20.4 (16.3–25.6) 20.0 (16.2–25.1) 19.7 (15.9–24.5) 21.8 (16.4–28.7) 22.7 (16.6–30.7) Easter n Mediterranean 39.3 (34.7–43.6) 38.4 (34.0–42.8) 37.4 (32.9–41.8) 39.0 (32.2–45.6) 39.8 (32.1–47.5) 41.1 (36.4–45.7) 40.5 (36.6–44.5) 40.1 (36.1–43.8) 40.6 (34.9–46.5) 40.9 (34.5–47.6) 39.5 (35.0–43.7) 38.6 (34.4–42.8) 37.6 (33.3–41.8) 39.1 (32.6–45.5) 39.8 (32.4–47.4) W ester n Pacific 21.8 (15.7–30.7) 19.4 (13.8–28.3) 19.2 (12.5–29.4) 23.7 (12.5–38.8) 25.1 (12.5–41.8) 28.9 (23.4–36.6) 27.7 (22.1–35.4) 28.3 (20.9–39.1) 32.0 (20.5–49.3) 33.0 (20.5–51.1) 22.0 (16.0–30.8) 19.6 (14.2–28.4) 19.5 (12.8–29.6) 23.9 (12.9–38.6) 25.3 (13.0–41.8) W orld 31.1 (28.5–34.2) 30.1 (27.6–33.1) 29.4 (26.6–32.9) 31.6 (27.4–36.4) 32.5 (27.8–37.8) 41.6 (39.1–44.0) 40.4 (38.1–42.8) 39.4 (36.9–42.1) 39.8 (36.4–43.8) 40.1 (36.4–44.6) 31.6 (29.1–34.7) 30.6 (28.2–33.5) 29.9 (27.2–33.3) 32.0 (27.9–36.6) 32.8 (28.3–38.0)
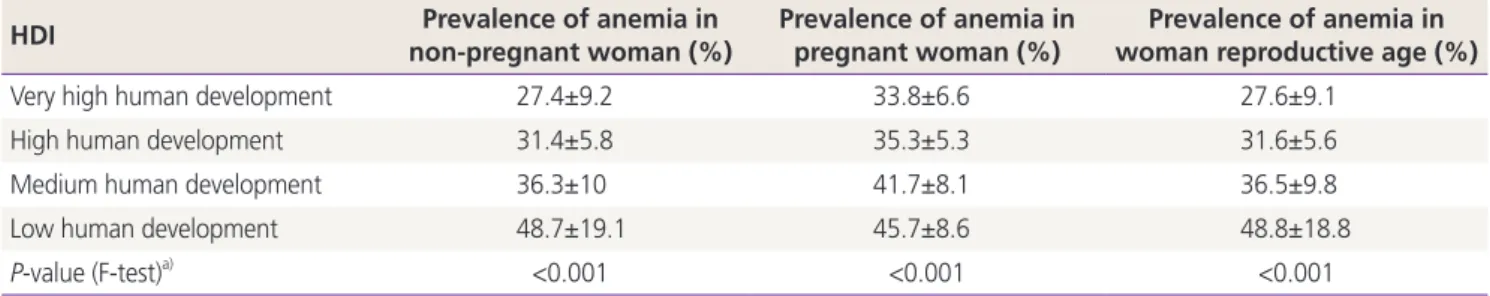
ence was statistically significant (F=4.73, P<0.001). In pregnant women, the highest mean (45.7±8.6) belonged to low human development and the lowest mean (33.8±6.6) to very high human development, and the difference was statistically sig- nificant (F=4.11, P<0.001). These results were comparable to those found in women of reproductive age, with the highest mean prevalence of anemia (48.8±18.8) belonging to low hu- man development and the lowest mean prevalence to the very high human development (27.6±9.1). Here, the difference was also statistically significant (F=4.73, P<0.001) (Table 4).
Discussion
Iron deficiency anemia has been reported in 25% of mothers with malnutrition [3]. Pregnant women and young children are more likely to develop anemia. Geographically, people living in Asia and Africa are at a greater risk of anemia. Ac- cording to the WHO, the prevalence of anemia in all women, pregnant women, and non-pregnant women was 37%, 51%, and 35%, respectively, in 1988 [16]. The results of this research suggested that, in general, the highest prevalence
Fig. 1. Trend of anemia prevalence in 3 groups of women. (A) Non-pregnant woman, (B) pregnant woman, (C) woman reproductive age by region World Health Organization.
A
B
C 50 45 40 35 30 25 20 15 10 5 0
Africa America South-East Asia Europe Eastern Mediterranean Western pacific World
2000 2005 2010 2015 2016
50 45 40 35 30 25 20 15 10 5
0 2000 2005 2010 2015 2016
60 50 40 30 20 10
0 2000 2005 2010 2015 2016
Africa America South-East Asia Europe Eastern Mediterranean Western pacific World
Africa America South-East Asia Europe Eastern Mediterranean Western pacific World 47.4
44.8 39.3 31.1 21.6 20.2 19.8
46.5 42.6 38.4 30.1
19.8 19.4 18.7
44.9 39.1 37.4 29.4
19.5 19.2 17.5
45.2 39 38 31.6 23.7 21.7 18.2
45.6 39.8 38.2 32.5 25.1 22.5 18.8
47.6 45.6 39.5 31.6 22 20.4
20.2
46.7 43.4 38.6 30.6 20 19.6 19.1
45 40.1 37.6 29.9 19.5
19.7 17.8
45.3 39.1 38.8 32 23.9
21.8 18.4
45.8 39.8 39 32.8 25.3
22.7 19.21 50.3
52.1 41.6 41.1 28.9 26.9
27.5
50.5 49.2 40.5 40.4 27.7 26 26.8
48.1 40.1 46 39.4 28.3 25.4 25.3
47.9 46.3 40.6 39.4
32 26.1 25.3
48.1 40.9 46.2 40.1 33
26.5
25.5
Table 2. Prevalence of anemia in Asian women (estimates by country in 2016)
Country Prevalence of anemia in
non-pregnant woman (%)
Prevalence of anemia in pregnant woman (%)
Prevalence of anemia in woman reproductive age (%)
Afghanistan 42.4 (27.7–55.8) 38.2 (24.7–53.3) 42.0 (28.2–54.9)
Armenia 29.2 (12.2–56.3) 35.5 (17.5–63.3) 29.4 (12.6–56.3)
Azerbaijan 38.4 (25.3–51.8) 40.1 (26.9–54.7) 38.5 (25.7–51.6)
Bahrain 41.9 (19.0–67.2) 42.8 (20.2–64.8) 42.0 (19.7–66.7)
Bangladesh 39.6 (21.1–55.5) 45.7 (28.9–60.1) 39.9 (22.0–55.5)
Bhutan 35.7 (24.8–47.8) 32.8 (21.3–47.9) 35.6 (25.0–47.3)
Cambodia 46.3 (36.3–54.2) 55.8 (46.0–63.3) 46.8 (37.2–54.6)
China 26.2 (9.8–47.7) 32.4 (15.6–57.8) 26.4 (10.2–47.5)
Cyprus 25.1 (9.6–50.6) 29.0 (15.2–57.0) 25.2 (9.9–50.2)
Georgia 27.4 (12.9–45.5) 30.1 (17.5–50.3) 27.5 (13.2–45.3)
India 51.5 (41.5–58.7) 50.1 (42.0–57.2) 51.4 (41.8–58.5)
Indonesia 28.2 (18.7–38.8) 42.0 (30.4–53.7) 28.8 (19.4–39.0)
Iran 30.3 (12.7–52.8) 34.1 (17.5–57.6) 30.5 (13.2–52.4)
Iraq 28.7 (17.2–44.3) 33.5 (19.3–51.6) 29.1 (18.0–44.1)
Israel 15.2 (7.0–38.0) 23.8 (12.7–49.9) 15.7 (7.5–37.3)
Japan 21.2 (14.4–31.0) 34.1 (18.2–57.6) 21.5 (14.8–31.0)
Jordan 34.5 (20.8–50.0) 37.1 (22.9–51.6) 34.7 (21.4–49.7)
Kazakhstan 30.7 (13.0–52.2) 30.4 (15.7–54.3) 30.7 (13.4–51.2)
Kuwait 23.5 (9.8–46.3) 31.2 (14.8–57.3) 23.8 (10.2–46.2)
Kyrgyzstan 35.9 (21.3–51.5) 39.8 (25.1–55.6) 36.2 (22.0–51.0)
Lao People’s Democratic Republic 39.3 (19.5–60.7) 45.7 (23.8–65.0) 39.7 (20.7–60.7)
Lebanon 31.1 (13.2–55.0) 35.2 (17.8–60.1) 31.2 (13.6–54.8)
Malaysia 24.4 (9.4–49.8) 37.1 (15.8–63.0) 24.9 (10.0–49.7)
Maldives 42.4 (21.2–60.9) 46.9 (18.6–67.5) 42.6 (21.9–61.0)
Mongolia 18.9 (7.1–38.8) 30.3 (18.2–49.5) 19.5 (8.0–38.4)
Myanmar 46.0 (34.2–54.7) 53.8 (41.5–62.4) 46.3 (35.0–54.9)
Nepal 34.9 (19.2–50.9) 40.0 (22.9–57.7) 35.1 (19.9–50.9)
Oman 38.0 (17.4–62.2) 41.8 (20.8–62.5) 38.2 (18.1–62.1)
Pakistan 52.2 (35.3–67.4) 51.3 (36.4–62.8) 52.1 (35.7–67.0)
Philippines 14.9 (9.7–25.6) 30.3 (19.2–45.2) 15.7 (10.5–26.1)
Qatar 27.5 (10.2–52.8) 33.4 (15.2–58.5) 27.7 (10.6–52.9)
Saudi Arabia 42.8 (18.0–70.9) 45.5 (20.7–65.6) 42.9 (18.8–70.5)
Singapore 22.0 (8.5–50.3) 31.8 (15.2–59.6) 22.2 (8.7–50.3)
Sri Lanka 32.5 (14.1–51.3) 35.4 (19.2–55.6) 32.6 (14.7–51.1)
Syrian Arab Republic 33.5 (13.8–56.5) 36.1 (17.2–60.2) 33.6 (14.6–56.3)
Tajikistan 30.3 (14.0–49.3) 33.5 (17.3–57.4) 30.5 (14.9–48.5)
Thailand 31.6 (11.2–70.2) 40.2 (15.9–67.6) 31.8 (11.7–70.2)
Timor-Leste 41.2 (25.0–55.9) 42.6 (24.5–60.7) 41.3 (26.2–55.9)
Turkey 30.7 (12.0–56.7) 34.4 (16.5–60.2) 30.9 (12.5–56.6)
Turkmenistan 32.6 (13.3–54.9) 33.1 (16.7–58.1) 32.6 (13.8–54.4)
United Arab Emirates 27.6 (10.8–52.7) 33.2 (15.7–59.6) 27.8 (11.1–52.6)
Uzbekistan 36.8 (16.2–52.6) 24.9 (14.6–48.5) 36.2 (16.6–51.6)
Viet Nam 23.7 (10.4–43.7) 37.3 (19.3–58.5) 24.2 (11.0–43.8)
Yemen 70.2 (54.7–79.7) 63.0 (56.3–66.7) 69.6 (55.0–78.5)
Table 3. Pearson correlation between human development index (HDI) component and prevalence of anemia in Asian women in 2016 HDI component
Prevalence of anemia in non-pregnant woman
(%)
Prevalence of anemia in pregnant woman (%)
Prevalence of anemia in woman reproductive
age (%)
r
a)P-value r
a)P-value r
a)P-value
Gross national income per 1,000 capita −0.284 >0.05 −0.225 >0.05 −0.286 >0.05
Mean years of schooling −0.564 <0.001 −0.563 <0.001 −0.567 <0.001
Life expectancy at birth −0.552 <0.001 −0.439 <0.001 −0.553 <0.001
Expected years of schooling −0.564 <0.001 −0.534 <0.001 −0.566 <0.001
a)
Statistical method used: Pearson correlation coefficient.
Fig. 2. Correlation
a)between the human development index (HDI) and prevalence of anemia in Asian women. (A) Women reproductive age, (B) pregnant woman, (C) non-pregnant woman in 2016.
a)Statistical method used: correlation coefficient.
A
C
B
Pr evalence (%) Pr evalence (%)
Pr evalence (%)
70
60
50
40
30
20
80
60
40
20
70
60
50
40
30
20
0.5 0.6 0.7 0.8 0.9
HDI
0.5 0.6 0.7 0.8 0.9
HDI
0.5 0.6 0.7 0.8 0.9
HDI
Prevalence Fitted values Prevalence Fitted values
Prevalence Fitted values
R Sq. linear=-0.626, P<0.0001 R Sq. linear=-0.576, P<0.0001
R Sq. linear=-0.623, P<0.0001
of anemia in non-pregnant women, pregnant woman, and women of reproductive age was observed in Asia, Africa, and Asia, respectively. Moreover, the highest prevalence of anemia in non-pregnant women (70.2%), pregnant women (63%), and women of reproductive age (69.6%) was record- ed in Yemen.
The lowest incidence of anemia in non-pregnant women was recorded in the Philippines (14.9%); in pregnant women in Israel (23.8%); and in women of reproductive age in Japan and the Philippines (15.7%).
The difference in the prevalence of anemia in these areas can also be attributed to differences in the socioeconomic status of individuals. One indicator that reflects the status of countries is HDI. This index explores the status of a country in 3 key development dimensions, including health, education and living standards. Health is measured with LEB, education with the EYS, and living standards as gross national income per capita or GDP. In countries with high HDI, the prevalence of anemia is lower. The secondary causes of anemia preva- lence include timely screening and diagnosis, elevated quality of food, early-stage treatment of malnutrition, and accurate estimation of vitamin intake in these countries [9].
In middle-income countries, the prevalence of anemia is higher; as a result, 97% of anemia-induced mortality is re- ported in developing countries [5]. The highest prevalence of anemia in the world is observed in countries with low HDI [17]. In this context, the highest prevalence of anemia has been recorded in Asian countries. Nutritional anemia is wide- spread not only in developing countries but also in affluent societies [2,16].
The results of a 2016 study by Petry et al. [4] demonstrated that anemia has declined in countries with moderate to high HDI. In this study, iron deficiency anemia in preschool chil-
dren and women of reproductive age was 25% and 37%
in high HDI communities, respectively, while this figure was higher than the 45% in low HDI communities. A 2011 study by Oliveira et al. [18] showed that there was an inverse as- sociation between the prevalence of anemia and HDI. This study revealed that the prevalence of anemia was significant- ly higher among blood donors in communities with lower HDI [18]. In their 2012 study, Laxmaiah et al. [19] exhibited that the incidence of HDI was inversely correlated with the prevalence of anemia. These studies demonstrated that ane- mia is still a major health issue and the prevention and con- trol of malnutrition should be considered as a key strategy in curbing the prevalence of anemia.
Socioeconomic developments have wielded huge influence on the prevalence of anemia. In low- and middle-income countries, the risk of anemia is increasing. Socioeconomic growth is inversely related to the prevalence of anemia.
Chronic infections, nutritional disorders, obesity, chronic non- communicable diseases, thalassemia, and genetic susceptibil- ity are among the risk factors for anemia. Anemia is linked to HDI in societies, so that according to statistics, the most anemia-related deaths take place in less developed countries [4].
The results of this study demonstrate a significant negative correlation between the prevalence of anemia in non-preg- nant women and MYS (r=−0.564, P<0.001), LEB (r=−0.552, P<0.001), and EYS (r=−0.564, P<0.001); a significant nega- tive correlation between anemia prevalence in pregnant women and MYS (r=−0.563, P<0.001), LEB (r=−0.439, P<0.001), and EYS (r=−0.534, P<0.01), and a significant negative correlation between the prevalence of anemia in women of reproductive age and MYS (r=−0.567, P<0.001), LEB (r=−0.553, P<0.001), and EYS (r=−0.566, P<0.01). The lower prevalence of anemia in countries with higher HDIs
Table 4. Prevalence of anemia in different human development index (HDI) regions Asian women in 2016
HDI Prevalence of anemia in
non-pregnant woman (%)
Prevalence of anemia in pregnant woman (%)
Prevalence of anemia in woman reproductive age (%)
Very high human development 27.4±9.2 33.8±6.6 27.6±9.1
High human development 31.4±5.8 35.3±5.3 31.6±5.6
Medium human development 36.3±10 41.7±8.1 36.5±9.8
Low human development 48.7±19.1 45.7±8.6 48.8±18.8
P-value (F-test)
a)<0.001 <0.001 <0.001
Data are shown as mean±standard deviation.
a)