DOI https://doi.org/10.12791/KSBEC.2018.27.2.132 eISSN 2288-100X
Development and Validation of a Canopy Photosynthetic Rate Model of Lettuce Using Light Intensity, CO 2 Concentration,
and Day after Transplanting in a Plant Factory
Dae Ho Jung 1† , Tae Young Kim 1† , Young-Yeol Cho 2 , and Jung Eek Son 1 *
1
Department of Plant Science, Seoul National University, Seoul 08826, Korea
2
Major of Horticultural Science, Jeju National University, Jeju 63243, Korea
Abstract. The photosynthetic rate is an indicator of the growth state and growth rate of crops and is an important factor in constructing efficient production systems. The objective of this study was to develop a canopy photosyn- thetic rate model of romaine lettuce using the three variables of CO
2concentration, light intensity, and growth stage.
The canopy photosynthetic rates of the lettuce were measured at five different CO
2concentrations (600- 2,200µmol·mol
-1), five light intensities (60-340µmol·m
-2·s
-1), and four growth stages (5-20 days after transplanting) in three closed acrylic chambers (1.0 × 0.8 × 0.5m). A simple multiplication model expressed by multiplying three single-variable models and the modified rectangular hyperbola model including photochemical efficiency, carboxyl- ation conductance, and dark respiration, which vary with growth stage, were also considered. In validation, the R
2value was 0.923 in the simple multiplication model, while it was 0.941 in the modified rectangular hyperbola model.
The modified rectangular hyperbola model appeared to be more appropriate than the simple multiplication model in expressing canopy photosynthetic rates. The model developed in this study will contribute to the determination of an optimal CO
2concentration and light intensity with the growth stage of lettuce in plant factories.
Additional key words : growth stage, photosynthesis model, rectangular hyperbola model, regression model
Introduction
Plant factories using artificial lights are highly energy- intensive production systems (Mills, 2012). These produc- tion systems require efficient production management (Li et al., 2016). Because photosynthetic rate is an indicator of the growth state and growth rate of crops, it plays an important role in constructing an efficient production sys- tem. Several models have already been established for pho- tosynthesis and growth in various plant cultivation systems (Caporn 1989; Shimizu et al., 2008). Lettuce is one of the most suitable model crops for cultivation in plant factories, and the photosynthesis of lettuce has often been studied (Jung et al., 2016).
Existing photosynthesis models are shown as simple sat- uration curves using the two variables of light intensity and CO
2concentration. The models based on light intensity and CO
2concentration have been studied as rectangular hyper-
bolas (Acock et al., 1971; Thornley, 1976; Acock and Allen, 1985; Goudriaan et al., 1985). Recently, there have been studies on harmonizing the canopy level from the leaf photosynthesis level in crop modeling (Hikosaka et al., 2016). Since the light intensity depends on the position of leaves in the canopy, measuring the photosynthetic rate of a single leaf has limitations in representing the entire crop photosynthesis. The canopy photosynthetic rate is more closely related to crop yield than to the leaf photosynthetic rate. Therefore, when using photosynthesis models as an indicator of crop growth, it is necessary to measure the canopy photosynthetic rate in plant factories.
Most of the current photosynthesis models have rarely reflected time even though the crop response to growth stages is different (Perez-Peña and Tarara, 2015) and the efficiency of light utilization decreases as leaf area increases (Green, 1987; Leadly et al., 1990; Jung et al., 2016). In particular, it is important to maximize the resource utilization efficiency of plant factories, so the pho- tosynthetic rate of cultivated crops should be known (Kozai, 2013). Also, understanding the change in light use efficiency of crops over time helps to establish the cultiva- tion strategy of plant factories. Niinemets (2016) reported
†
These authors equally contributed to this work
*Corresponding author: [email protected]
*Received February 27, 2018; Revised March 22, 2018;
*Accepted April 2, 2018
photo-plasticity, in which photosynthetic capacity varies with leaf age. Therefore, relative factors for photosynthetic reaction over time should be applied to models.
To express the photosynthetic rate for light intensity and CO
2concentration, rectangular hyperbola equations and negative exponential equations have been used. These two equations are suitable for representing situations in which the rate of photosynthesis gradually increases to a specific saturation point. Thornley (1974) and Kaitala et al. (1982) suggested a simple model for the chemical reactions that take place in light and dark reactions of photosynthesis.
This model is known to be suitable for expressing the pho- tosynthetic rate with changes in light intensity and CO
2concentration, but there are limitations to tracking changes in other environmental factors, such as temperature and growth stage.
Modifying the existing rectangular hyperbola model would be suitable for expressing the effects of other envi- ronmental factors. Although the widely used Farquhar, von Caemmerer, and Berry (FvCB) photosynthetic model expresses the change in photosynthetic rate according to various environmental factors (Farquhar et al., 1980), it does not provide a simple form that can include the three variables of light intensity, CO
2concentration, and growth stage. Jung et al. (2017) established a photosynthetic rate model with light intensity, temperature, and growth period, but it is still necessary to construct a model including CO
2concentrations, which are more important for photosynthe- sis. The objectives of this study were to analyze canopy photosynthetic rates at various combinations of CO
2con- centration, light intensity, and growth stage and to develop a canopy photosynthetic rate model based on a rectangular hyperbola equation.
Materials and Methods
1. Plant and Cultivation Conditions
Romain lettuce (Lactuca sativa L. cv. Asia Heuk Romaine) was hydroponically grown with deep-flow tech- nique systems in plant factory modules at Seoul National University. Yamazaki nutrient solutions with an electrical conductivity of 1.2 dS·m
-1were supplied to the plants.
Light-emitting diodes with a red : blue : white = 8 : 1 : 1 light spectrum were used as light sources (FGL-B1200; FC Poibe Co., Ltd., Seoul, Korea). Light intensity and air tem- perature in the growth chamber were maintained at 150 ±
20µmol·m
-2·s
-1(light : dark = 16 h : 8 h) and 21 ± 1
oC, respectively. The CO
2concentration were maintained at 1,000µmol·mol
-1for inducing more photosynthesis and rel- ative humidity were maintained at 70 ± 5%. One hundred lettuce plants were grown for 20 days after transplanting (DAT) at a planting density of 16 plants·m
-2.
2. Measurement of Canopy Photosynthetic Rates Lettuce plants were placed in three identical closed acrylic chambers (1.0 × 0.8 × 0.5m) to measure the canopy photosynthetic rate. Four growth stages of lettuce were used for the measurements: 5, 10, 15, and 20 DAT. For cal- culating the canopy photosynthetic rate, changes in the CO
2concentration inside the chamber were measured with a combination of light intensity and CO
2concentration: five light intensities (60, 130, 200, 270, and 340µmol·m
-2·s
-1) and five CO
2concentrations (600, 1,000, 1,400, 1,800, and 2,200µmol·mol
-1). In order to obtain the canopy photosyn- thetic rate, the CO
2consumption amount during the mea- surement period, excluding time lag, was multiplied by the chamber volume and divided by leaf area (Takahashi et al., 2008). Reductions in the internal CO
2concentration due to the leakage of the chamber were calibrated by using the measured air exchange rate (0.0077h
-1). The CO
2emission due to root respiration was considered negligible because it was around 0.69% of the total CO
2consumption. The tem- perature and relative humidity were measured by using a sensor (S-VT200B; Soha Tech, Seoul, Korea) and col- lected with a datalogger (Campbell Scientific, Inc., Logan, UT, USA) every 5s. The air pressure inside the chambers was 1,013hPa. The temperature was controlled by Peltier devices, which were attached to the side wall of the cham- ber. Increases in relative humidity due to transpiration were controlled by silica gel installed in the chamber. Wind speeds around the plants were maintained at 0.3-0.5m·s
-1. The change in CO
2concentration inside each chamber was measured by using a CO
2gas analyzer (LI-820; LI-COR, Lincoln, NE, USA) every 5 seconds.
3. Establishment of a Three-Variable Simple Multipli- cation Model
One-variable models for the photosynthetic rate obtained
by measuring the light intensity, temperature, or growth
stage are known as a rectangular hyperbola, quadratic, and
exponential model, respectively. In a previous study, a
three-variable simple multiplication model was con-
structed to express the lettuce canopy photosynthetic rate (Jung et al., 2017). Since the temperature inside the cham- ber was kept constant in previous study, the simple multi- plication model can be summarized as follows:
(1) where P is canopy photosynthetic rate (µmolCO
2·m
-2·s
-1), I is light intensity (µmol·m
-2·s
-1), C is CO
2concentration (µmol·mol
-1), t is DAT (d), and R is dark respiration (µmol- CO
2·m
-2·s
-1); a, b, and c are regression parameters. Nonlin- ear regression analysis was performed in the SPSS (IBM, New York, NY, USA) statistical program using the mea- sured canopy photosynthetic rate according to light inten- sity, CO
2concentration, and growth stage.
4. Establishment of a Three-Variable Modified Rect- angular Hyperbola Model
A rectangular hyperbola model constructed by Acock et al. (1976) and supplemented by Kaitala et al. (1982) is expressed as follows:
(2) where α and β are photochemical efficiency (µmolCO
2·mol
-1) and carboxylation conductance (s
-1), respectively.
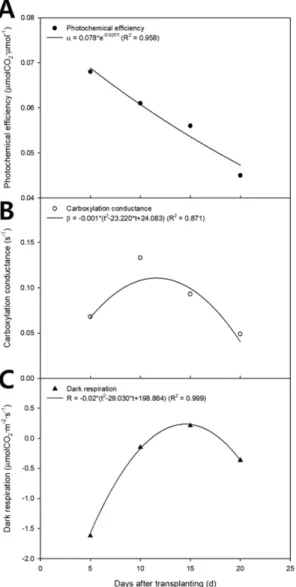
The photochemical efficiency, carboxylation conduc- tance, and dark respiration obtained by nonlinear regres- sion analysis are shown on a two-dimensional plane with the growth stage as the X axis (Fig. 3). The photochemical efficiency, carboxylation conductance, and dark respiration were determined using empirical equations (Jung et al., 2017):
(3)
(4)
(5)
where a
1, a
2, b
1, b
2, c
1, and c
2are regression parameters.
The regression coefficients were determined through the nonlinear regression analysis of photochemical efficiency, carboxylation conductance, and dark respiration. The modi- fied rectangular hyperbola model was constructed by sub- stituting Eqs. 3-5 into Eq. 2.
5. Validation of the Canopy Photosynthetic Rate Models One hundred additional lettuce plants were cultivated under the same environmental conditions as for the mea- surement of the canopy photosynthetic rate. The R
2value was obtained through a regression analysis of the mea- sured and estimated canopy photosynthetic rates.
Results
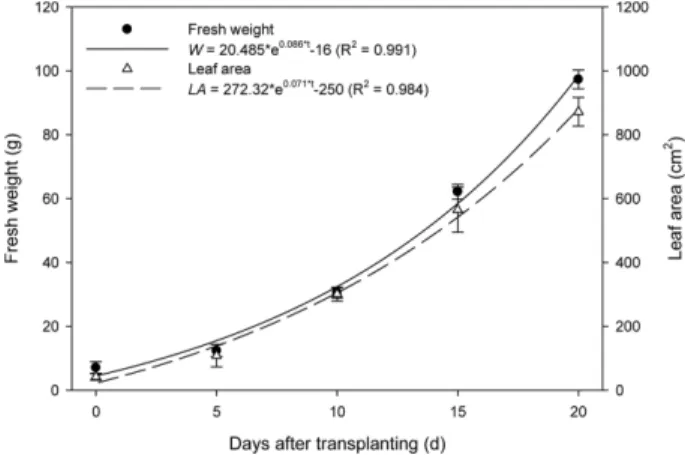
1. Changes in Shoot Fresh Weight and Leaf Area with Growth Stage
As the growth stage progressed, the fresh weight and leaf area of the lettuce exponentially increased and reached 97.3
± 2.94g and 872.0 ± 44.50cm
2at 20 DAT, respectively.
(Fig. 1). The fresh weight and leaf area were regressed to the following exponential models with days after trans- planting as the growth stage:
(6)
(7)
where W is fresh weight (g) and LA is leaf area (cm
2).
Regression analysis showed that the R
2values of Eqs. 6 and 7 were 0.991 and 0.984, respectively.
2. Regression Results of Simple Multiplication and Modified Rectangular Hyperbola Models
The canopy photosynthetic rate of the lettuce was plot- ted on a three-dimensional space using light intensity and CO
2concentrations as the X and Y axes (Fig. 2). In the fig- ure, black dots show the canopy photosynthetic rate P a* 1*C
1 + b*C ---*e
c*t+ R
=
P α*I*β*C
α*I β*C + --- R +
=
α a =
1*e
b1*tβ a =
2*t
2+ b
2*t c +
2R a =
3*t
2+ b
3*t c +
3W 20.485*e =
0.086*t– 16 LA = 272.32*e
0.071*t– 250
Fig. 1. Fresh weight and leaf area of the lettuce at 0 - 20 days after
transplanting. Vertical bars represent the mean ± SD (n = 15).
obtained from actual measurement and the curved surface is the estimated canopy photosynthetic rate acquired from the simple multiplication model. The simple multiplication model (curved surface) was determined by Eq. 8:
(8)
Regression analysis of Eq. 8 resulted in an R
2value of 0.918. As light intensity increased, the canopy photosyn- thetic rate linearly increased. As the CO
2concentration increased, the canopy photosynthetic rate increased and finally saturated. As the growth stage progressed, the maxi- mum canopy photosynthetic rate decreased, while the satu- ration pattern of the canopy photosynthetic rate with light intensity and CO
2concentration was maintained.
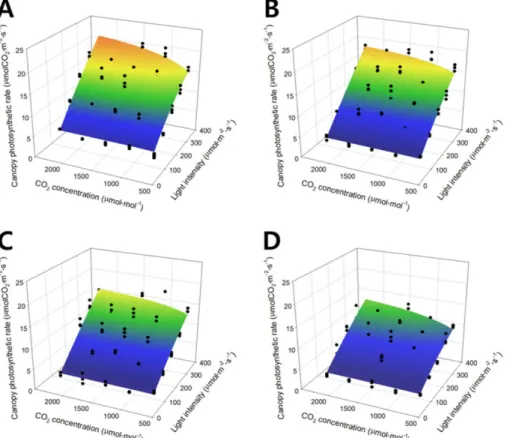
The photochemical efficiency, carboxylation conduc- tance, and dark respiration are shown on a two-dimen- sional plane by substituting the regression coefficients in Table 1 (Fig. 3). The photochemical efficiency exponen- tially decreased as the growth stage progressed (Fig. 3A).
The carboxylation conductance and dark respiration appear as quadratic curves, which increased and decreased as the growth stage progressed (Figs. 3B and 3C). In the canopy photosynthetic rates plotted on the three-dimensional space with light intensity and CO
2concentration (Fig. 4), the black dots show the canopy photosynthetic rate obtained from actual measurement and the curved surface is the estimated canopy photosynthetic rate acquired from the modified rect- P 0.106*I
I 1.392*C +
---*e
–0.024*t+ 0.020*t
2– 0.581*t + 3.977
=
Fig. 2. Canopy photosynthetic rates of the lettuce expressed with the simple multiplication model according to light intensity and CO
2concentration at 5 (A), 10 (B), 15 (C), and 20 (D) days after transplanting.
Table 1. Regression coefficients and R
2values calculated through regression analysis in the modified rectangular hyperbola model according to growth stage.
Parameter Regression coefficient R
2a b c
Photochemical efficiency
( µ molCO
2· µ mol
-1) 0.078 -0.025 0.958 Carboxylation conductance
(s
-1) -0.001 -23.220 24.083 0.871 Dark respiration
( µ molCO
2·m
-2·s
-1) -0.02 -29.030 198.864 0.999
angular hyperbola model. The modified rectangular hyper- bola model is expressed by Eq. 9. As light intensity increased, the canopy photosynthetic rate linearly increased. As the CO
2concentration increased, the canopy photosynthetic rate increased and gradually saturated. As the growth stage progressed, the maximum canopy photo- synthetic rate decreased, while the saturation pattern of the canopy photosynthetic rate with light intensity and CO
2concentration was maintained.
(9)
3. Validation of the Canopy Photosynthetic Rate Models For validation, the regression analysis result for the two models was plotted on the 1 : 1 line (Fig. 5). The R
2value and RMSE of the simple multiplication model was 0.923 and 2.114, and the R
2value and RMSE of the modified rectangular hyperbola model was 0.941 and 1.622, which was slightly higher than that of the simple multi- plication model. The canopy photosynthetic rates ranged from 2.5-23µmol·m
-2·s
-1for both measured and calculated values.
Discussion
The plant growth stage is considered important when constructing practical photosynthetic models because plants have different responses at different growth stages. Fresh weight and leaf area were used as indicators for classifica- tion into germination, vegetation, and reproduction stages (Mokhtarpour et al., 2010), and the photosynthetic rate was also used (Li et al., 2009; Kim et al., 2013). Although the classification of growth stages can vary depending on the characteristics of the plants, Lin (2001) reported that fresh weight was the most economic key element in classifying leaf vegetables. Therefore, it was appropriate to separate the growth stage of leaf vegetables by fresh weight in this study.
The R
2values of canopy photosynthetic rates obtained by using the developed models varied from 0.95 to 0.78 at each stage with slight overestimations (Fig. 4). This seems to be because the characteristics of the canopy structure were not sufficiently considered in the photosynthesis model (Monsi et al., 1973). Kim et al. (2016) indicated that the photosynthetic rate has a close relationship with the absorption, reflection, and penetration of light in the can- opy structure. Therefore, a more precise estimation of light interception by the canopy could increase the R
2values.
Olessen and Grevesen (1997) also reported that light extinction coefficients differed depending on plant type.
Previous research has indicated light extinction coeffi- cients of 0.63-0.86 for certain vegetables, such as tomato, cucumber, and paprika, and 0.40-0.65 for cauliflower. The light extinction coefficients depend on leaf and canopy conditions as well as environmental factors. Particularly in closed plant production systems, light interception signifi- cantly differs depending on the levels of light reflection and light diffusion.
P e
–0.025*t* 0.001*t (
2– 0.023*t + 0.024 )*I*C 0.013*t
2– 0.298*t + 0.309 – e
–0.025*t*I*C ---
=
0.020*t
2– 0.581*t 3.977
+ +
Fig. 3. Regressed photochemical efficiency (A), carboxylation
conductance (B), and dark respiration (C) with the modified
rectangular hyperbola model according to growth stage.
Among various environmental factors, light is the most influential variable in plant growth and development (Inada and Yabumoto, 1989). Due to the characteristics of the let- tuce, the higher the light intensity, the higher the growth
obtained (Pavlou et al., 2007). The increase in light intensity increased the nitrate reductase in lettuce and it should affect the photosynthesis (Gaudreau et al., 1995). In order to increase light utilization efficiency and improve crop productivity, light sources installed in plant factories should be designed in a form suitable for photosynthesis (Massa et al., 2008).
Some studies have developed the photosynthetic rate models and used the models to predict crop productivity (Kim and Lieth, 2012). In addition, the enrichment of CO
2concentration promotes the growth of lettuce (Caporn, 1989; Campbell et al., 1990). However, plant cultivation at saturation points of light intensity and CO
2concentration is economically inefficient. When the photosynthetic rate model of the crop has been established, the economic CO
2fertilization level can be determined. The modeling of pho- tosynthetic rates using light intensity and CO
2concentra- tion at each growth stage will be helpful in constructing strategic plant production systems. It is expected that the developed model will contribute to the determination of adequate CO
2concentration and light intensity conditions with growth stage in plant factories.
Fig. 4. Canopy photosynthetic rates of the lettuce expressed with the modified rectangular hyperbola model according to light intensity and CO
2concentration at 5 (A), 10 (B), 15 (C), and 20 (D) days after transplanting.
Fig. 5. Validation of the simple multiplication and modified rect-
angular hyperbola models by comparing measured and esti-
mated canopy photosynthetic rates.
Acknowledgements
This work was supported by the Korea Institute of Plan- ning and Evaluation for Technology in Food, Agriculture, Forestry and Fisheries (IPET) through the Agriculture, Food and Rural Affairs Research Center Support Program funded by the Ministry of Agriculture, Food and Rural Affairs (MAFRA; 717001-07-1-HD240).
Literature cited
Acock, B.C., J.H.M. Thornley, and J.W. Wilson. 1971. Photo- synthesis and energy conversion. In: Wareing P.F., Cooper, J.P. (Eds.), Potential crop production. Heinemmann Educa- tional Publishers, London, United Kingdom. pp. 43-75.
Acock, B.C. and L.H. Allen Jr. 1985. Crop responses to ele- vated carbon dioxide concentrations. In: Strain, B.R., and J.D. Cure. (Eds.), Direct effects of increasing carbon diox- ide on vegetation. US Department of Energy, Office of Energy Research, Office of Basic Energy Sciences, Carbon Dioxide Research Division. pp. 53-99.
Campbell, W.J., L.H. Allen, and G. Bowes. 1990. Response of soybean canopy photosynthesis to CO
2concentration, light, and temperature. J. Exp. Bot. 41: 427-433.
Caporn, S.J.M. 1989. The effects of oxides of nitrogen and carbon dioxide enrichment on photosynthesis and growth of lettuce (Lactuca sativa L.). New Phytol. 111: 473-481.
Farquhar, G.D., S. von Caemmerer, and J.A. Berry. 1980. A biochemical model of photosynthetic CO
2assimilation in leaves of C
3species. Planta 149: 78-90.
Gaudreau, L., J. Charbonneau, L.P. Vezina, and A. Gosselin.
1995. Effects of photoperiod and photosynthetic photon flux on nitrate content and nitrate reductase activity in green- house-grown lettuce. J. Plant Nutr. 18: 437-453.
Goudriaan, J., H.H. van Laar, H. van Keulen, and W. Louw- erse. 1985. Photosynthesis, CO
2and plant production. In:
Day, W., and R.K. Arkin. (Eds.), Wheat growth and model- ing, vol. 86 (NATO ASI Series A). Plenum Press, New York. pp. 107-122.
Green, C.F. 1987. Nitrogen nutrition and wheat growth in rela- tion to absorbed solar radiation. Agric. Forest Meteorol. 41:
207-248.
Hikosaka, K., T.O. Kumagai and A. Ito. 2016. Modeling can- opy photosynthesis. In: Canopy Photosynthesis: From basics to applications, Springer. pp. 239-268.
Inada, K. and Y. Yasumoto. 1989. Effects of light quality, day length and periodic temperature variation on the growth of lettuce and radish plants. Jpn. J. Crop Sci. 58: 689-694.
Jung, D.H., D. Kim, H.I. Yoon, T.W. Moon, K.S. Park, and J.E. Son. 2016. Modeling the canopy photosynthetic rate of romaine lettuce (Lactuca sativa L.) grown in a plant factory
at varying CO
2concentrations and growth stages. Hortic.
Environ. Biotechnol. 57: 487-492.
Jung, D.H., H.I. Yoon, and J.E. Son. 2017. Development of a three-variable canopy photosynthetic rate model of romaine lettuce (Lactuca sativa L.) grown in plant factory modules using light intensity, temperature, and growth stage. Protect.
Hortic. Plant Fact. 26: 268-275.
Kaitala, V., P. Hari, E. Vapaavuori, and R. Salminen. 1982. A dynamic model for photosynthesis. Ann. Bot. 50: 385-396.
Kim, J.H., J.W. Lee, T.I. Ahn, J.H. Shin. K.S. Park, and J.E.
Son. 2016. Sweet pepper (Capsicum annuum L.) canopy photosynthesis modeling using 3D plant architecture and light ray-tracing. Front. Plant Sci. 7: 1321.
Kim, S.H., J.H. Jeong, and L.L. Nackley. 2013. Photosyn- thetic and transpiration responses to light, CO
2, tempera- ture, and leaf senescence in garlic: Analysis and modeling.
HortScience 138: 149-156.
Kim, W.S. and J.H. Lieth. 2012. Simulation of year-round plant growth and nutrient uptake in Rosa hybrida over flow- ering cycles. Hortic. Environ. Biotechnol. 53: 193-203.
Kozai, T. 2013. Resource use efficiency of closed plant pro- duction system with artificial light: Concept, estimation and application to plant factory. Proc. Jpn. Acad., Ser. B 89:
447-461.
Leadley, P.W., J.F. Reynolds, R. Flagler, and A.S. Heagle.
1990. Radiation utilization efficiency and the growth of soy- beans exposed to ozone: a comparative analysis. Agric. For- est Meteorol. 51: 293-308.
Li, J., Z. Zou, and X. Wang. 2009. Effect of muskmelon leaf age on photosynthesis rate and other physiological parame- ters at different light density. Acta Hortic. 893: 785-790.
Li, K., Z. Li, and Q. Yang. 2016. Improving light distribution by zoom lens for electricity savings in a plant factory with light-emitting diodes. Front. Plant Sci. 7: 92.
Lin, W.C. 2001. Crop modelling and yield prediction for greenhouse-grown lettuce. In: IV International symposium on models for plant growth and control in greenhouses:
modeling for the 21st century -agronomic and greenhouse crop models. pp. 159-164.
Massa, G.D., H.H. Kim, R.M. Wheeler, and C.A. Mitchell.
2008. Plant productivity in response to LED lighting. Hort- Science 43: 1951-1956.
Mills, E. 2012. The carbon footprint of indoor cannabis pro- duction. Energy Policy 46: 58-67.
Mokhtarpour, H., C.B. Teh, G. Saleh, A.B. Selamat, M.E. Asadi, and B. Kamkar. 2010. Non-destructive estimation of maize leaf area, fresh weight, and dry weight using leaf length and leaf width. Commun. Biometry Crop Sci. 5: 19-26.
Monsi, M. 1960. Dry-matter reproduction in plants 1. Sche- mata of dry-matter reproduction. Bot. Mag. 861: 81-90.
Niinemets, Ü. 2016. Leaf age dependent changes in within- canopy variation in leaf functional traits: a meta-analysis. J.
Plant Res. 129: 313-338.
Olesen, J.E. and K. Grevsen. 1997. Effects of temperature and irradiance on vegetative growth of cauliflower (Brassica oleracea L. botrytis) and broccoli (Brassica oleracea L. ital- ica). J. Exp. Bot. 48: 1591-1598.
Pavlou, G.C., C.D. Ehaliotis, and V.A. Kavvadias. 2007. Effect of organic and inorganic fertilizers applied during succes- sive crop seasons on growth and nitrate accumulation in let- tuce. Sci. Hortic. 111: 319-325.
Perez-Peña, J. and J. Tarara. 2015. A portable whole canopy gas exchange system for several mature field-grown grape- vines. VITIS - J. Grapevine Res. 43: 1-7.
Shimizu, H., M. Kushida, and W. Fujinuma. 2008. A growth
model for leaf lettuce under greenhouse environments.
Environ. Cont. Biol. 46: 211-219.
Takahashi, N., P.P. Ling, and J.M. Frantz. 2008. Consider- ations for accurate whole plant photosynthesis measure- ment. Environ. Cont. Biol. 46: 91-101.
Thornley, J.H.M. 1974. Light fluctuations and photosynthesis.
Ann. Bot. 38: 363-373.
Thornley, J.H.M. 1976. Mathematical models in plant physiol- ogy: A quantitative approach to problems in plant and crop physiology. Academic Press, London. p. 318.
광도, CO 2 농도 및 정식 후 생육시기에 따른 식물공장 재배 상추의 군락 광합성 모델 확립
정대호 1,† , 김태영 1,† , 조영열 2 , 손정익 1, *
1
서울대학교 식물생산과학부
2