NFT 수경재배 방식의 식물공장에서 생육단계별 실시간 작물 생체중 정밀 측정 방법
김지수1, 강우현1, 안태인1, 신종화2, 손정익1*
1
서울대학교 식물생산과학부 및 농업생명과학연구원
2
안동대학교 원예육종학과
Precise, Real-time Measurement of the Fresh Weight of Lettuce with Growth Stage in a Plant Factory using a Nutrient Film Technique
Ji-Soo Kim1, Woo Hyun Kang1, Tae In Ahn1, Jong Hwa Shin2, and Jung Eek Son1*
1
Department of Plant Science and Research Institute of Agriculture and Life Sciences, Seoul National University, Seoul 151-921, Korea
2
Deparment of Horticulture and Breeding, Andong National University, Andong 760-749, Korea
*Corresponding author: [email protected]
Abstract
The measurement of total fresh weight of plants provides an essential indicator of crop growth for monitoring production. To measure fresh weight without damaging the vegetation, image- based methods have been developed, but they have limitations. In addition, the total plant fresh weight is difficult to measure directly in hydroponic cultivation systems because of the amount of nutrient solution. This study aimed to develop a real-time, precise method to measure the total fresh weight of Romaine lettuce (Lactuca sativa L. cv. Asia Heuk Romaine) with growth stage in a plant factory using a nutrient film technique. The total weight of the channel, amount of residual nutrient solution in the channel, and fresh shoot and root weights of the plants were measured every 7 days after transplanting. The initial weight of the channel during nutrient solution supply (Wi) and its weight change per second just after the nutrient solution supply stopped were also measured. When no more draining occurred, the final weight of the channel (Ws) and the amount of residual nutrient solution in the channel were measured. The time constant (τ) was calculated by considering the transient values of Wi and Ws. The relationship of Wi, Ws, τ, and fresh weight was quantitatively analyzed. After the nutrient solution supply stopped, the change in the channel weight exponentially decreased. The nutrient solution in the channel slowly drained as the root weight in the channel increased. Large differences were observed between the actual fresh weight of the plant and the predicted value because the channel included residual nutrient solution.
These differences were difficult to predict with growth stage but a model with the time constant showed the highest accuracy. The real-time fresh weight could be calculated from Wi, Ws, and τ with growth stage.
Received: August 25, 2015 Revised: September 24, 2015 Accepted: January 25, 2016
Copyrightⓒ 2016 Korean Society for Horticultural Science.
본 연구는 농림수산식품기술기획평가원(iPET) 첨단생 산기술개발사업(310002-3)의 지원에 의해 수행되 었음
Korean J. Hortic. Sci. Technol. 34(1):77-83, 2016 http://dx.doi.org/10.12972/kjhst.20160007
pISSN : 1226-8763
eISSN : 2465-8588
Additional key words: drain, residual nutrient solution, romaine lettuce, root weight, time constant
서 언
식물공장에서는 체계적인 계획생산을 위해서는 작물의 생육 및 품질 관리를 위하여 작물 정보를 실시간으로 수집하는 것이 필요하며, 생체중은 작물의 생육 상태나 상대생장율을 파악할 수 있는 중요한 지표이다. 그러나 전통적 방법으로 재배하던 작물을 직접 수확하여 측정한다면 가장 단순하고 정확할 수 있으나, 작업 시간과 노동이 필요하고 작물을 파괴해야 하는 단점 이 있다(
Yeh et al
.,2014
).또한 작물의 파괴적 측정은 연속적인 개별 작물의 생육을 측정할 수 없을 뿐만 아니라 많은 반복수도 필요하기 때문에 이미 지 처리를 통한 비파괴 조사방법이 제시되어 왔다(
Tackenberg
,2007
). 상추의 경우 지표면을 덮은 작물 면적의 비율로 건물중 을 추정하거나(Van Henten and Bontsema
,1995
), 분광 식생 지수를 이용하여 수확량을 예측(Kizil et al
.,2012
), 시각적 방법을 이용하여 옆면적 지수를 추정하는(Sanmann et al
.,2013
) 연구가 수행되었다.그러나 작물의 이미지를 얻기 위해선 작물과 영상 장비 사이에 일정 거리 이상을 확보해야 하고, 작물과 배경색의 차이가 분명하지 않을 경우에 이미지 분석에 제한을 줄 수 있기 때문에(
Bumgarner et al
.,2012
), 다단 밀식 재배 방식과 특정 파장대의LED
를 사용하는 식물공장 내에서의 사용은 상당한 제약이 따른다.Smolders et al
.(1991
)은 담액식 수경재배에서 실시간 지상부 생육 상태를 모니터링 하는 연구에서 지하부의 부력을 무시한 작물의 평균 생체중을 지지대와 연결된 저울을 이용하여 실시간으로 측정할 수 있었다. 그러나 이러한 방식은 그 구조의 복잡 함과 설치의 번거로움 때문에 식물공장과 같은 생산시스템에는 적합하지 않다.식물공장 내에 적용 가능한 수경재배 방식 중
NFT
방식(Puetra et al
.,2007
;Sheikh
,2006
)이 있지만 지금까지 채널 내의 수위가 변화되는 이 시스템에서 작물의 총 생체중을 연속적으로 추정하는 결과는 수행되지 않았다. 본 연구의 목적은 식물공 장에 적합한NFT
수경재배 방식에서 채널의 중량 변화를 실시간으로 측정하여 채널당 작물의 생체중을 예측하는 것이다.재료 및 방법
작물재배 및 환경조건
서울대학교 식물공장에서 아시아 흑로메인 상추(
Lactuca sativa L
.cv
.Asia Heuk Romaine
,Asia Seed Company
,Seoul
,Korea
)를 재배하며 실험을 진행하였다. 먼저 상추 종자를 담액방식의 육묘시스템에 스펀지 배지를 이용해 파종하여 형광등(
FL40EX
-D
,Sigma lamp
,China
) 아래에서 발아시켰다. 파종2
주 후NFT
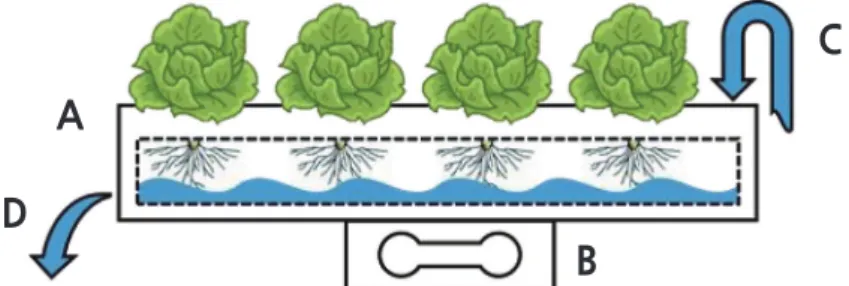
방식의 수경재배 채널(Fig . 1 )에 4
개체씩 정식하여Fig. 1. A schematic side view of one channel with a load-cell for measuring the weight: NFT channel (A), load-cell (B), nutrient
solution supply (C), and drain (D).
A D
B
C
R
:B
:W
=8
:1
:1
비율의LED
광원을 이용하여 명기16
시간 동안 광도150μmol
ㆍm
-2ㆍs
-1 하에서 재배하였다. 재배 중 식물공장 내 환경조건은 온도22
°C
, 상대습도70
%, 이산화탄소 농도400ppm
을 유지하였고, 양액으로는EC 1
.2ds
ㆍm
-1인 야마자키 양액 을 공급하였다. 동시에 채널 아래에 설치된 로드셀(JBCL
-6L
,BJtech
,South Korea
)을 통하여 채널의 중량 변화를 실시간으로 측정하였다.측정 항목
정식 후 일주일 간격으로
28
일간 채널의 총 무게, 채널 안의 양액의 중량, 상추의 생체중을 측정하였다. 로드셀을 이용하여 양액이 흐르고 있을 때의 채널 전체의 중량(Wi
)과 양액 중단 시점을 영점으로 설정하여 채널 안의 양액이 배수되면서 발생하 는 중량 변화를 매초 단위로 측정하였다. 채널을 통한 배액이 더 이상 발생하지 않는다고 판단 될 때의 채널의 중량(Ws
)을 측정 하였다. 채널 내에 잔류된 양액의 양은 채널을 외부로 들어낸 후에 수동으로 측정하였고 한 채널 당4
개의 상추를 모두 수확하 여 지상부와 지하부로 구분하여 생체중을 측정하였다.생체중 추정방법
양액 중단 후 채널의 중량 변화
W
(t
)는 채널 내부의 양액의 중량에 비례할 것으로 예상되어 지수감소 함수를 이용하였다(Eq .
1 ). 매주 측정한 채널의 매초 중량 변화를 SPSS
(IBM
,NY
,USA
)를 이용하여Eq . 1
에 대하여 비선형회귀분석을 실시하였고,지수감소의 속도를 나타내는 시상수(
τ
,time constant
)를 구하였다. 이 시상수는 채널내의 물리적 환경 변화를 반영하리라 기대 되었다.W
(t
) = (W
i -W
s) *exp
(-t / τ
) +W
s (Eq
.1
)이후 비파괴적으로 측정된 초기 채널의 중량, 양액 중단 후 채널의 중량, 시상수와 이를 이용하여 예측하고자 하는 작물의 생체중 사이의 관계를 정량적으로 분석하였다.
결과 및 고찰
양액 중단 후 채널의 무게변화
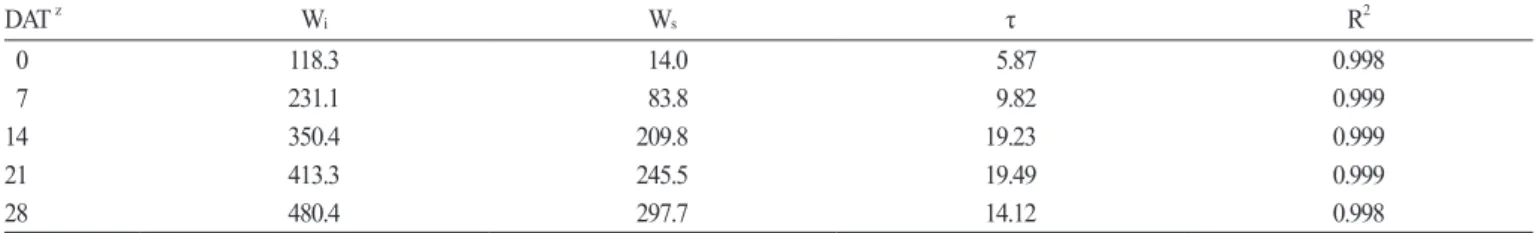
양액 중단 후 채널의 중량 변화폭이 시간에 따라 감소하는 경향을 보였다
( Fig . 2 ). 지수감소 모델에 의한 비선형 회귀분석 결
과, 모든 측정값에 대해서 높은 수준의R
2 값을 보였다( Table 1 ). 채널을 통하여 양액이 공급 중일 때의 중량 Wi
와 더 이상 배액Table 1. Calculated parameters of the initial weight of the channel while being supplied with nutrient solution (Wi), the final weight of the
channel (Ws) after draining of the nutrient solution stopped, the time constant (τ), and R
2of Eq. (1).
DAT
zW
iW
sτ R
20 118.3 114.0 15.87 0.998
7 231.1 183.8 19.82 0.999
14 350.4 209.8 19.23 0.999
21 413.3 245.5 19.49 0.999
28 480.4 297.7 14.12 0.998
z
DAT, days after transplanting.
이 발생하지 않을 때의 중량
Ws
는 재배 후반기로 갈수록 증가하였다. 시상수의 경우 빈 채널의 결과를 포함하여 작물의 생육 이 진전됨에 따라 증가하였고 이는 채널내의 중량 변화 속도가 감소했다는 의미이므로, 채널 내 지하부의 증가로 인한 내부의 물리적 환경 변화라고 해석할 수 있다. 그러나 정식 후28
일의 시상수는14
일의 경우보다 낮게 추정되었는데, 지하부의 노화에 의한 결과라 추측되나 이를 규명하기 위해서는 추가적인 연구가 필요할 것으로 판단된다. 본 실험에서 채널을 통한 배액이 더 이상 발생하지 않는 시점이 양액 중단 후 약1
분이 지난 후이기 때문에, 수분 스트레스에 의한 작물의 생리 장해에 영향을 주지 않았을 것이라 판단된다(Zolnier et al
.,2004
).생육단계 별 채널 내 양액 잔류량
양액 공급을 중단한 후에 중량 변화가 일어나지 않을 때의 채널의 중량을 채널에 정식한 상추의 수로 나눈
Ws
/4
는 실제 파괴 조사를 통하여 측정한 한 채널 당 상추4
주의 평균 지상부 생체중과는 많은 차이가 있었다(Fig . 3A ). 생육 초기인 정식 후 7
일째에Ws
/4
는 실제 생체중 보다4
배이상 차이가 났으며 생육이 진행됨에 따라 이 비율은 줄어들었지만 실제 생체중과 약30g
이상의 차이가 발생하였다. 이는 채널에 잔류하는 양액(지하부가 머금고 있는 양액)과 지하부의 중량 때문에 생긴 차이 이므로 단순히 로드셀을 통하여 채널의 중량을 측정하는 것은 실제 작물의 생체중을 과대 평가하게 된다. 실제 생체중을 정확히 추정하기 위해서는Ws
/4
에서 이러한 차이를 고려해야 하며, 생육 단계의 지하부의 생육과 관계가 있는 것으로 예상하였다.그러나 지하부의 중량은 생육 단계에 따라서 증가하였으나, 채널 내의 잔류 양액량은 생육 시기에 따라 어떤 경향을 나타내지 않았고 편차가 심하였다
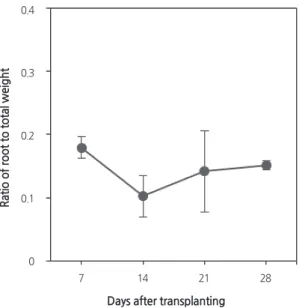
( Fig . 3B ). 전체 생체중에 대한 지하부의 중량비는 생육이 증가함에 따라 0
.15
근처에 머물렀다(Fig . 4 ).
식물공장 내 광질과 같은 재배 환경에 따라 지상부와 지하부의 비율은 조금씩 다르지만(
Lee at al
.,2015
;Johkan et al
.,2010
), 생육이 증가하면서 일정한 값을 가지므로 지하부와 관련된 지표를 간접적으로 측정할 수 있다면 실제 이용 부분인 지상부의 생체중을 추정할 수 있다.생체중 추정
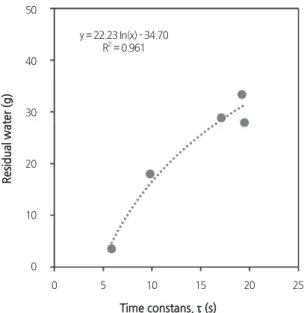
채널 내 지하부로 인한 물리적 환경변화를 반영하는 시상수와 이러한 오차를 회기 분석 해본 결과
R
2 =0
.94
선형 상관관계 를 나타내었다( Fig . 5 ). 이 결과는 위에서 언급한 생육시기에 따른 모델보다 예측 정도가 높았다. 시상수와의 선형관계 식을
근거로Ws
/4
와 채널 당 한 작물의 평균 생체중을 계산할 수 있는 다음 식을 도출하였다.Fig. 2. Change in the total weights of plant, nutrient solution, and channel [W(t)] with time just after the supply of nutrient
solution stopped. DAT indicates the days after transplanting.
w/o plants DAT 7 DAT 14 DAT 21 DAT 28 600
500
400
300
200
100
0
0 10 20 30 40 50 60
W eight (g)
Time (s)
Fig. 3. Comparisons of estimated fresh weight of one plant (Ws/4) and measured value (A) and residual water and fresh root
weights (B). Ws is the final weight of the channel after the draining of nutrient solution stopped. The weight at day 0 after transplanting means the channel weight without plants. Vertical bars indicate standard deviation for 4 samples.
Ws/4 Total fresh weight
Residual water Root 100
80
80 60
60 40
40 20
20 0
0
0 7 14 21 28
W eight (g) W eight (g)
Days after transplanting
A
B
100
Fig. 4. Ratio of root weight to total weight with growth stage. Vertical bars indicate standard deviation for four samples.
0.4
0.3
0.2
0.1
0
7 14 21 28
Ratio of root to total weight
Days after transplanting
FW
= Ws/ 4
-22
.23
*ln
(τ
) +34
.70
(Eq
.2
)Eq . 2
를 이용하여 추정한 생체중과 파괴조사를 통하여 측정한 생체중을 비교해본 결과R
2 =0
.86
인 선형관계를 보였다(Fig .
6 ). 이 결과를 이용하여 식물공장 모듈에서 로메인 상추를 재배할 때, 실시간으로 τ
를 계산하며 작물의 생체중을 예측할 수 있다.
NFT
방식의 다른 식물공장 모듈이나 다른 작물을 재배 할 때에는 한 작기 동안 파괴조사를 통하여Eq . 2
와 같은 형태인τ
와 생체중과의 관계식을 얻어야 하지만, 이는 비파괴 측정방법을 구축하는데 있어 필수적인 과정이다(Bumgarner et al
.,2012
;Tackenberg
,2007
;Van Henten and Bontsema
,1995
). 본 연구에서는 이러한 실시간 측정 방법론 개발에 중점을 두었고, 검증 Fig. 5. Relationship between time constant (τ) and the residual water (Ws/4 - measured total fresh weight).50
40
30
20
10
y = 22.23 In(x) - 34.70 R
2= 0.961
0
5
0 10 15 20 25
Residual water (g)
Time constans, τ (s)
Fig. 6. Comparison of the measured fresh shoot weight and the estimated value by using Eq. (2).
60
50
40
30
20
10
Y = X R
2= 0.864
0
10
0 20 30 40 50 60
Calculated fresh weight
Measured fresh weight
을 위하여 적은 수의 샘플이 사용되었지만, 추후 동일 시스템 내에서 계속적으로 사용하고 여러 작기가 반복되어 관련 데이터 가 증가할수록 관계식은 더욱 정교해지기 때문에, 식물공장 내의 생산량 예측에 활용할 수 있을 것으로 생각한다. 또한 생육시 기에 따른 모델이 아닌 간접지표를 비파괴적으로 측정하여 이용한 모델은 범용성이 더 있으리라 기대된다.
초 록
생체중은 작물 생육의 중요한 지표이기 때문에 계획 생산을 위해서는 반드시 측정이 필요하다. 비파괴적으로 생체중을 측정 하기 위하여 이미지 기반의 방법 들이 개발되어 왔으나 한계점을 가지고 있다. 또한 수경재배에서는 양액의 중량 때문에 작물 생체중을 직접 측정하기에 어려움이 있다. 본 연구의 목적은
NFT
방식의 식물공장에서 생육시기에 따른 생체중을 실시간으 로 정확하게 측정할 수 있는 방법을 개발하는 것이다. 식물공장 모듈에서 로메인 상추를 재배하며 실험을 진행하였다. 정식 후7
일 간격으로28
일 까지 전체 채널의 중량, 채널 내에 남아 있던 양액의 양, 로메인 상추의 지상부와 지하부의 생체중을 측정하 였다. 특히, 양액이 공급 중일 때 채널의 초기 무게(Wi
)와 양액 공급을 중단한 후에 채널의 중량 변화를 매초 간격으로 측정하 였다. 채널을 통해 더 이상의 배액이 발생하지 않을 때, 채널의 최종 중량(Ws
)와 채널에 잔류하고 있는 양액의 양을 측정하였 다. 시상수(τ
)는Wi
와Ws
의 변화 추세를 고려하여 계산되었다.Wi
,Ws
,τ
와 실제 생체중과의 관계를 정량적으로 분석하였다.양액 공급을 멈춘 뒤 채널의 중량은 지수적으로 감소하였다. 채널 내 지하부의 중량이 증가하면서 양액이 채널을 빠져나가는 속도는 감소하였다. 실제 작물의 생체중과 채널의 중량을 통하여 예측된 생체중 사이에는 큰 차이가 있었고, 이는 채널 내에 잔류된 양액 때문이다. 이러한 차이는 생육시기에 따라 예측하기에는 어려웠으나 시상수를 이용한 모델식은 높은 예측성을 보 였다.
Wi
,Ws
,τ
를 사용한 모델을 이용하면 작물의 실제 생체중을 추정할 수 있으리라 기대된다.추가 주요어 : 배액, 잔여 양액, 로메인 상추, 뿌리 중량, 시상수
Literature Cited
![Fig. 2. Change in the total weights of plant, nutrient solution, and channel [W(t)] with time just after the supply of nutrient solution stopped](https://thumb-ap.123doks.com/thumbv2/123dokinfo/5218740.615905/4.892.330.646.102.364/change-weights-nutrient-solution-channel-nutrient-solution-stopped.webp)