Introduction
Efficient environment control by understanding the crop growth rate is an important factor for planned crop production in plant factories (Mills, 2012). A photosynthetic rate that is closely affected by environmental factors is a common index to predict crop growth rate (Kim and Lieth, 2003;
Pastenes et al., 2003). Although leaf photosynthetic rate is used to understand the photosynthetic rate of an entire plant (Shipp et al., 1998; Flexas et al., 2007; Kaipiainen and Pelkonen, 2007; Chang et al., 2009; Shin et al., 2011), it is not always representative (Elmore, 1980; Evans, 1996). To estimate accurate crop growth, more reliable photosynthetic models based on canopy photosynthetic rates are needed.
For investigating crop photosynthesis, several environmental
factors, such as light intensity and CO2 concentration, have been studied (Caporn and Wood, 1990; Wagner and Reicosky, 1992; Wheeler, 1992; Steduto et al., 2002; Song et al., 2016).
Lettuce is a model crop that has been studied in various environmental conditions within a plant factory due to its short cultivation periods (Carporn, 1989; Shimizu et al., 2008). Due to the complex effects of environmental factors in the establishment of photosynthesis models (Johnson et al., 2010), photosynthetic rates should be measured under all combinations of environmental factors. For this reason, an effective measurement method considering system reactions to plants should be used while varying environmental factors (Mcdermitt et al., 1989; Suh et al., 2006).
In general, growth chambers have been used to grow or store plants for research purposes (Wheeler et al., 1996;
Austin et al., 2016; Inkham et al., 2019) and to estimate photosynthetic or respiration rates of crops by measuring CO2 concentration (Wheeler, 1992; Rochette et al., 1997).
However, few studies have been conducted to calculate
An Efficient Method for Establishing Canopy Photosynthesis Curves of Lettuce (Lactuca sativa L.) with Light Intensity and CO2 Concentration
Variables Using Controlled Growth Chamber
Dae Ho Jung†, Tae Young Kim†, and Jung Eek Son*
Department of Plant Science and Research Institute of Agriculture and Life Sciences, Seoul National University, Seoul 08826, Korea
Abstract. For developing a canopy photosynthesis model, an efficient method to measure the photosynthetic rate in a growth chamber is required. The objective of this study was to develop a method for establishing canopy photosynthetic rate curves of romaine lettuce (Lactuca sativa L.) with light intensity and CO2 concentration variables using controlled growth chamber. The plants were grown in plant factory modules, and the canopy photosynthesis rates were measured in sealed growth chambers made of acrylic (1.0 x 0.8 x 0.5 m). First, the canopy photosynthetic rates of the plants were measured, and then the time constants were compared between two application methods: 1) changing light intensity (340, 270, 200, and 130 μmol·m-2·s-1) at a fixed CO2 concentration (1,000 μmol·mol-1) and 2) changing CO2 concentration (600, 1,000, 1,400, and 1,800 μmol·mol-1) at a fixed light intensity (200 μmol·m-2·s-1). Second, the canopy photosynthetic rates were measured by changing the light intensity at a CO2 concentration of 1,000 μmol·mol-1 and compared with those measured by changing the CO2 concentration at a light intensity of 200 μmol·m-2·s-1. The time constant when changing the CO2 concentration at the fixed light intensity was 3.2 times longer, and the deviation in photosynthetic rate was larger than when changing the light intensity. The canopy photosynthetic rate was obtained stably with a time lag of one min when changing the light intensity, while a time lag of six min or longer was required when changing the CO2 concentration. Therefore, changing the light intensity at a fixed CO2 concentration is more appropriate for short-term measurement of canopy photosynthesis using a growth chamber.
Additional key words : CO2 consumption, photosynthetic photon flux density, photosynthetic rate, romaine, time constant
DOI https://doi.org/10.12791/KSBEC.2020.29.1.43 eISSN 2288-100X
†These authors equally contributed to this work.
*Corresponding author: [email protected]
Received December 03, 2019; Revised January 14, 2020;
Accepted January 16, 2020
photosynthesis rate by measuring changes in CO2 concen- tration while changing environmental factors inside the chamber. Previous attempts to measure canopy photosynthesis of plants using an open chamber system have been made, but there have been many disadvantages affected by airflow (Garcia et al., 2009). Quantitative analysis of environmental factors most affecting photosynthesis is required when several environmental factors change. In the photosynthetic process of plants, light has a fast reaction rate because it produces an immediate energy capture reaction through electron transfer in microsecond (Rappaport et al., 1998), while CO2 has a slow reaction rate as it undergoes the process of diffusing into the cell through stomata (Evans and von Caemmerer, 1996). When combining the two factors of CO2 concentration and light intensity, it is necessary to determine which should be held constant and which should be changed.
The objective of this study was to formulate a method for establishing canopy photosynthetic rate curves of romaine lettuce (Lactuca sativa L.) in a controlled growth chamber.
Materials and Methods
1. Plant and Growth Conditions
Romaine lettuce (Lactuca sativa L., cv. Asia Heuk Romaine) was hydroponically grown in a plant factory module of Seoul National University. Yamazaki nutrient solutions (Yamazaki, 1982) with an electrical conductivity (EC) of 1.2 dS·m-1 were used in deep-flow technique systems. The
photosynthetic photon flux density in the module was maintained at 200 μmol·m-2·s-1 with an 8:1:1 ratio of RBW light-emitting diodes (LEDs; FGL-B1200, FC Poibe Co., Ltd., Seoul, Korea). The inside temperature, CO2 concentration, and relative humidity were maintained at 23-25°C, 700- 1,000 μmol·mol-1, and 65-75%, respectively. Wind speeds around the plants were controlled using an electronic fan at 0.3-0.5 m·s-1. One hundred plants were transplanted into the plant factory module at three weeks after sowing and grown for 20 days at a planting density of 16 plants·m-2.
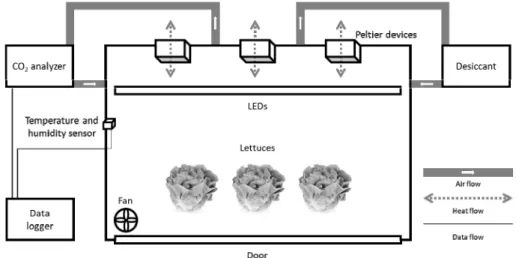
2. Controlled Growth Chamber for CO2 Measurement Three identical closed acrylic chambers (1.0 × 0.8 × 0.5 m) with adjustable light intensity, temperature, relative humidity, and wind velocity were used for plant growth and CO2 measurement (Fig. 1). The same LEDs used in the plant factory module were installed. For environmental control, sensors for CO2 concentration, temperature, and relative humidity (S-VT200B, Soha Tech. Seoul, Korea) were installed.
Indoor temperature and wind velocity were maintained at 19.5-22.5°C and 0.3-0.4 m·s-1, respectively. To scrub the moisture generated by transpiration, silica-gels were used to maintain the relative humidity at 65-75%. The CO2 concen- tration in the chamber was measured for 90 min with and without plants at an initial CO2 concentration of 1,000 μmol·
mol-1 using a CO2 analyzer (LI-820, LI-COR, Lincoln, NE, USA). After moving inside air out of the chamber by pump for measurement, the air passed through the sensor was circulated back into the chamber to prevent air leakage
Fig. 1. Schematic diagram of a controlled growth chamber with Peltier devices for temperature control and a fan for wind speed control.
during measurement. The ventilation number in the chamber was calculated using the following formula:
ln (1)
where is the ventilation number (h-1), is the measurement time (h), is the initial CO2 concentration (μmol·mol-1), is the outside CO2 concentration (μmol·mol-1), and is the measured CO2 concentration at hour (μmol·mol-1). All measured data were stored via a data logger (CR-1000, Campbell Scientific, Logan, UT, USA).
3. Comparison of Plant Response to Light Intensity or CO2 Concentration Change (Exp 1)
The changes in light intensity and CO2 concentration were compared in two treatments. In Treatment 1, light intensity was adjusted to 340, 270, 200, and 130 μmol·m-2·s-1 at a fixed CO2 concentration of 1,000 μmol·mol-1. In Treatment 2, CO2 concentration was adjusted to 600, 1,000, 1,400, and 1,800 μmol·mol-1 at a fixed light intensity of 200 μmol·m-2· s-1. The CO2 consumption was measured in 1 s intervals and saved in 5 s intervals. Whole canopy photosynthetic rates in Treatments 1 and 2 were compared at the same light intensity and CO2 concentration.
The response of the growth chamber system was estimated using a time constant measured as the time required to reach 63.2% of the target value (Gross and Chabot, 1979):
(2)
where , , , and are the mean target value, mean time (s), time constant, and target value after time , respectively.
4. Comparison of Photosynthetic Rate at Light Intensity or CO2 Concentration Change (Exp 2)
For further measurement of low light points with rapid change in photosynthetic rate and for additional measurement of high CO2 concentration points for estimating saturation points, additional conditions for light intensity and CO2 concentration were applied to each treatment. In Treatment 1 in Exp 2, the environmental conditions were applied
identically to Treatment 1 in Exp 1 (340, 270, 200, and 130 μmol·m-2·s-1), but 60 μmol·m-2·s-1 light intensity was added.
In Treatment 2 in Exp 2, the environmental conditions were applied identically to Treatment 2 in Exp 1 (600, 1,000, 1,400, and 1,800 μmol·mol-1), but 2,200 μmol·mol-1 CO2 concentration was added.
The canopy photosynthetic rate was calculated by measuring CO2 decrement for all conditions excluding the time lag identified in Exp 1. The time lag was divided into one min and six min intervals, and each canopy photosynthetic rate was calculated to confirm the response of the plants to the changes in light intensity and CO2 concentration. The experiment was repeated three times. For comparison, the leaf photosynthetic rate was measured at the same conditions as for Treatment 1.
A photosynthetic measurement system (LI-6400, LI-COR, Lincoln, NE, USA) was used for measurement, and three different measurements were repeated with different leaves.
To compare the difference in canopy photosynthetic rate at fixed light intensity and CO2 concentration between the two treatments, the canopy photosynthetic rates were calculated.
In Exp 2, the same time lag calculated in Exp 1 was applied to each environmental factor.
Results and Discussion
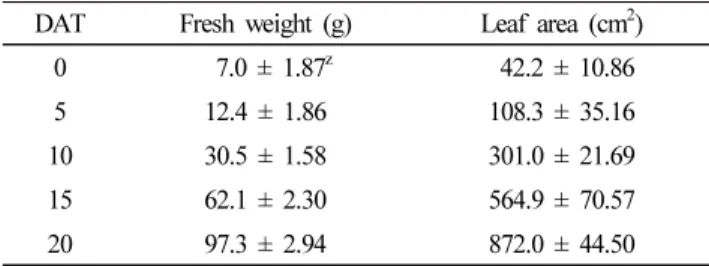
1. Fresh Weight and Leaf Area according to Growth Stage Both fresh weight and leaf area exponentially increased over time. The number of growth stages was five during the 25 day-growth period. Since leaf area and fresh weight did not show much increase from zero to five days after transplanting (DAT), and significant growth was recorded from day 6 to the last day of observation (20 DAT), stages 2, 3, and 4 were classified in five-day intervals. As growth stage progressed,
Table 1. Fresh weight and leaf area of the lettuce at 0 to 20 days after transplanting (DAT).
DAT Fresh weight (g) Leaf area (cm2)
0 7.0 ± 1.87z 42.2 ± 10.86
5 12.4 ± 1.86 108.3 ± 35.16
10 30.5 ± 1.58 301.0 ± 21.69
15 62.1 ± 2.30 564.9 ± 70.57
20 97.3 ± 2.94 872.0 ± 44.50
zMean of 15 replicates ± SD.
fresh weight and leaf area of the lettuce exponentially increased and reached 97.3 ± 2.94 g and 872.0 ± 44.50 cm2 at 20 DAT, respectively (Table 1).
2. Leakage of the Growth Chamber
For testing leakage of the chamber, CO2 concentration decrement was measured with and without plants while maintaining similar environmental conditions (i.e., 1,010 μ mol·mol-1 CO2 concentration, temperature, and humidity at the same condition, and similar light spectrum). The CO2 concentration after 5,000 sec without plants was 1,010 μmol·
mol-1 (Fig. 2). The calculated ventilation number of the chamber using Eq. 1 was 0.039 h-1. According to Wheeler (1992), leakage rate increases as chamber size increases.
Due to the reasons stated above, closed growth chambers in the past have been manufactured in small sizes of 0.19 m3 (Dutton et al., 1988), 0.3 m3 (Knight et al., 1988), and 0.2 m3 (Schwartzkopf and Stofan, 1981). The 0.4 m3 chamber used in this study confirmed that CO2 concentration measurements were adequately carried out. In measurement experiments lasting seven hours or more, there will arise a problem in calculating the canopy photosynthetic rates of lettuce due to chamber leakage. When measuring CO2 consumption for longer periods, CO2 leakage before and after the experiments should be calculated and considered in calculations of canopy photosynthetic rate. In addition, for photosynthesis measurements using custom chambers, it is recommended that the measurements be completed in a short period of time, changing the environ- mental factors of rapid response.
3. Measurement of Crop CO2 Consumption and Time Constant
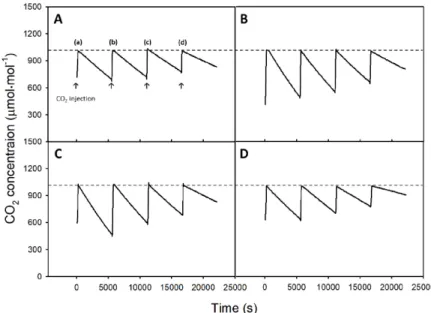
Figs. 3 and 4 show the measured CO2 concentrations in Treatments 1 and 2 of Exp 1, respectively. The decrease in CO2 concentration in the chamber by photosynthesis became greater as light intensity increased (Fig. 3). Similar trends
Fig. 3. Change in CO2 concentration according to light intensity of 340 (a), 270 (b), 200 (c), and 130 (d) µmol·m-2·s-1 at a CO2 concentration of 1,000 µmol·mol-1. A, B, C, and D denote 5, 10, 15, and 20 days after transplanting, respectively.
Fig. 2. CO2 concentration changes within the growth chamber with and without plants.
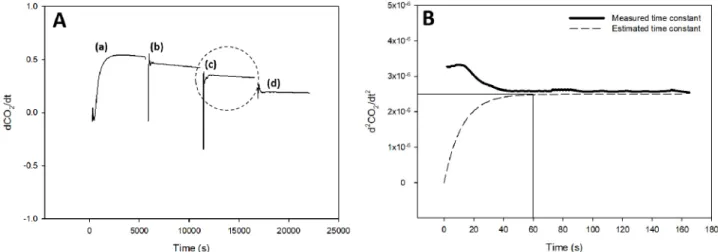
were observed when a set point of CO2 concentration became higher, but the decreasing slope in CO2 concentration appeared smaller than the previous case shown in Fig. 3 (Fig. 4). For each condition, the change in second derivative of CO2 concentration was used to calculate the time lag (Fig. 5). A time constant at a light intensity of 200 μmol·m-2·s-1 [case (c) in Fig. 5A] was 60 s (Fig. 5B). Time constants observed for different environmental conditions varied, but the average time constant in Treatment 1 (at fixed CO2 concentration with varied light intensity) was 3.24 times shorter than that
in Treatment 2. This result can be interpreted as lettuce being more sensitive to changes in light intensity than CO2 concentration. The time formula in Fig. 5B is as follows:
(3)
Langensiepen (2012) stated that the response time for plant adjustment will be different for each condition in an artificially-controlled environment. Bazot (2008) indicated that CO2 concentration changes in the atmosphere bring
Fig. 4. Change in CO2 concentration according to CO2 concentrations of 600 (a), 1,000 (b), 1,400 (c), and 1,800 (d) µmol·mol-1 at a light intensity of 200 µmol·m-2·s-1. A, B, C, and D denote 5, 10, 15, and 20 days after transplanting, respectively.
Fig. 5. Slopes of CO2 concentration in Treatment 1: the changes in first derivatives of CO2 concentration at a light intensity of 340 (a), 270 (b), 200 (c), and 130 (d) µmol·m-2·s-1 with a fixed CO2 concentration of 1,000 µmol·mol-1 at 10 days after transplanting, respectively (A) and the change in second derivative of CO2 concentration in case (c) of A (B).
about a complex response in plant physiology. As shown in Figs. 4A to 4D, an average of 550 μmol·mol-1 CO2 gas was injected for 5 min in all treatments of Treatment 2. The sharp change in CO2 concentration in the chamber within a short period of time (10 min) requires sufficient response time for the plants to adapt to the new environment. Sestak (1971) argued that it would take over one hour for plant stoma to fully adjust to changes in CO2 concentration. To obtain various plant responses depending on CO2 concentration, sufficient measurement time is required.
4. Comparison of Canopy Photosynthetic Rates at the Same Environmental Conditions
Fig. 6 shows the result of Exp 2. The photosynthetic rates measured at one and six min time lags were compared. The photosynthetic rates in Treatments 1 and 2 increased with increasing light intensity and CO2 concentration, respectively.
The deviation in Treatment 2 was larger than that in Treatment 1. In addition, differences in leaf photosynthetic rate and canopy photosynthetic rate increased with increasing light intensity and CO2 concentration. The leaf photosynthetic rate according to light intensity appeared in the form of a typical saturation curve, but the canopy photosynthetic rate was not a saturation curve. The leaf and canopy photosynthetic rates both showed a linear increase with CO2 concentration.
When the time lag was set to six min, the changes in canopy photosynthetic rate and leaf photosynthetic rate were almost identical.
Table 2 shows the canopy photosynthetic rate, which was measured by varying the light intensity and CO2 concentration, according to growth stage. Time lag was set to one min, and canopy photosynthetic rate was calculated according to the change of light intensity. As growth stage progressed, the canopy photosynthetic rate decreased from 12.38 to 9.61 μ mol·m-2·s-1. Subsequently, the time lag was set to six min, and canopy photosynthetic rate was calculated according to change of CO2 concentration. As growth stage progressed, the canopy photosynthetic rate decreased from 18.30 to 6.56 μmol·m-2·s-1. Of the various environmental factors, the biggest change with crop growth is light, which is because the shape of the crop changes. As the crops grow, the leaves of the lower part are covered by the leaves of the upper part, thereby reducing the light intensity per crop surface area
even if they are subjected to the same light intensity (Del Pozo et al., 2007).
According to the research by Gross and Chabot (1979), there was a time lag of several seconds after the light intensity changed when measuring photosynthetic rates. In other words, light is the environmental factor allowing determination of crop response within a few seconds.
According to Creese et al. (2014), the response to stimulation by stomatal conductance is driven by light compared with the response obtained from varying CO2 concentration. When CO2 is a control element, it is difficult to analyze the response by mechanical measurement within a short period of time. Therefore, to obtain reliable data, experiments for each environmental control element must
Fig. 6. Comparison of canopy and leaf photosynthetic rates under the same light intensities and CO2 concentrations. A and B denote changing light intensity at a CO2 concentration of 1,000 µmol·mol-1 and changing CO2 concentration at a light intensity of 200 µmol·m-2·s-1, respectively.
be performed after appropriate time. There are established photosynthetic rate models that include light intensity, temperature, CO2 concentration, and growth period (Jung et al., 2016; Jung et al., 2017). According to Johnson et al. (2010), the canopy photosynthetic rate with increasing light intensity does not appear in the form of a general saturation curve but in the form of a non-rectangular hyperbola curve. This is caused by inconsistent light intensity on the surfaces of all leaves due to the morphological characteristics of the crop.
However, the change of CO2 concentration was not influenced by crop architecture in small crops such as lettuces.
The canopy photosynthetic response of lettuce showed a faster adaptation to changes in light intensity, and adaptation to CO2 concentration change required six times longer than that of light intensity (Fig. 6). Therefore, for faster measurements of canopy photosynthetic rate, it is efficient to vary the light intensity at a stable CO2 concentration. Quantification of CO2 consumption using growth chambers will help to establish efficient CO2 enrichment methods for plant cultivation.
This can also be coupled with photosynthesis models reflecting environmental factors in plant factories or greenhouses for management of crop cultivation.
Conclusions
A method to establish canopy photosynthetic rate curves of romaine lettuce (Lactuca sativa L.) using controlled growth chamber was developed in this study. The canopy photosynthetic rate was measured stably and quickly with a time lag of one min when changing light intensity at fixed CO2 concentration; a longer time lag of six min was required with constant light intensity and variable CO2 concentration.
Using the chamber system, it was possible to accurately
measure the canopy photosynthetic rate of lettuces by changing the light intensity. For canopy photosynthesis measurements with custom chambers, it is recommended to change the light and finish the measurement in a short time.
This result is meaningful in that it established a method for measuring canopy photosynthesis with changing environmental factors in a closed chamber system. This method can contribute to establishment of multi-variable canopy photosynthesis models in the future.
Acknowledgement
This work was supported by the Korea Institute of Planning and Evaluation for Technology in Food, Agriculture, Forestry, and Fisheries (IPET) through the Agriculture, Food, and Rural Affairs Research Center Support Program funded by the Ministry of Agriculture, Food, and Rural Affairs (MAFRA;
717001-07-1-HD240).
Literature Cited
Bazot, S., H. Blum, and C. Robin. 2008. Nitrogen rhizodeposition assessed by a (NH3)-N-15 shoot pulse-labelling of Lolium perenne L. grown on soil exposed to 9 years of CO2 enrichment. Environ. Exp. Bot. 63:410-415.
Caporn, S.J.M. and W.A. Wood. 1990. A controlled‐environment chamber for measurement of canopy photosynthesis by small stands of lettuce (Lactuca sativa L.). Plant Cell Environ. 13:489-493.
Carporn, S.J.M. 1989. The effects of oxides of nitrogen and carbon dioxide enrichment on photosynthesis and growth of lettuce (Lactuca sativa L.). New Phytol. 111:473-481.
Chang, Z.Q., Q. Feng, J.H. Si, Y.H. Su, H.Y. Xi, and J.L. Li 2009. Analysis of the spatial and temporal changes in soil CO2 flux in alpine meadow of Qilian Mountain. Environ.
Geol. 58:483-490.
Table 2. Canopy photosynthetic rates measured at specific light intensity (200 µmol·m-2·s-1) and CO2 concentration (1,000 µmol·mol-1) according to growth stages (days after transplanting, DAT) with different measurement patterns.
Controlled patternz Canopy photosynthetic rate (µmol·m-2·s-1)
5 DAT 10 DAT 15 DAT 20 DAT
Pattern 1 12.38 ± 0.3y 11.47 ± 0.5 9.61 ± 1.2 9.61 ± 1.2
Pattern 2 18.30 ± 1.6 13.85 ± 2.4 9.77 ± 1.2 6.56 ± 1.7
zPatterns 1 and 2 denote changing light intensity at a fixed CO2 concentration, and changing CO2 concentration at a fixed light intensity, respectively.
yMean of three replicates ± SD.
Creese, C., S. Oberbauer, P. Rundel, and L. Sack. 2014. Are fern stomatal responses to different stimuli coordinated?
Testing responses to light, vapor pressure deficit, and CO2 for diverse species grown under contrasting irradiances.
New Phytol. 204:92-104.
Del Pozo, A., P. Perez, D. Gutiérrez, A. Alonso, R. Morcuende, and R. Martinez-Carrasco. 2007. Gas exchange acclimation to elevated CO2 in upper-sunlit and lower-shaded canopy leaves in relation to nitrogen acquisition and partitioning in wheat grown in field chambers. Environ. Exp. Bot. 59:371-380.
Dutton, R.G., J. Jiao, M.J. Tsujita, and B. Grodzinski. 1988.
Whole plant CO2 exchange measurements for nondestructive estimation of growth. Plant Physiol. 86:355-358.
Elmore, C.D. 1980. The paradox of no correlation between leaf photosynthetic rates and crop yields In: Hesketh JD, Jones JW (Eds.), Predicting photosynthesis for ecosystem models, Vol. 2. Boca Raton, CRC Press, FL, pp 155-167.
Evans, J.R., and S. von Caemmerer. 1996. Carbon dioxide diffusion inside leaves. Plant Physiol. 110:339.
Evans, L.T. 1996. Crop evolution, adaptation and yield. Cambridge University Press, Cambridge, pp 146-152.
Flexas, J., A. Diaz-Espejo, J.A. Berry, J. Cifre, J. Galmes, R.
Kaidenhoff, H. Medrano, and M. Ribas-Carbo. 2007.
Analysis of leakage in IRGA's leaf chambers of open gas exchange systems: quantification and its effects in photo- synthesis parameterization. J. Exp. Bot. 58:1533-1543.
Garcia, R.L., J.M. Norman, and D.K. McDermitt. 1990. Measu- rements of canopy gas exchange using an open chamber system. Remote Sens. Rev. 5:141-162.
Gross, L.J. and B.F. Chabot. 1979. Time course of photosynthetic response to changes in incident light energy. Plant Physiol.
63:1033-1038.
Inkham, C., P. Piriyapongpitak, and S. Ruamrungsri. 2019.
Storage and growth temperatures affect growth, flower quality, and bulb quality of Hippeastrum. Hortic. Environ. Biotechnol.
60:357-362.
Austin, J., Y.A. Jeon, M.K. Cha, S. Park, and Y.Y. Cho. 2016.
Effects of photoperiod, light intensity and electrical conductivity on the growth and yield of quinoa (Chenopodium quinoa Willd.) in a closed-type plant factory system. Kor. J. Hortic.
Sci. Technol. 34:405-413.
Johnson, I.R., J.H.M. Thornley, J.M. Frantz, and B. Bugbee.
2010. A model of canopy photosynthesis incorporating protein distribution through the canopy and its acclimation to light, temperature and CO2. Ann. Bot. 106:735-749.
Jung, D.H., D. Kim, H.I. Yoon, T.W. Moon. K.S. Park, and J.E.
Son. 2016. Modeling the canopy photosynthetic rate of romaine lettuce (Lactuca sativa L.) grown in a plant factory at varying CO2 concentrations and growth stages. Hortic.
Environ. Biotechnol. 57:487-492.
Jung, D.H., H.I. Yoon, and J.E. Son. 2017. Development of a three-variable canopy photosynthetic rate model of romaine
lettuce (Lactuca sativa L.) grown in plant factory modules using light intensity, temperature, and growth stage. Protect.
Hortic. Plant. Fact. 26:268-275.
Kaipiainen, E.L. and P. Pelkonen. 2007. Requirements for obtaining maximum indices of photosynthesis and transpiration in attached leaves of willow plants grown in short. Russ. J.
Plant Physiol. 54:309-313.
Kim, S. and H. Lieth. 2003. A coupled model of photosynthesis, stomatal conductance and transpiration for a rose leaf (Rosa hybrida L.). Ann. Bot. 91:771-781.
Knight, S.L., C.P. Akers, S.W. Akers, and C.A. Mitchell. 1988.
Minitron-Ii system for precise control of the plant-growth environment. Photosynthetica 22:90-98.
Langensiepen, M., M. Kupisch, M.T. Wijk, and F. van Ewert.
2012. Analyzing transient closed chamber effects on canopy gas exchange for optimizing flux calculation timing. Agric.
Forest Meteorol. 164:61-70.
Mcdermitt, D.K., J.M. Norman, J.T. Davis, T.M. Ball, T.J.
Arkebauer, J.M. Welles, and S.R. Roerner. 1989. CO2 response curves can be measured with a field-portable closed-loop photosynthesis system. Ann. Sci. For. INRA/EDP Sci. 46:
416-420.
Mills, E. 2012. The carbon footprint of indoor cannabis production.
Energy Policy 46:58-67.
Pastenes, C., E. Santa-Marı́, R. Infante, and N. Franck. 2003.
Domestication of the Chilean guava (Ugni molinae Turcz.), a forest understorey shrub, must consider light intensity. Sci.
Hortic. 98:71-84.
Rappaport, F., D. Béal, A. Verméglio, and P. Joliot. 1998.
Time-resolved electron transfer at the donor side of Rhodopseudomonas viridis photosynthetic reaction centers in whole cells. Photosynth. Res. 55:317-323.
Rochette, P., B. Ellert, E.G. Gregorich, R.L. Desjardins, E.
Pattey, R. Lessard, and B.G. Johnson. 1997. Description of a dynamic closed chamber for measuring soil respiration and its comparison with other techniques. Can. J. Soil Sci.
77:195-203.
Schwartzkopf, H., and Stofan, P.E. 1981. A chamber design for closed ecological systems research. American Society of Mechanical Engineers, Intersociety Conference on Environmental Systems, San Francisco, CA, July 13-15, p. 5.
Sestak, Z., J. Catsky, and P.G. Jarvis. 1971. Plant photosynthetic production: Manual and methods, Junk Publisher, The Hague, p 819.
Shimizu, H., M. Kushida, and W. Fujinuma. 2008. A growth model for leaf lettuce under greenhouse envrionments. Environ.
Control Biol. 46:211-219.
Shin, J.H., T.I. Ahn, and J.E. Son. 2011. Quantitative measurement of carbon dioxide consumption of a whole paprika plant (Capsicum annumm L.) using a large sealed chamber. Kor. J.
Hortic. Sci. Technol. 29:211-216.
Shipp, J.L., X. Hao, A.P. Papadopoulos, and M.R. Binns. 1998.
Impact of western flower thrips (Thysanoptera: Thripidae) on growth, photosynthesis and productivity of greenhouse sweet pepper. Sci. Hortic. 72:87-102.
Song, Q., H. Xiao, X. Xiao, and X.G. Zhu. 2016. A new canopy photosynthesis and transpiration measurement system (CAPTS) for canopy gas exchange research. Agric. Forest Meteorol.
217:101-107.
Steduto, P., O. Çetinkoku, R. Albrizio, and R. Kanber. 2002.
Automated closed-system canopy-chamber for continuous field-crop monitoring of CO2 and H2O fluxes. Agric. Forest Meteorol. 111:171-186.
Suh, S.U., Y.M Chun, N.Y. Chae, J. Kim, J.H. Lim, M.
Yokozawa, M.S. Lee, and J.S. 2006. A chamber system with automatic opening and closing for continuously measuring
soil respiration based on an open-flow dynamic method.
Ecol. Res. 21:405-414.
Wagner, S.W. and D.C. Reicosky. 1992. Closed-chamber effects on leaf temperature, canopy photosynthesis, and evapot- ranspiration. Agron. J. 84:731-738.
Wheeler, R.M. 1992. Gas exchange measurements using a large, closed plant growth chamber. HortScience 27:777-780.
Wheeler, R.M., C.L. Mackowiak, G.W. Stutte, J.C. Sager, N.C.
Yotio, L.M. Ruffe, R.E. Fortson, T.W. Dreschel, W. M.
Knott, and K.A. Corey. 1996. NASA’s biomass production chamber: a testbed for bioregenerative life support studies.
Adv. Space Res. 18:215-224.
Yamazaki, K. 1982. Nutrient solution culture. Pak-kyo, Tokyo, Japan p. 251.
생육 챔버를 이용하여 광도 및 이산화탄소 농도 변수를 갖는 상추(Lactuca sativa L.)의 군락 광합성 곡선의 효율적 도출 방법
정대호†ㆍ김태영†ㆍ손정익*
서울대학교 식물생산과학부 및 농업생명과학연구원
적 요. 군락 광합성 모델의 도출을 위하여 생육 챔버가 필요하며, 이를 위한 광합성의 효율적인 측정 방법이 필요하 다. 본 연구의 목적은 내부 환경 제어가 가능한 생육 챔버를 이용하여 광도 및 이산화탄소 농도 변수를 갖는 로메인 상추(Lactuca sativa L.)의 군락 광합성 곡선을 도출하는 방법을 확립하는 것이다. 실험에 사용한 상추는 식물공장 모듈에서 재배되었으며, 군락 광합성을 측정하기 위하여 아크릴로 제작된 생육 챔버(1.0x0.8x0.5m)를 이용하였다.
첫 번째로, 다음의 두 방법을 적용하여 측정된 군락 광합성 속도를 통해 각 방법의 시정수를 계산하여 비교하였다.
즉, 1) CO2 농도를 고정(1,000μmol·mol-1) 하고 광도를 변화(340, 270, 200, and 130μmol·m-2·s-1) 시키거나, 2) 광도를 고정(200μmol·m-2·s-1)하고 CO2 농도를 변화(600, 1,000, 1,400, and 1,800μmol·mol-1) 시켰다. 두 번째로, 1)과 2)의 방식을 적용하여 군락 광합성을 측정했을 때, 특정 광도(200μmol·m-2·s-1)와 특정 CO2농도(1,000μmol·mol-1)에서
측정된 군락 광합성 속도 값을 비교하였다. 실험 결과 CO2농도를 변화시키는 방식의 시정수는 광도를 변화시키는
방식에 비해 3.2배 큰 값을 나타내었다. 광도를 변화시키며 측정할 때 군락 광합성 속도는 1분 이내에 안정되었고,
CO2 농도를 변화시킬 경우에는 6분 이상의 시간이 소요되었다. 따라서 광도를 변화시키는 측정 방식이 생육 챔버를
이용하여 작물의 군락 광합성 속도를 측정할 때 적합한 방식임을 확인하였다.
추가 주제어: 광합성속도, 광합성유효광양자속밀도, 로메인, 시정수, 이산화탄소 소비