Sensors & Transducers
© 2015 by IFSA Publishing, S. L.
http://www.sensorsportal.com
Sub-surface Elasticity Imaging Sensor
based on Bio-Optics with Polydimethylsiloxane (PDMS)
1 Jong-Ha LEE
1
Department of Biomedical Engineering, Keimyung University, School of Medicine, South Korea
1
Tel.: 053-580-3736, fax: 053-580-3746
1
E-mail: [email protected]
Received: 1 January 2015 /Accepted: 27 February 2015 /Published: 31 March 2015
Abstract: A novel tactile sensor capable of measuring material constants of the sensed object has been fabricated and demonstrated in the current study. Although many tactile sensors have been previously developed, the resolution of these measurements is still fairly low compared to the sensation of human touch.
The tactile sensor we propose is comprised of an elastic optical waveguide unit, a high resolution CCD camera unit, and an LED light source. The sensing element is formed on Polydimethylsiloxane (PDMS) and is illuminated along its four edges by LED light sources. The sensor operates on the principle of total internal reflection within an optical waveguide. Since the waveguide is surrounded by air, having a lower refractive index than the waveguide, the incident light directed into the waveguide remains contained within it. When an object compresses the waveguide, the contact area of the waveguide deforms and causes the light to scatter.
Since the scattered light is directly captured by a CCD camera, the tactile resolution of the proposed sensor is based on the resolution of the camera. The normal force is detected from the integrated gray scale values of bright pixels emitted from the deformed area of the optical waveguide. Non-rigid point matching algorithm with Laplacian smoothing spline is used to estimate the displacement of control points between 3D rendered tactile images captured under different compression ratios. The strain experienced through the sensed object is derived from a function of the associated displacement. Experiments were conducted to demonstrate the ability of the proposed sensing strategy in measuring Young’s modulus of polymer samples within 4.23 % error. Copyright © 2015 IFSA Publishing, S. L.
Keywords: Breast cancer, Tumor detection, u-healthcare, Wellness.
1. Introduction
Diagnosis early formation of tumors or lumps, particularly those caused by cancer, has been a problem. It has been attempted to be solved using various techniques, such as computer tomography, ultrasonic imaging, nuclear magnetic resonance imaging, x-rays and so on [1-3]. Each of these techniques has limitations, including the application of radiation to the body, which may be harmful to the body being tested. In breast cancer case, palpation
plays a primary role in detecting tumors or lumps
through breast self-examination or annual clinical
breast examination [4]. The problem with this
method is that it is difficult to accurately verbalize
and record tactile sensations. A variety of methods
have been proposed for measuring the characteristics
of tissue. One approach attempts to determine the
relative stiffness or elasticity of tissue by applying
ultrasonic imaging techniques while vibrating the
tissue at low frequencies [5]. Another method
recently proposed for measuring and imaging tissue
elasticity is elastography [6]. This method includes emitting ultrasonic waves along a path into the tissue and detecting an echo sequence resulting from the ultrasonic wave pulse [7, 8]. The tissue is then compressed and uncompressed along the path and during such compressing; a second pulse of ultrasonic waves is sent along the path into the tissue.
The second echo sequence resulting from the second ultrasonic wave pulse is detected and then the differential displacement of selected echo segments of the first and second echo sequences are measured.
A selected echo segment of the echo sequence corresponds to a particular echo source within the tissue along the beam axis of the transducer. Time shifts in the echo segment are examined to measure compressibility of the tissue regions. It is desirable to have the capability to investigate tissue elasticity changes, which may indicate precursors of tumors or actual tumors without subjecting the patient to radiation.
Our goal is to develop a simple and easy to use system that can document the properties of palpable lumps in soft tissue using noninvasive technique. The tactile sensor we propose comprises of an elastic optical waveguide unit, a high resolution CCD camera unit, a LED light source unit, and a laptop computer. The sensing element is formed on poly dimethylsiloxane (PDMS) and is illuminated along its four edges by LED light sources. The tactile sensor operates on the principle of total internal reflection (TIR) within an optical waveguide. The light directed into the waveguide remains within it due to the TIR generated, since the waveguide is surrounded by air having a lower refractive index than the waveguide. When an object adheres to the waveguide and compresses, the contact area of the waveguide deforms and causes the light to scatter.
The normal force was detected from the integrated gray scale values of bright pixels emitted from the deformed area of the optical waveguide. We analyze the physical basis for tactile imaging by measuring stress-strain patterns that result from lights pressed against objects. Temporal and spatial changes in the stress-strain pattern allow detection of structures with different elastic properties and assessment of geometrical and mechanical parameters of these structures. The influence of some hidden anatomical features, such as lumps, on the stress distribution at the touching surface is also studied. We demonstrated that the current device permits determining the presence and location of tissue that has different elastic characteristics from surrounding tissue. Fig. 1 shows the example of a breast self examination method and an optical tactile elasticity imaging method. By using a tactile imager, we can quantify the tactile sensation of hidden features. The hardness of tumors can be quantified in terms of the surrounding tissue elastic properties. The tactile sensation would be more sensitive than what we feel by hand.
(a)
(b)
Fig. 1. (a) Breast self-examination; (b) Tactile sensation recording by optical tactile elasticity imager. The tactile
imager quantifies the hand sensation by touch.
A method for accurately recording tactile sensations from physical exams would improve the ability to detect change in lumps across time. We believe that tactile imaging will provide a solution to the problem of documenting the results of physical examination. It will provide more accurate and repeatable estimates of lump size than the currently available widely used methods for breast examination specifically, clinical breast examination, ultrasound and mammography.
2. The Tactile Imaging Sensor
Knowing the specific features of human fingers, the basic design of the tactile sensor is introduced to satisfy the characteristics described on section II. The tactile sensor, emulating the structure of human fingers, is designed with the characteristics as listed below.
1) Elastic material: PDMS is used emulating the human tissue. This was necessary to create a soft contact surface which has been proved to be is effective in detecting the texture of soft material.
2) Three layered structure: Emulating the
structure of human tissue, three types of PDMS with
different elasticity (The elastic coefficient is the
largest as those of the epidermis and the smallest of
the subcutanea for better sensitivity) are stacked
together. The elasticity of PDMS is controlled by the
ratio of base and catalyst of PDMS.
3) Distribution of bone and nail elements: In order to effectively derive sensory information, parts that function as the bone and nail are situated at the base of the sensor. In the current design, heat resistant borosilicate glass plate is used.
4) Distributed sensor element: To emulate mechanoreceptors of the human finger, optical method using light reflection pattern is used. This is to obtain spatial distribution of sensory outputs.
2.1. Sensor Description and Design
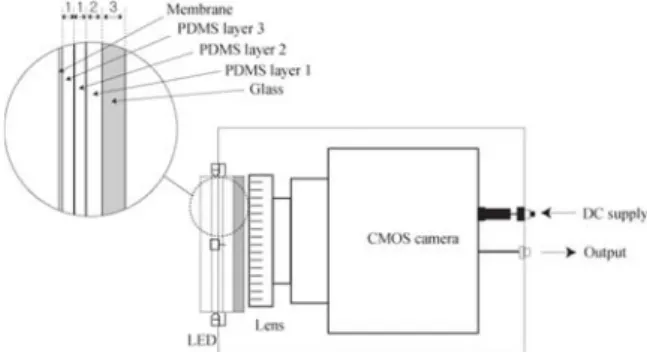
The schematic view shown in Fig. 2 demonstrates the structure of the present tactile sensor. The system incorporates an elastic optical waveguide unit, a CMOS camera unit and a computer for data acquisition and analysis. Four LEDs light source unit are attached to the glass plate and illuminates an optical waveguide. Following section describes each unit in detail.
Fig. 2. Schematic of the Optical Tactile Sensor.
1) Elastic Optical Waveguide
The elastic optical waveguide is a main sensing probe of the device. The elastic optical waveguide is composed of polydimethylsiloxane (PDMS) [ Si(CH ) ]. PDMS is the high performance silicone
3 2elastomer [13, 14]. In the device, the optical waveguide requires transparent and PDMS meets this requirement. One of Hydroxyl-terminated PDMS, RTV6156 is purchased from a silicone distributor (R.S. Hughes, Baltimore, MD). The PDMS is produced by pouring viscous fluid silicone and catalyst into one mold cavity. Here viscous fluid silicone is vinylstopped phenylmethypolyer and catalyst is a mixture of components including methylhydro genpolysiloxane, dimethyl, methyvinyl siloxane and dimethylvinyl terminated. The viscous fluid silicone hardened by a catalyst and the hardness is depending on the ratio of silicone and catalyst. The desired shape is a rectangular for a dermis and a subcutanea layer and curvature for an epidermis layer.
To start with, we have to create a mold cavity of the required shape. Once the cavity is created, the silicone was mixed thoroughly in a beaker in a ratio of pre-specified level. During mixing of the base and
curing agent, a lot of bubbles were created. To remove these bubbles, the base-curing agent mixture was de-aerated with the help of a vacuum pump. This process was repeated until all the bubbles were completely removed. Following this, the base curing agent mixture was carefully purred into the mold cavity. A few drops of Teflon were sprayed around a mold cavity for easy removal of the cured rubbers.
Then, the mold cavity along with the PDMS mixture was cured for almost 1 day at room temperature
25
oC . Since the precision of the tactile sensor depends on the quality of the PDMS, optimal working conditions is necessary.
2) CMOS Camera
The high performance CMOS camera is placed below an optical waveguide. The clear glass is placed between CMOS camera and an optical waveguide to sustain an elastic optical waveguide without losing camera resolution. The glass also performs as the bone and nail in a human finger. The digital imager is a mono-cooled complementary metal–oxide–
semiconductor (CMOS) with 4.65 μ m (H) × 4.65 μ m (V) individual pixel size (FLEA2, Point Grey Research, British Columbia). The maximum lends resolution is 1392 (H) × 1042 (V) and it’s angle of view is 60 ° .
3) Internal Light Source
The internal light source is a micro LED (Unique- Leds, Newalla, OK) with a diameter of 1.8 mm.
There are four LEDs to provide enough illumination for the optical waveguide .
2.2. Tactile Sensing Principle
The tactile sensor operates on the principle of total internal reflection (TIR) [9, 10]. Beams of light emitted from the light source to the edge of the optical waveguide, are totally enclosed and reflected inside the optical waveguide. The tactile sensor uses the deformable properties of the waveguide as part of the transduction process. The light from a light source is injected into a waveguide from its edge.
The innermost region of a waveguide carried the light, while preventing the light from leaking out of the silicone by reflecting the light within the boundaries of the silicone. When an object touch to the optical waveguide and compress, the deformed area causes the light to scatter, and are observed from the rear side of the transparent mirror. The concept is shown in Fig. 3.
Fig. 3. Tactile sensation concept using total
internal reflection.
2.3. Mechanical Analysis and Multilayer Silicone
The active sensing area of the elasticity sensor is capped with PDMS layers. The contact between a rigid indenter and a flat PDMS is of our interest. The shape of the indenter may be spherical, conical, a cylindrical flat punch, or even take the form of a uniformly applied pressure. All such phenomena are usually referred to as “Hertzian contact” [6]. The most well-known scenario is the contact between a rigid sphere and a flat surface where Hertz found that the radius of the circle of contact a , is related to the indenter force F , the effective radius of curvature
R and the elastic properties of the materials by
3
4
3 , a kFR
= E (1)
where k is the an elastic mismatch factor given by
2 2
9 [(1 ) (1 )]
16
k v E v
E ′
= − + −
′ (2)
and
11 2
1 1
[ ]
R R R
= +
−.
In equation above, E , v and E′ , v′ are the
Young’s modulus and Poisson’s ratio for the specimen and the indenter, respectively.
Hertz also found that the maximum stress as
max 2
3 2 p F
π a
= (3)
Then the predicted stress profile is given as follow.
2 1/ 2
( , )
max[1 ( ) ] r p x y p
= − a , (4)
where r = [ x
2+ y
2 1/2] .
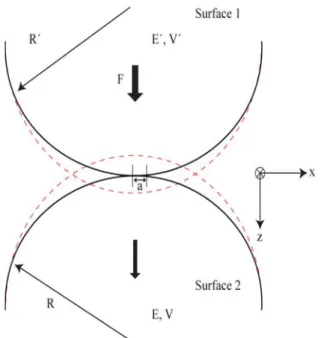
Fig. 4 shows the Hertzian contact when the ball shape indenter is in contact with a surface of PDMS.
Let us Stainless steel of an indenter has a modulus of 200 GPa and a Poisson ratio of 0.30. If the indenter has a diameter of 5 mm and the two are being held together by 2 N force. This gives an effective radius of
(1 / 5 1 / )
15
R = mm + ∞ =
−mm
and an effective modulus of
(
2) (
2)
10
3
1 0.3 1 0.4
1 1 1
200 10
0.14 0.08 0.034 0.0243
E
MPa MPa
MPa
−− −
= + =
× + +
=
Fig. 4. Hertz contact diagram. F is the force applies to the other. R’, E’, and v’ and R2, E2, and v2 are the radius, Young’s Modulus, and Poisson’s ratio of surfaces 1 and 2 respectively. a is one half the length of the contact patch, which is defined by the other variables.
The indenter will deform by an amount
3 2 0.005
1/3( ) 0.1029
4 0.0243
N m
a mm
MPa
× ×
= =
×
The maximum pressure that can be applied is then
max 2
3 2 90.2256
2 0.1029 p N
π
= × =
×
The Hertzian contact surface is calculated by changing indenter’s modulus and radius. The result is shown in Figs. 5 and 6.
Fig. 5. Sum of Hertzian contact stress profile on contact surface versus the normal force under different
indenter’s modulus.
0 500 1000 1500 2000 2500
0 2 4 6 8 10 12 14 16 18x 108
Normal force, Fz mN
Sum of Hertzian contact stress profile
Increasing indenter modulus
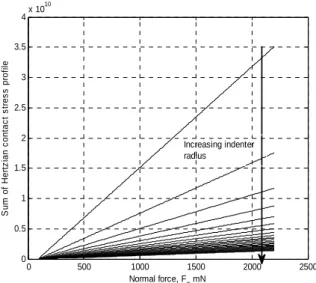
Fig. 6. Sum of Hertzian contact stress profile on the contact surface versus normal force under different
indenter’s radius.
From the figure we notice that as the modulus of indenter and is increasing, the sum of Hertzian contact stress profile is converged. The same situation is occurred when the radius of the indenter is increasing. To remove the effective variation from the different kind of indenter, the sufficient large modulus and radius of the indenter should be considered.
2.4. Normal and Shear Force Detection To provide a definition for the force direction, a Cartesian coordinate frame is added to the figure. If the optical waveguide accepts three-axis force, it is deformed both compressive and shearing direction.
Because the light scatters on the contact area, the gray scale value of the tactile image acquired by the CCD camera distributes as a Gaussian function, in which the gray-scale intensity is the highest at the centroid and decreases with increasing distance from the centroid.
Since the gray scale light spot R x y ( , ) of the tactile image is proportional to the contact pressure
( , )
p x y caused by the contact between optical waveguide and an object, it can be expressed as follow:
( , ) ( ( , ))
p x y = C R x y , (5) where C is the conversion factor. If S is designated as the contact area of a silicone and an object and the vertical force F
zis obtained by integrating the pressure over the contact area as follows:
( , )
F
z= p x y dS (6)
If we substituted, then, the vertical force is
( , ) ( ( , )) ( )
z
S S
F = p x y dS = C g x y dS ≡ C G
where the integration of g x y ( , ) over the contact area is denoted as G .
To formulate horizontal force vector F
xand F
y, the x and y coordinates of the centroid ( X Y
c,
c) are calculated by
( , ) / ( , )
c S S
X = g x y xdS g x y dS , (7) ( , ) / ( , )
c S S
Y = g x y ydS g x y dS . (8)
Since the shearing force induces the strain in the optical waveguide, it moves in the horizontal direction. The x and y components of the movement are denoted as u
xand u
yand expressed as
( )t (t 1)
x c c
u = X − X
−, (9)
( )t (t 1)
y c c
u = Y − Y
−, (10)
where (t) and (t-1) represent current and prior steps, respectively. If friction between optical waveguide and contact object is ignored, the x and y directional forces F
xand F
yare calculated as follows:
x x x
F = K u , (11)
y y y
F = K u , (12)
where K
xand K
yare the x and y directional spring constants of the PDMS, respectively.
3. Experimental Results 3.1. Experimental Conditions
We developed a loading machine shown in Fig. 7 that includes an x-stage, a z-stage, and a force/torque gauge (Mecmesin, West Sussex, UK) to detect the sensing characteristics of forces. The force gauge has a probe to measure force and can detect force ranging from 0 to 50 N with a resolution of 0.001 N. Output of the present tactile sensor is processed by the data processing system shown in Fig. 7. The system is composed of a tactile sensor, a loading machine, and image processing software, and a computer.
0 500 1000 1500 2000 2500
0 0.5 1 1.5 2 2.5 3 3.5
4x 10¹⁰
Normal force, Fz mN
Sum of Hertzian contact stress profile
Increasing indenter radius
Fig. 7. Tactile image of the reference.
3.2. Normal and Force Detection Test
To find the applied normal force value from the tactile image, the relationship between the contact force F
zand the calibrated gray scale light spot intensity R x y ( , ) is evaluated. Since the camera is 8 bit digital imager, each value of R x y ( , ) is quantified by a gray scale level and has a minimum of 0 and has a maximum value of 2
8= 256 . In this experiment, a sharp tip with 2 mm radius attached to the force/torque gauge is used to contact the tactile sensor. To validate the normal force detection, after starting from the initial load of 0 mN, the normal force is increased in a stepwise manner. When the applied force reaches the maximum force, in this experiment, 2 N, the applied normal force decreases in a stepwise fashion until it returns to 0 N. The
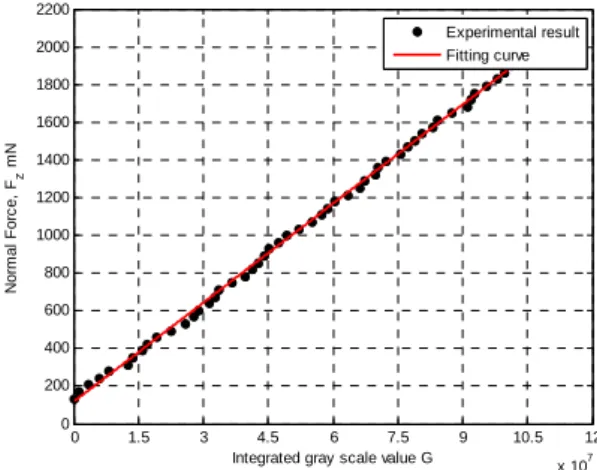
resulting light spot is captured by the tactile sensor and the corresponding contact force is measured by the force gauge. A pixel value is corresponding to the pressure value, and total pixel values measured to determine pressure characteristics. Fig. 8 shows the series of tactile images. The original image is enhanced by the linear filter. Fig. 9 shows the relationship between the integrated gray scale value and the applied normal force. As the figure indicates, the relationship between the integrated grayscale value and applied force is linear.
The fitting curve was achieved as shown in Fig. 10.
The curve approximately represents the monotone increasing relationship between the contact force F
zand the integrated gray scale value G of the tactile image as follows:
( ) 1.75 10
5114.56
C G = ×
−G − (13)
The slope yields the effective spring constant, k , for the optical tactile sensor.
3.3. Repeatability
The relationship between the integrated grayscale value and applied force has high repeatability.
Experimental results from 100 repetitions and show that all curves coincide. The deviation among them is within 2 %. Increasing the number of repetitions reduces the disturbance and stabilizes the state.
Fig. 8. Tactile image with 537 mN, 966 mN, 1503 mN normal force (from left to right).
Fig. 9. The relationship between normal force and integrated gray scale value.
Fig. 10. Curve fitting of loading unloading data.
0 1.5 3 4.5 6 7.5 9 10.5 12
x 107 0
200 400 600 800 1000 1200 1400 1600 1800 2000 2200
Normal Force, Fz mN
Integrated gray scale value G Loading Unloading
0 1.5 3 4.5 6 7.5 9 10.5 12
x 107 0
200 400 600 800 1000 1200 1400 1600 1800 2000 2200
Normal Force, Fz mN
Integrated gray scale value G
Experimental result Fitting curve
3.4. Phantom Study
1) Measurement Accuracy as a Function of the Inclusion Size
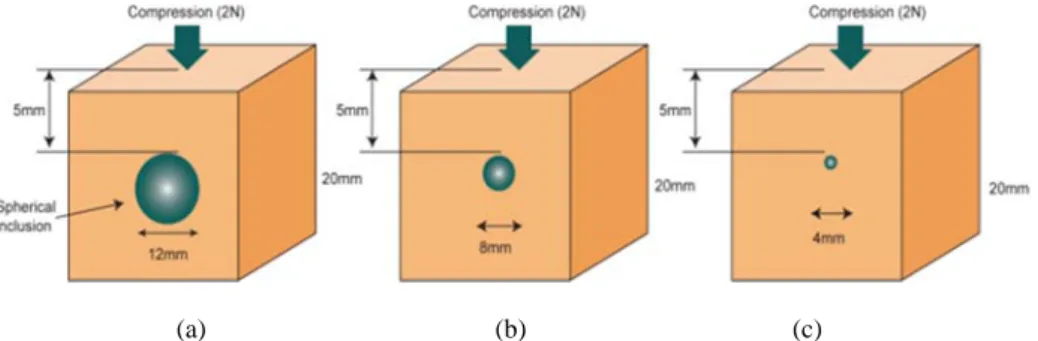
Realistic breast tissue phantoms shown with embedded hard nodules have been prepared. This model was made of a Zerdine composite having Young’s modulus of 4 kPa with an array of hard
spherical inclusions embedded at different depth in the model. The phantom thickness measured 20 mm, inclusions were placed 5 mm below the upper surface of the phantoms. The inclusion was ball made by Play-Doh ( Play-Doh , Hasbro Ltd., Newport, UK).
The size was 12 mm, 8 mm, 4 mm. The tactile images are obtained under the same force 2N. Fig. 11 shows the experimental concept.
(a) (b) (c)
Fig. 11. An example of the strain experienced as a function of the inclusion size. (a) Tissue sample with 12 mm inclusion.
(b) Tissue sample with 8 mm inclusion.
(c) Tissue sample with 4 mm inclusion.
Because the light scatters on the contact area, the gray scale value of the contact image acquired by the CCD camera distributes as a bell shape, in which the gray scale intensity is the highest at the centroid and decrease with increasing distance from centroid of the deformed area. To compare the tactile image, the horizontal tactile data through centroid is obtained and the Gaussian fitting model is used to describe the shape of tactile data. From this curve, we get the following Gaussian function and from this equation we obtain pressure intensity distribution.
2/ 2 2
P = ae
−x σ(14)
The amplitude of each Gaussian function is
a
1=234.23, a
2=137.06, and a
3=77.07. The variance is σ
12=99.96, σ
22= 98.92 , and σ
32= 75.40 . From this data, we can clearly see the difference between three data.
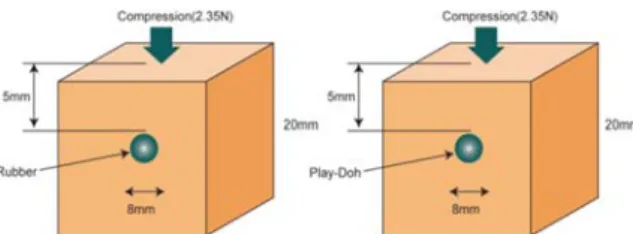
2) Measurement Accuracy as a Function of the Different Inclusion
In this experiment, the phantoms had an inclusion with diameter 8 mm of Play-Doh and rubber.
Typically, the rubber has much higher elastic modulus than Play-Doh. Total phantom thickness was 20 mm, and the base material Young’s modulus of 4 kPa. The inclusions were placed 5 mm below the upper surface of the phantoms. The tactile images are generated under 2.35 N. Fig. 12 shows the experimental concept. Fig. 13 represents three Gaussian fitting models depending on inclusion size and Fig. 14 shows an example of the strain experienced as a function of the different inclusion.
Fig. 12. Horizontal tactile data and its Gaussian fitting model.
Fig. 13. Three Gaussian fitting models depending on inclusion size.
250 300 350 400 450 500 550 600 650 700 750 800 0
50 100 150 200 250 300
Horizontal tactile data (12mm inclusion) Gaussian fitting model
250 300 350 400 450 500 550 600 650 700 750 800
0 50 100 150 200 250 300
Gaussian fitting model (12mm) Gaussian fitting model (8mm) Gaussian fitting model (4mm)
Fig. 14. An example of the strain experienced as a function of the different inclusion. (a) Tissue sample with 8 mm
rubber inclusion. (b) Tissue sample with 8 mm Play-Doh inclusion.
Fig. 15 represents a Gaussian fitting model. The rubber tactile data has a
1=175.20 with σ
12=80.25
and the Play-Doh tactile data has a
1=81.62 with σ
12=98.64.
Fig. 15. Three Gaussian fitting models depending on inclusion size.
Acknowledgements
This work was supported by the R&D Program of the Ministry of Trade, Industry and Energy of Korea (Program of Advanced Technology Development for Future Industry, 10044353) and Basic Science Research Program through the National Research Foundation of Korea (NRF) funded by the Ministry of Education (2014R1A1A2056420).
References
[1]. N. Harberland, K. Ebmeier, R. Hliscs, J. Grunewald, and R. Kalff, Intraoperative CT in image-guided surgery of the spine, Journal of Medicamundi, Vol. 43, Issue 4, 1999, pp. 24–32.
[2]. R. Gwinn, K. Cleary, and M. Medlock, Use of portable CT scanner during resection of subcortical supratentorial astocytomas of childhood, Journal of Pediatric Neurosurgery, Vol. 32, No. 1, 2000, pp. 37–43.
[3]. C. R. Gentle, Mammobarographing: a possible method of mass breast screening, Journal of Biomedical Engineering, Vol. 10, 1988, pp. 124–126.
[4]. M. Schulder, and P. Carmel, Intraoperative magnetic resonance imaging: impact on brain tumor surgery, Journal of Cancer Control, Vol. 10, No. 2, 2003, pp. 115–125.
[5]. M. Wolverson, E. Houttuin, E. Heiberg, M. Sundaram, and J. Shields, Comparison of computed tomography with high resolution real time ultrasound in the localization of the impalpable undescended Tests, Journal of Radiology, Vol. 146, 1983, pp. 133–136.
[6]. C. Kaufman, L, Jacobson, B. Bachman, and L. Kaufman, Intraoperative ultrasound facilitates surgery for early breast cancer, Journal of Annals of Surgical Oncology, Vol. 9, No. 10, 2007, pp. 988–993.
[7]. P. Strax, Control of breast cancer through mass screening, Hospimedica, 1989, pp. 35-40.
[8]. M. F. Insana, C. Pellot-Barakat, M. Sridhar, and K. K.
Lindfors, Viscoelastic imaging of breast tumor microenvironment with ultrasound, Journal of Mammary Gland Biology and Neoplasia, Vol. 9, No. 4, 2004, pp. 393-404.
[9]. J. Rogowska, N. A. Patel, J. G. Fujimoto, M. E Brezinski, Optical coherence tomographic elastography technique for measuring deformation and strain of atherosclerotic tissues, Heart, Vol. 90, No. 5, 2004, pp. 556-562.
[10]. Z. G. Wang, Y. Liu, G. Wang, and L. Z. Sun, Elastography Method for Reconstruction of Nonlinear Breast Tissue Properties, International Journal of Biomedical Imaging, Vol. 2009, 2009, Article ID 406854, 9 pages.
___________________
2015 Copyright ©, International Frequency Sensor Association (IFSA) Publishing, S. L. All rights reserved.
(http://www.sensorsportal.com)
150 200 250 300 350 400 450 500 550 600 650 700 0
20 40 60 80 100 120 140 160 180 200
Rubber Play-Doh