Regular Article
Regional cerebral blood flow changes and performance deficit during a sustained attention task in schizophrenia:
15 O-water positron emission tomography
Jeong-Ho Seok,
MD, PhD,
1Hae-Jeong Park,
PhD,
2Jong-Doo Lee,
MD, PhD,
2,3Hye-Sun Kim,
MA,
1Ji-Won Chun,
MA,
1,3Sang Joon Son,
MA,
1Maeng-Keun Oh,
MA,
2Jeonghun Ku,
PhD,
5Hyeongrae Lee,
MA4and Jae-Jin Kim,
MD, PhD1–3*
1
Department of Psychiatry and Institute of Behavioral Science in Medicine,
2Department of Diagnostic Radiology,
3Brain Korea 21 Project for Medical Science, Yonsei University College of Medicine,
4Department of Biomedical Engineering, Hanyang University, Seoul and
5Department of Biomedical Engineering, Keimyung University, Daegu, Korea
Aim: Attention deficit has been reported in both schizophrenia patients and patients with major depressive disorder (MDD). The aim of this study was to elucidate the deficits in sustained attention and associated neural network dysfunctions in schizo- phrenia patients and MDD patients, and to investi- gate the difference between the two patient groups.
Methods: Twelve schizophrenia patients, 12 patients with non-psychotic MDD, and 12 healthy control subjects participated in this study. A sustained atten- tion to response task (SART) was used to measure attention capacity. Cerebral blood flow (CBF) during attention tasks was measured using H
215O positron emission tomography. Statistical parametric map- ping and analysis of covariance were performed to compare the behavioral performance and CBF changes during SART among three groups.
Results: Behavioral performances were not signifi- cantly different among the three groups except for an increased commission error rate in the schizophrenia
group. Regional CBF during SART was significantly reduced in the left inferior frontal gyrus, the left cuneus, and the right superior parietal lobule and increased in the right superior frontal gyrus and the right cuneus in the schizophrenia group compared to the healthy control group. In the MDD group, neither significant regional CBF difference nor behavioral deficit was found compared to the healthy control group.
Conclusion: Behavioral performance deficit and per- fusion changes in the prefrontal and parietal cortices during SART were observed only in the schizophrenia group. Prefrontal and parietal network dysfunction for sustained attention may be involved in the patho- physiology of schizophrenia.
Key words: major depressive disorder, positron
emission tomography, schizophrenia, sustained attention.
C OGNITIVE DEFICIT IN sustained attention has been widely investigated and frequently found in patients with psychiatric disorder but the extent
and profile of the deficit may be different.
1,2Among schizophrenia patients, sustained attention may be one of the most interesting domains of neurocogni- tive function because research has consistently found a deficit in sustained attention across subtypes,
3and this deficit may be a marker of genetic susceptibility for schizophrenia.
4In addition, sustained attention accounts for considerable variance in social outcomes in schizophrenia patients.
5*Correspondence: Jae-Jin Kim, MD, PhD, Department of Psychiatry and Diagnostic Radiology, Gangnam Severance Hospital, Yonsei University College of Medicine; 712 Eonjuro, Gangnam-gu, Seoul 135-720, Korea. Email: [email protected]
Received 15 January 2011; revised 27 December 2011; accepted 14 January 2012.
Similarly, research suggests that patients with affec- tive disorders have various deficit profiles in sus- tained attention depending on their diagnoses and accompanying psychotic features. Patients with bipolar disorder have been reported to have deficits in sustained attention irrespective of accompanying psychotic features, and deficits in attention are seen even among euthymic patients.
6Unlike the relatively consistent evidence of deficits in sustained attention in patients with bipolar disorder, there have been inconsistent findings in patients with major depres- sive disorder (MDD). Previous studies have reported that a deficit in sustained attention is a vulnerability marker for MDD even when observed during euthy- mic or remission states,
7,8and a meta-analysis of neu- rocognitive function in MDD patients found an intermediate effect on tests requiring sustained atten- tion.
9Other studies, however, have provided con- trasting evidence, reporting no deficits in sustained attention in MDD patients.
1,2This inconsistency in findings among MDD patients may be due to subtle cognitive deficits or to various clinical states of depression that include psychotic features.
10Among patients with affective illnesses, patients with non- psychotic depression may have the smallest deficit in sustained attention capacity.
On neuroimaging, schizophrenia patients have been found to have dysfunctional cortical–
subcortical–cerebellar circuits,
11,12and this cortical–
subcortical circuit dysfunction may be associated with deficits in sustained attention.
13–15Neuroimag- ing of attention and executive function in MDD patients has also produced equivocal results.
Although some neuroimaging studies of depressed patients have reported hypoactivity in the frontal cortex,
16,17recent studies have reported prefron- tal hyperactivity during working memory
18and expected emotional judgment.
19Prefrontal hyperac- tivity found in the MDD patients may be a sign of cortical inefficiency.
20Sustained attention has traditionally been mea- sured using continuous performance tests (CPT) or signal detection paradigms. During a traditional CPT trial, the subject is asked to discriminate and respond to rapidly paced, infrequent targets among frequently presented non-targets. There are several variations in CPT paradigms, which have resulted in variable findings reflecting different aspects of attention and/or executive functions. The sustained attention to response task (SART) is one such variation. The SART is a computerized CPT that is sensitive to slips
of action and deficits in sustained attention.
21In this task, the subject is asked to respond to frequently presented, non-target stimuli, as opposed to respond- ing to infrequent target stimuli. The SART can be a useful tool for clarifying subtle differences in sus- tained attention capacity between schizophrenia patients and MDD patients.
In this study, we examined cognitive performance and regional cerebral blood flow (rCBF) during the SART in schizophrenia patients, patients with non- psychotic major depression, and healthy control sub- jects. We sought to further elucidate the cognitive deficits and related neural network dysfunctions seen in schizophrenia and MDD. H
215O positron emission tomography (PET) was used to investigate in vivo changes in rCBF during the SART. We hypothesized that the schizophrenia patients and the MDD patients would show differential cognitive perfor- mance and associated functional abnormalities in the brain during the SART compared with healthy controls.
METHODS
Subjects
Twelve schizophrenia patients (seven male; five
female), 12 MDD patients, and 12 healthy control
subjects participated in this study. The MDD patients
and the control subjects were age- and sex-matched
to the schizophrenia patients (Table 1). Patients were
recruited and diagnosed with the Structured Clinical
Interview for DSM-IV Axis I Disorders (SCID-I)
22by
two staff psychiatrists (JHS and JJK). Psychotic symp-
toms of the schizophrenia patients were assessed
with the Positive and Negative Syndrome Scale
(PANSS)
23by the same authors. The total PANSS
score of the schizophrenia patients ranged from
30 to 73 (48.3 ⫾ 14.1); mean subtotal scores for
positive, negative and general were 11.1 ⫾ 3.1,
12.6 ⫾ 4.4 and 24.7 ⫾ 7.2, respectively. The average
chlorpromazine-equivalent dose of antipsychotic
medication in the schizophrenia patients was
656 ⫾ 819.5 mg. The MDD patients did not have
psychotic symptoms. Depressive symptoms of all
subjects were measured with the Beck Depression
Inventory (BDI).
24The average depressive symptom
score in the MDD group (34.1 ⫾ 9.6, range 22–47)
was significantly higher than those in the other
two groups (schizophrenia group, 13.3 ⫾ 6.0, range
3–22; control group, 7.7 ⫾ 4.3, range 0–14; F =
47.626, d.f. = 2, 33, P < 0.001). The MDD patients were taking one or two antidepressant medications, but no antipsychotic drugs. The healthy control sub- jects were recruited via local advertisements and screened for previous psychiatric disorders using SCID and for significant neurological deficits and current medical illnesses by a trained psychologist (HSK).
All subjects were right-handed, as assessed by Annett’s handedness inventory.
25Although educa- tion level was not significantly different among the three groups, the average intelligence quotient (IQ) of the schizophrenia group was slightly lower than that of the control group (schizophrenia, 98.8 ⫾ 9.0;
MDD, 105.2 ⫾ 8.4; control, 111.7 ⫾ 7.5; F = 7.275, d.f. = 2, 33, P = 0.002). IQ was assessed with the short-form of the Korean Wechsler Adult Intelligence Scale (K-WAIS).
26Informed consent was obtained from all subjects before study participation, and the protocol for this study was approved by the Institu- tional Review Board at the Severance Mental Health Hospital, Yonsei University College of Medicine.
Behavioral task
To contrast the changes of brain activity during the SART, a simple continuous performance test (SCPT) was used as a baseline during the first PET scan. In the SCPT, the subject was asked to respond to all facial stimuli by indicating the position of the facial stimu- lus with the right or left mouse button. During the second PET scan, a modified SART task was per- formed. In light of research indicating that emotional stimuli can modulate attention
27and that this emotion–cognition interaction may increase differ- ences in sustained attention between psychiatric
patients and healthy controls, we adopted emotional facial stimuli in place of the neutral digit stimuli used in the original SART.
The modified SART included fearful faces as a target and other emotional (e.g. happy, sad) or neutral faces as non-targets (Fig. 1). Visual stimuli were prepared using 8 ¥ 12-cm
2facial pictures adopted from Ekman and Friesen,
28with either a right- or left-sided position on a 24 ¥ 17-cm
2gray background. Each visual stimulus was presented on a 14-in. monitor for 300 ms, and the inter-stimulus interval was 1200 ms. Thirty-two target stimuli and 121 non-target stimuli were presented in a pre-fixed, quasi-random fashion. Just as in the original SART, subjects were asked to respond with a left or right mouse button click to indicate the position of the face in the visual stimuli, except for fearful faces, for
Table 1. Demographic subject characteristics and psychiatric symptoms (mean⫾ SD)Schizophrenia (S) MDD (D)
Healthy
control (C) F/c2(d.f.) P
Significant post hoc†
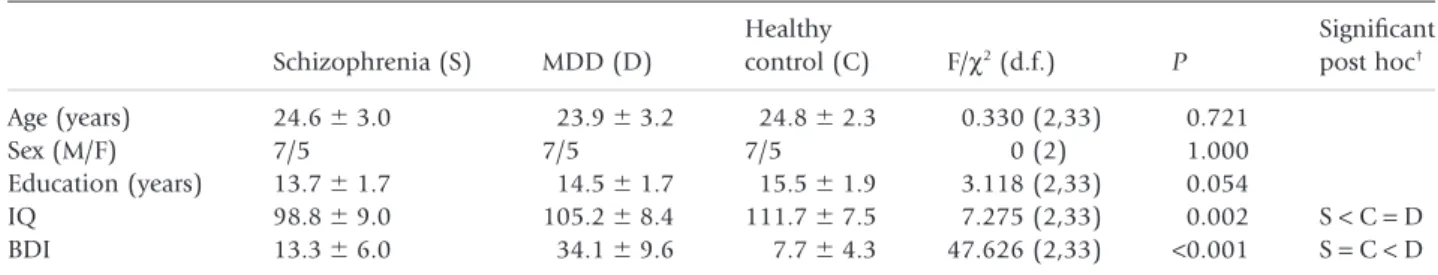
Age (years) 24.6⫾ 3.0 23.9⫾ 3.2 24.8⫾ 2.3 0.330 (2,33) 0.721
Sex (M/F) 7/5 7/5 7/5 0 (2) 1.000
Education (years) 13.7⫾ 1.7 14.5⫾ 1.7 15.5⫾ 1.9 3.118 (2,33) 0.054
IQ 98.8⫾ 9.0 105.2⫾ 8.4 111.7⫾ 7.5 7.275 (2,33) 0.002 S< C = D
BDI 13.3⫾ 6.0 34.1⫾ 9.6 7.7⫾ 4.3 47.626 (2,33) <0.001 S= C< D
Statistical analysis was performed using analysis of variance (ANOVA) andc2tests.†P< 0.05, Scheffe post-hoc analysis.
BDI, Beck Depression Inventory; IQ, intelligence quotient (measured using short-form Korean Wechsler Adult Intelligence Scale); MDD, major depressive disorder.
· · ·
· · ·
Response To Nontarget Stimuli !
Hold Response To Target Stimuli !!!
Response To Nontarget Stimuli !
Figure 1. Sustained attention to response task during positron emission tomography.
which subjects were told to withhold a response. Sub- jects were instructed to respond as quickly and as accurately as possible. The main task was preceded by a practice task consisting of the same number of presentations of visual stimuli with the same task paradigm but with different stimuli sequences. To minimize the medication’s effect on brain activity, the present schizophrenia subjects were told not to take any medication 12 h before the attention task and PET. CPT performance was assessed using three response measures: response time variability, omis- sion errors, and commission errors, as suggested in a recent study with a theoretical background.
29Image acquisition and analysis
PET was performed with a Gemini PET/CT scanner (Phillips Medical System, Andover, MA, USA) using the list mode acquisition, which had an intrinsic resolution of 4.96 mm full width at half maximum (FWHM) and simultaneously imaged 90 contiguous transverse planes with a thickness of 2.5 mm for a longitudinal field of view of 18 cm. Prior to each scan, subjects received an i.v. bolus of 370 MBq of [
15O] H
2O. PET data acquisition began coincidentally with injection and continued over a 120-s time period. Two scans at 15-min interval were acquired while performing the SCPT and the SART. Low-dose computed tomography (CT) was used for attenuation correction. Based on a time-activity curve for a 20–120-s interval, the acquired images were recon- structed using the 3-D row-action maximum likeli- hood algorithm. Preprocessing was performed using Statistical Parametric Mapping, version 8 (SPM8;
http://www.fil.ion.ucl.ac.uk/spm/). The data were realigned and spatially normalized to the standard stereotactic space
30for inter-subject averaging and comparisons. In the normalization procedure, global normalization using proportional scaling was included to control a global CBF effect. To increase the signal-to-noise ratio, the normalized images were smoothed with an isotropic Gaussian kernel of 12 mm FWHM.
Statistical analysis
Statistical analysis of the imaging data was performed using SPM8 with full factorial design. The first factor was defined as group with three levels (schizophre- nia, depression, and healthy control) and the second factor was a within-group factor as a task condition
with two levels (SCPT and SART). Using appropriate linear contrasts, the main effect of the groups, the main effect of the task condition, and interaction effect in rCBF changes were examined. To minimize type I errors, the level of significance of volume change was set to a peak amplitude threshold of false discovery rate (FDR) corrected P < 0.05 and voxel number >10.
Further statistical analysis
We defined the regions of interest (ROI) as those showing a significant main effect of rCBF change on SPM analysis. Signal intensities of ROI for each subject for statistical analysis were extracted using MarsBaR version 0.42 (http://marsbar.sourceforge.
net/).
31Analysis of covariance was performed to compare behavioral performance during the atten- tion tasks and rCBF changes among the three groups.
IQ was set as the covariate. Post-hoc multiple com- parisons with Scheffe’s method were conducted to clarify the significant differences among the three groups. Spearman correlation coefficients were com- puted to examine the relationships between rCBF changes in the ROI, behavioral performance, psychi- atric symptoms, and dosage of antipsychotics in all subjects. Statistical analysis was performed using PASW version 18 (IBM® SPSS® software, http://www- 01.ibm.com/software/analytics/spss/?pgel=ibmhzn&
cm_re=masthead-__products-__sw-spss). Results were considered significant for two-sided P < 0.05.
RESULTS
Behavioral performance
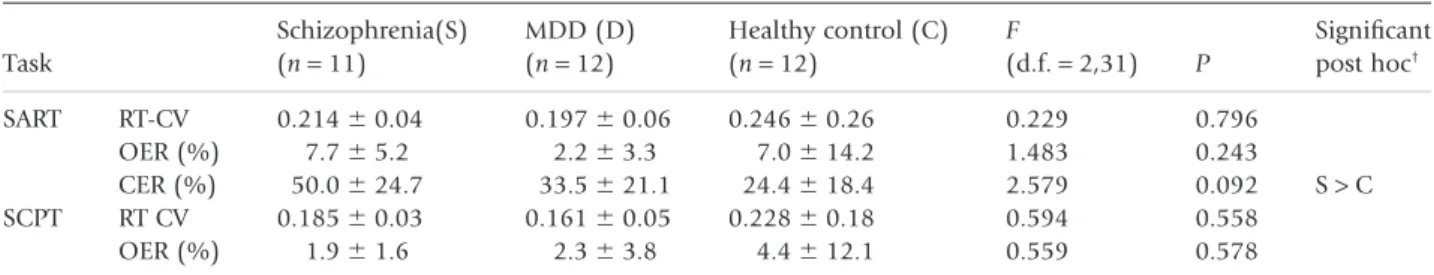
As indicated in Table 2, even though the group dif- ference in behavioral performance during the SART was not statistically significant (percentage of com- mission error: schizophrenia group, 50.0 ⫾ 24.7;
MDD group, 33.5 ⫾ 21.1; healthy control group, 24.4 ⫾ 18.4; F = 2.579, d.f. = 2,31, P = 0.092), post- hoc multiple comparison analysis indicated a signifi- cant difference in commission error rate between the schizophrenia group and the healthy control group during the SART. There was no significant difference in response variability and omission error rate during SCPT and SART among the three groups.
Duration of education was significantly correlated
with IQ (r = 0.547, n = 36, P = 0.001), but neither
duration of education nor IQ were correlated with behavioral performance during the SART. Other demographic characteristics, such as age, and psychi- atric symptom severity including BDI and PANSS scores, were not correlated with behavioral perfor- mance during the SART. There was no significant correlation between the chlorpromazine-equivalent antipsychotic dose and behavioral performance vari- ables during SCPT and the SART.
Comparison of rCBF changes during SCPT and SART
In full factorial SPM analysis there was a significant main effect of group in rCBF during SART but there
was no significant main effect of group during SCPT.
There was neither significant task condition effect within groups nor interaction effects between group and task condition factors. Remarkable changes in rCBF during SART were found in the schizophrenia group compared to the MDD group and the healthy control group (Table 3; Fig. 2). Regional CBF of the schizophrenia group was significantly reduced in the left inferior frontal gyrus (F = 14.42, d.f. = 2,33, P < 0.001) and the left cuneus (F = 8.48, d.f. = 2,33, P = 0.001) compared to the healthy control group, and increased in the right superior frontal gyrus (F = 17.92, d.f. = 2,33, P < 0.001), the right cuneus (F = 19.65, d.f. = 2,33, P < 0.001) and the right supe- rior parietal lobule (F = 13.74, d.f. = 2,33, P < 0.001)
Table 2. Behavioral performance (mean⫾ SD)Task
Schizophrenia(S) (n= 11)
MDD (D) (n= 12)
Healthy control (C) (n= 12)
F
(d.f.= 2,31) P
Significant post hoc†
SART RT-CV 0.214⫾ 0.04 0.197⫾ 0.06 0.246⫾ 0.26 0.229 0.796
OER (%) 7.7⫾ 5.2 2.2⫾ 3.3 7.0⫾ 14.2 1.483 0.243
CER (%) 50.0⫾ 24.7 33.5⫾ 21.1 24.4⫾ 18.4 2.579 0.092 S> C
SCPT RT CV 0.185⫾ 0.03 0.161⫾ 0.05 0.228⫾ 0.18 0.594 0.558
OER (%) 1.9⫾ 1.6 2.3⫾ 3.8 4.4⫾ 12.1 0.559 0.578
Behavioral performance was analyzed using analysis of covariance (ANCOVA) with IQ as the covariate.†P< 0.05, post-hoc test by Scheffe’s method. CER, commission error rate; MDD, major depressive disorder; OER, omission error rate; RT-CV, coefficient of reaction time variability; SART, sustained attention to response task; SCPT, simple continuous performance test.
Table 3. Brain regions with significant rCBF changes during the SART (mean⫾ SD)
Anatomic
region BA
Coordinates of peak voxel
Peak- level F score
No.
voxels
ANCOVA†
Post hoc‡ Schizophrenia (S) MDD (D)
Healthy control (C)
x y z
Left IFG 47 -38 18 -14 21.13 16 55.2⫾ 2.9 60.0⫾ 3.1 61.1⫾ 2.2 S< C
S< D
Right SFG 11 6 66 -16 20.91 13 84.5⫾ 2.9 78.8⫾ 1.9 76.3⫾ 4.7 S> C
S> D
Left cuneus 19 -14 -82 32 28.24 187 85.1⫾ 4.1 89.9⫾ 2.8 93.1⫾ 6.5 S< C
Right SPL 7 26 -70 44 22.37 42 85.4⫾ 3.3 78.8⫾ 4.2 77.0⫾ 4.6 S> C
S> D
Right cuneus 19 30 -82 26 20.96 66 79.8⫾ 2.8 74.2⫾ 3.9 71.6⫾ 2.8 S> C
S> D Threshold for significance in statistical parametric mapping analysis: False discovery rate (FDR) corrected P< 0.05, voxel size> 10.†Differences in rCBF among the three groups were analyzed by analysis of covariance (ANCOVA) with IQ as the covariate.‡P< 0.05, post hoc test by Scheffe’s method. BA, Brodmann area; IFG, inferior frontal gyrus; MDD, major depressive disorder; rCBF, regional cerebral blood flow; SART, sustained attention to response task; SFG, superior frontal gyrus; SPL, superior parietal lobule.
compared to the healthy control group. There was no significant difference in rCBF during SART between the MDD and the healthy control groups.
DISCUSSION
In this study, the schizophrenia group had behav- ioral performance deficit and different rCBF patterns in the frontal and parietal cortical regions during the modified SART compared to the healthy control group. Meanwhile, there was no significant differ- ence in behavioral performance and rCBF changes during the SART between the MDD and healthy control groups.
Even though vigorous behavioral and neuroimag- ing studies of attention have been conducted, there is no single brain region that is responsible for atten- tion. Cortico-thalamic-cerebellar circuits have been suggested to be involved in attention and executive function
32and we found significant rCBF differences during the SART in the frontoparietal regions in the schizophrenia group. Three interrelated but different neuronal networks for attention have been proposed by Fan et al.
33These three networks exert (i) an alert- ing function subserved by the thalamic, frontal, and parietal regions; (ii) an orienting function linked by the superior parietal lobe, the temporoparietal junc- tion, and the frontal eye field of the brain; and (iii)
an executive control function, which is associated with the anterior cingulate cortex and the lateral pre- frontal cortex. The dorsolateral prefrontal cortex plays an important role in the organization of infor- mation to facilitate a response,
34serving as an execu- tive control for sensory information and selection of output.
Based on the present results, abnormalities in acti- vation of the frontoparietal circuits during the SART might be associated with attention dysfunction in schizophrenia. A deficit in sustained attention is a well-replicated finding in schizophrenia patients and it is known to be a valuable diagnostic phenotype of schizophrenia.
4The prefrontal and parietal cortices play an important role in response inhibition and error-monitoring during the SART.
35,36Reduced rCBF during the SART was found in the left cuneus and the left inferior frontal gyrus in the schizophrenia group.
Cuneus is known to be involved in attentive visual and spatial information processing
37and is also included in activated neural network during sus- tained attention.
38Reduction of rCBF in the prefron- tal regions was consistent with the previous studies, which suggested that prefrontal dysfunction medi- ated deficit in sustained attention in schizophrenia patients.
12,39A frontoparietal network including pre- frontal cortex and cuneus may play an important role in sustaining and controlling attention.
40Increased rCBF, however, was also found in the right frontal and parietal cortices in the present schizophrenia group. More neural resources for response inhibition and error monitoring may be needed in the schizo- phrenia group, as was reported for an adolescent group in a previous study.
41Although previous studies reported a correlation with negative symptom severity and SART performance measures,
42we did not find significant correlation between PANSS symptom severity and behavioral performance during the SART. In the present study, the small number of subjects who underwent neuroimaging may be related to this negative finding.
Among the MDD patients, neither significant behavioral deficit nor rCBF difference during the SART was found compared with the healthy control subjects. Previous studies have reported that there is no deficit in sustained attention among MDD patients.
1,2Other studies, however, have reported deficits in sustained attention among depressed patients.
7,43,44In spite of these contrary findings, researchers suggest that psychotic features in patients with affective disorders are a compelling marker for
SPM mip [–36, 16, –14]SPM {F1,66}
Contrast(s) 2
10 20 30 40 50 60 70
2 4 6
Design matrix Figure 2. Statistical parametric mapping (SPM) of significant main effect of group in regional cerebral blood flow changes during the sustained attention to response task (SART). Region of interest (ROI) maps were visualized using SPM8 software.
Threshold for significance in SPM analysis: false discovery rate (FDR) corrected P< 0.05, voxel size > 10.
deficits in sustained attention. Both patients with bipolar disorder and MDD patients with psychotic features have shown deficits in sustained atten- tion.
1,45,46In the present study, the MDD group did not have any psychotic features, and the severity of illness ranged from mild to severe. These clinical characteristics of the MDD group may have contrib- uted to behavioral performances and brain activation comparable to those of the healthy control group. We replaced the digit stimuli with facial stimuli in the modified SART to investigate interactions between emotional conditions and sustained attention. We did not, however, find those interactions, but the facial stimuli might provide more perceptual loading than digit stimuli and induce cognitive activation for selective attention to emotional face during the modified SART.
47Globally increased cognitive activa- tion may contribute to a decrease in the differences between the patient and healthy control groups during the SART in the present study. In the present study, attention-related brain structures including prefrontal cortex and cuneus
40showed significant dif- ference in rCBF, but there was no significant group difference in rCBF of the facial information process- ing area including facial fusiform area. A previous study, however, also reported that prefrontal cortex and cuneus might be involved in emotional face perception.
48We think that the present finding may be associated with dysfunctional network for sus- tained attention and emotional face perception in schizophrenia.
Several limitations of this study should be noted.
First, all of the schizophrenia patients were medi- cated with one or two antipsychotic drugs, which may have confounded the results. After minimizing the medication effect, the dose of antipsychotic medi- cation was not significantly correlated with rCBF or task performance. All of the MDD patients were medicated with newer antidepressant drugs and no tricyclic antidepressants. We were not concerned with the confounding effects of medication for the MDD group because antidepressant medications are known to have no detrimental impact on cognitive function except tricyclic antidepressants.
49Also, we assessed depressive symptom severity using only the BDI, which does not reflect objective depressive symptom severity. Another limitation of the present study was that all the patients were outpatients and clinically stable with mild-to-moderate severity. Thus, the present results cannot be generalized to hospitalized patients with severe symptoms.
Conclusion
We combined study of neurocognitive function with functional brain imaging to find evidence of differ- ential changes in brain activity during a sustained attention task among schizophrenia patients and MDD patients. During the SART, we observed a behavioral deficit in attention and perfusion abnormalities in the frontoparietal regions in the schizophrenia patients. Differences in behavioral performance and brain activity during a sustained attention task may be valuable indicators for differ- entiating schizophrenia from non-psychotic MDD.
The prefrontal and parietal network dysfunction associated with sustained attention may be involved in the pathophysiology of schizophrenia.
ACKNOWLEDGMENT
This work is a portion of a dissertation project con- ducted by Dr Seok in the Department of Psychiatry, Yonsei University College of Medicine. The authors report no conflicts of interest.
REFERENCES
1. Liu SK, Chiu CH, Chang CJ, Hwang TJ, Hwu HG, Chen WJ.
Deficits in sustained attention in schizophrenia and affec- tive disorders: Stable versus state-dependent markers. Am.
J. Psychiatry 2002; 159: 975–982.
2. Clark L, Kempton MJ, Scarna A, Grasby PM, Goodwin GM.
Sustained attention-deficit confirmed in euthymic bipolar disorder but not in first-degree relatives of bipolar patients or euthymic unipolar depression. Biol. Psychiatry 2005; 57:
183–187.
3. Chen WJ, Faraone SV. Sustained attention deficits as markers of genetic susceptibility to schizophrenia. Am. J.
Med. Genet. 2000; 97: 52–57.
4. Chen WJ, Liu SK, Chang CJ, Lien YJ, Chang YH, Hwu HG.
Sustained attention deficit and schizotypal personality fea- tures in nonpsychotic relatives of schizophrenic patients.
Am. J. Psychiatry 1998; 155: 1214–1220.
5. Green MF, Kern RS, Braff DL, Mintz J. Neurocognitive deficits and functional outcome in schizophrenia: Are we measuring the ‘right stuff’? Schizophr. Bull. 2000; 26: 119–
136.
6. Clark L, Goodwin GM. State- and trait-related deficits in sustained attention in bipolar disorder. Eur. Arch. Psychia- try Clin. Neurosci. 2004; 254: 61–68.
7. Paelecke-Habermann Y, Pohl J, Leplow B. Attention and executive functions in remitted major depression patients.
J. Affect. Disord. 2005; 89: 125–135.
8. Weiland-Fiedler P, Erickson K, Waldeck T et al. Evidence for continuing neuropsychological impairments in depression. J. Affect. Disord. 2004; 82: 253–258.
9. Zakzanis KK, Leach L, Kaplan E. On the nature and pattern of neurocognitive function in major depressive disorder.
Neuropsychiatry Neuropsychol. Behav. Neurol. 1998; 11:
111–119.
10. Drevets WC. Functional anatomical abnormalities in limbic and prefrontal cortical structures in major depres- sion. Prog. Brain Res. 2000; 126: 413–431.
11. Ragland JD, Yoon J, Minzenberg MJ, Carter CS. Neuroim- aging of cognitive disability in schizophrenia: Search for a pathophysiological mechanism. Int. Rev. Psychiatry 2007;
19: 417–427.
12. Kim JJ, Mohamed S, Andreasen NC et al. Regional neural dysfunctions in chronic schizophrenia studied with positron emission tomography. Am. J. Psychiatry 2000;
157: 542–548.
13. Buchsbaum MS, Haier RJ, Potkin SG et al. Frontostriatal disorder of cerebral metabolism in never-medicated schizophrenics. Arch. Gen. Psychiatry 1992; 49: 935–942.
14. Potkin SG, Alva G, Fleming K et al. A PET study of the pathophysiology of negative symptoms in schizophrenia.
Positron emission tomography. Am. J. Psychiatry 2002;
159: 227–237.
15. Sponheim SR, McGuire KA, Stanwyck JJ. Neural anomalies during sustained attention in first-degree biological rela- tives of schizophrenia patients. Biol. Psychiatry 2006; 60:
242–252.
16. Okada G, Okamoto Y, Morinobu S, Yamawaki S, Yokota N. Attenuated left prefrontal activation during a verbal fluency task in patients with depression. Neuropsychobiol- ogy 2003; 47: 21–26.
17. Goethals I, Audenaert K, Jacobs F et al. Blunted prefrontal perfusion in depressed patients performing the Tower of London task. Psychiatry Res. 2005; 139: 31–40.
18. Matsuo K, Glahn DC, Peluso MA et al. Prefrontal hyperac- tivation during working memory task in untreated indi- viduals with major depressive disorder. Mol. Psychiatry 2007; 12: 158–166.
19. Grimm S, Beck J, Schuepbach D et al. Imbalance between left and right dorsolateral prefrontal cortex in major depression is linked to negative emotional judgment: An fMRI study in severe major depressive disorder. Biol. Psy- chiatry 2008; 63: 369–376.
20. Wagner G, Sinsel E, Sobanski T et al. Cortical inefficiency in patients with unipolar depression: An event-related FMRI study with the Stroop task. Biol. Psychiatry 2006; 59:
958–965.
21. Robertson IH, Manly T, Andrade J, Baddeley BT, Yiend J.
‘Oops!’: Performance correlates of everyday attentional failures in traumatic brain injured and normal subjects.
Neuropsychologia 1997; 35: 747–758.
22. First MB, Spitzer RL, Gibbon M, Williams JBW. Structured Clinical Interview for DSM-IV Axis I Disorders. New York
State Psychiatric Institute, Biometrics Research, New York, 1995.
23. Kay SR, Fiszbein A, Opler LA. The positive and negative syndrome scale (PANSS) for schizophrenia. Schizophr.
Bull. 1987; 13: 261–276.
24. Beck AT, Ward CH, Mendelson M, Mock J, Erbaugh J. An inventory for measuring depression. Arch. Gen. Psychiatry 1961; 4: 561–571.
25. Annett M. A classification of hand preference by associa- tion analysis. Br. J. Psychol. 1970; 61: 303–321.
26. Lim YR, Lee WK, Lee WH, Park JW. The study on the accuracy and validity of Korean Wechsler Intelligence Scale short form: A comparison of the WARD7 subtest vs Doppelt subtest. Korean J. Clin. Psychol. 2000; 19: 563–
574.
27. Vuilleumier P. How brains beware: Neural mechanisms of emotional attention. Trends Cogn. Sci. 2005; 9: 585–
594.
28. Ekman P, Friesen WV. Pictures of Facial Affect. Consulting Psychologists Press, Palo Alto, CA, 1976.
29. Cheyne JA, Solman GJ, Carriere JS, Smilek D. Anatomy of an error: A bidirectional state model of task engagement/
disengagement and attention-related errors. Cognition 2009; 111: 98–113.
30. Talairach J, Tournoux P. A Co-Planar Stereotaxic Atlas of A Human Brain. Thieme, Stuttgart, 1988.
31. Brett M, Anton J, Valabregue R, Poline JB. Region of inter- est analysis using an SPM toolbox [abstract]. Presented at the 8th International Conference on Functional Mapping of the Human Brain. June 2–6, Sendai, Japan. Neuroimage 2002; 16 (Suppl. 1): 1140–1141.
32. Troster AI, Woods SP, Fields JA et al. Neuropsychological deficits in essential tremor: An expression of cerebello- thalamo-cortical pathophysiology? Eur. J. Neurol. 2002; 9:
143–151.
33. Fan J, McCandliss BD, Fossella J, Flombaum JI, Posner MI.
The activation of attentional networks. Neuroimage 2005;
26: 471–479.
34. Bonelli RM, Cummings JL. Frontal-subcortical circuitry and behavior. Dialogues Clin. Neurosci. 2007; 9: 141–151.
35. Braet W, Johnson KA, Tobin CT et al. Functional deve- lopmental changes underlying response inhibition and error-detection processes. Neuropsychologia 2009; 47:
3143–3151.
36. Fassbender C, Murphy K, Foxe JJ et al. A topography of executive functions and their interactions revealed by functional magnetic resonance imaging. Brain Res. Cogn.
Brain Res. 2004; 20: 132–143.
37. Woldorff MG, Hazlett CJ, Fichtenholtz HM, Weissman DH, Dale AM, Song AW. Functional parcellation of atten- tional control regions of the brain. J. Cogn. Neurosci. 2004;
16: 149–165.
38. Lawrence NS, Ross TJ, Hoffmann R, Garavan H, Stein EA.
Multiple neuronal networks mediate sustained attention.
J. Cogn. Neurosci. 2003; 15: 1028–1038.
39. Wang K, Fan J, Dong Y, Wang CQ, Lee TM, Posner MI.
Selective impairment of attentional networks of orienting and executive control in schizophrenia. Schizophr. Res.
2005; 78: 235–241.
40. Kastner S, Ungerleider LG. Mechanisms of visual attention in the human cortex. Annu. Rev. Neurosci. 2000; 23: 315–
341.
41. Rubia K, Smith AB, Woolley J et al. Progressive increase of frontostriatal brain activation from childhood to adult- hood during event-related tasks of cognitive control. Hum.
Brain Mapp. 2006; 27: 973–993.
42. O’Grada C, Barry S, McGlade N et al. Does the ability to sustain attention underlie symptom severity in schizo- phrenia? Schizophr. Res. 2009; 107: 319–323.
43. van der Meere J, Borger N, van Os T. Sustained attention in major unipolar depression. Percept. Mot. Skills 2007; 104:
1350–1354.
44. Kim LS, Hwang HS, Jon DI, Ham BJ, Seok JH. Dysfunction of the neural network associated with sustained attention in cancer patients with clinically significant depressive symptoms. Neurosci. Lett. 2008; 447: 1–6.
45. Bora E, Vahip S, Akdeniz F et al. The effect of previous psychotic mood episodes on cognitive impairment in euthymic bipolar patients. Bipolar Disord. 2007; 9: 468–
477.
46. Politis A, Lykouras L, Mourtzouchou P, Christodoulou GN. Attentional disturbances in patients with unipolar psychotic depression: A selective and sustained attention study. Compr. Psychiatry 2004; 45: 452–459.
47. Lavie N. Perceptual load as a necessary condition for selec- tive attention. J. Exp. Psychol. Hum. Percept. Perform. 1995;
21: 451–468.
48. Lepage M, Sergerie K, Benoit A, Czechowska Y, Dickie E, Armony JL. Emotional face processing and flat affect in schizophrenia: Functional and structural neural correlates.
Psychol. Med. 2011; 41: 1833–1844.
49. van Laar MW, Volkerts ER, Verbaten MN, Trooster S, van Megen HJ, Kenemans JL. Differential effects of amitrip- tyline, nefazodone and paroxetine on performance and brain indices of visual selective attention and work- ing memory. Psychopharmacology (Berl) 2002; 162: 351–
363.