The politic plan research for furniture industrial activation in the northern part of Gyeonggi-Province
Kwang-Soon Im†1, Houn-Chul Kim2
ABSTRACT
This study attempted to investigate the effect of panel thickness on the horizontal density distribution (HDD) of medium density fiberboard (MDF) in a destructive way. Full size MDF panels with five different thicknesses such as 2 mm, 4.5 mm, 9 mm, 18 mm and 30 mm were cut into two different specimen sizes, i.e., 500 x 500 mm and 120 x 120 mm to measure the HDD . In general, the overall density of MDF panel diminished as the thickness increased, showing the highest density for the thinnest MDF panels. The HDD variation was significant for the samples of smaller specimen size (120 mm x 120 mm). MDF panel thickness significantly influenced to the HDD, which increased as the thickness decreased. In addition, the thinner panels showed much wider range in the HDD than those of thicker panels. The coefficient of variation (COV) of HDD also followed a similar trend to the panel density as the thickness increased. In summary, MDF panel thickness had a significant impact on the HDD within a panel. The sample size also showed a considerable effect to the HDD of MDF panels.
Key words: medium density fiberboard, panel thickness,horizontal density distribution.
요 약
본 연구는중밀도섬유판(MDF)의보드두께에 따른 수평밀도분포(HDD: horizontal density distribution)를 조사하기 위해 수행하였다. 생산공장에서 제조된 보드두께가 다른 5 종류 즉 2 mm, 4.5 mm, 9 mm, 18 mm 및 30 mm 의 원판을 두 가지 다른 시편크기 즉 500 x 500 mm 와 120 x 120 mm 로 제작하여수평밀도분포를 측정하였다. 전체적으로 MDF 의 밀도는 보드두께가 증가할수록 감소하는 경향을 보였으며, 가장 얇은 보드두께의 MDF 가 가장높은 밀도를 나타내었다. 수평밀도분포의 변이는 작은 크기 즉 120 x 120 mm 의 시편에서 큰 차이를 보여 MDF 의 보드두께가 수평밀도분포에 큰 영향을 미치는 것으로 나타났으며 보드두께가 클수록 감소하는 경향을 나타내었다. 또 보드두께가 적을수록 수평밀도분포의 밀도분포는 컸으나 보드두께가 클수록 밀도범위가 좁게 나타났다. 수평밀도분포의 변이계수(COV)는 보드두께가 증가함에 따라 감소하는 경향을 보였다. 요약하면 MDF 보드두께는 수평밀도분포에 매우 큰 영향을 미치며시편의 크기 또한 상당한 영향을 미치는 것으로 나타났다.
Received for publication: Aug 03, 2010 ; Reviewed: Sep 10, 2010 ; Accepted: Nov 17, 2010.
1) Department of Wood Science & Technology, Kyungpook National University, Daegu, 702-701, Korea.
2) R & D Team, Sunchang Corporation, Incheon, 604-050, Korea.
1. INTRODUCTION
Various reconstituted wood-based composite panel products such as plywood (PLW), particleboard (PB), medium density fiberboard (MDF) and so on, have become increasingly popular, and are being used for manufacturing furniture, cabinets, or various building products. In fact, the total supply of these panels in the Republic of Korea was 5,230,000 m3, including production and consumption in 2009. Among these panels, plywood composed of 34%, which was 1,779,000 m3, and MDF was 35%, which was 1,840,000m3, and particleboard was 31% which was 1,611,000 m3. In particular, the total MDF production was 1,655,000 m3 in 2009, which was ranked as the 6th place in the world. In addition, the consumption of MDF is also gradually increasing every year.
As well known, physical and mechanical properties of these wood-based composite panels are very important in terms of quality and stability in services. Panel density gives a great impact on the physical and mechanical properties such as modulus of rupture (MOR), modulus of elasticity (MOE), or internal bond (IB) strength. So, it is widely accepted that panel density affects most of the physical and mechanical properties of wood composite panels (Maloney 1993; Suchsland and Woodson 1986; Kelly 1977). In particular, panel density has a considerable impact on flexural properties of wood-based composites. Thus, many research works has been done on the effects of panel density of oriented strand board (OSB), PB, or MDF (Lee and Stephens, 1988; Brochmannet al., 2004; Akbulut and Koc, 2004; Wang et al., 2007). For example, it was reported that panel density affected MOR and MOE as well as dimensional stability of MDF panels (Shi et al., 2005;
Caiet al., 2006)). In addition to affecting physical and mechanical properties, panel density also affects hygroscopic and acoustic properties, thermal conductivity and permeability due to the number of voids and void sizes (Kollmann and Coˆte´ 1968; Stritesky and Timusk 2005).
In general, the grater the density is, the better the properties are. However, a greater density panel requires more raw materials to reach a target panel density. The consolidation of raw materials into a panel could induce HDD in the panel because raw materials such as flakes, strands, particles, or fibers would be accumulated onto each other with various degrees of their contact in the panel. Thus, the HDD is affected by a number of factors. So, the HDD is often resulted either from uneven spread of furnish in the forming process, or variability in size, shape and other properties of the wood elements.
Within a panel, the HDD is determined by either destructive or non-destructive methods. In destructive method, a panel is cut into small sizes to measure weight and volume of specimens, which provides a density measurement. For an example, a typical study of within panel density variation has been carried out by extensive destructive measurement on commercial OSB panels (Kruse et al., 2000). The destructive method is a simple and easy way of obtaining the HDD although it is time-consuming.
By contrast, non-destructive methods include radiation-based densitometry using either X-ray or gamma-ray to scan the sample to get HDD. In fact X-ray method has been widely used for the measurement of HDD (Chen and Wellwood, 2002; Wang et al. 2007; Chen et al., 2010). This method also provides a repeated sampling with different spatial resolutions in the resulted radiation image (Chen et al., 2010). Even though adequate evidence is available to indicate that density is an important property of the wood composites related to all panel properties, a limited research has been dedicated to actual measurement of HDD of MDF panels at different thicknesses. Thus, this work was devoted to study the effects of panel thickness on the HDD of MDF panels.
2. Materials and methods
2-1 Materials
MDF panels with five different thicknesses used for this study were kindly supplied by a local MDF manufacture, Sunchang Corporation in Incheon, Korea. All MDF panels were produced by the same production line within two weeks. For each thickness of the MDF panel, a trimmed MDF panel right after the production was cut into eight pieces of 500 x 500 mm size, and then wrapped polyethylene bags for shipping.
2-2 Methods
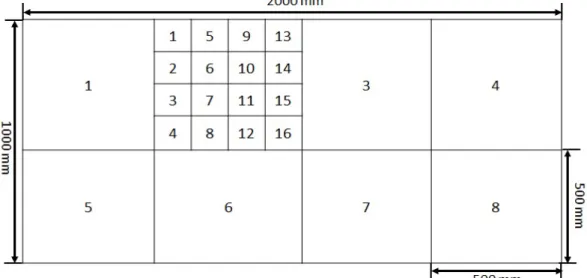
All MDF samples (500 mm x 500 mm) shipped to the laboratory were stored in the conditioning chamber with a controlled temperature and relative humidity environment. And these samples were kept in an environmental chamber for seven days at 20℃ and 65% relative humidity, and then used for measuring the weight and volume. The total of 40 specimens of 500 x 500 mm was used to measure panel density. Fig. 1 displays the sampling layout of MDF panels for the determination of average density and HDD. Each of these conditioned MDF samples were cut into sixteen smaller specimens of 120 mm x 120 mm size as shown in Fig. 1. Again, these specimens were also conditioned in the same chamber at the same temperature and relative humidity for another seven days. The total of 640 specimens was used to determine the HDD of MDF panels with five different thicknesses.
Fig. 1. Sampling layout for MDF panels, showing eight specimens for 500 mm x 500 mm, which provide sixteen specimens of 120 mm x 120 mm.
Typical physical and mechanical properties of the MDF panels used for this study were presented in Table 1. All these properties were measured according to the procedures of a standard
absorption measured after water immersion for 24 hours at 25℃ also showed a similar change, depending on thickness of MDF panels. In other words, physical properties of MDF panels were degraded as the thickness decreased,
Table 1.Typical physical and mechanical properties of MDF panels used for this study.
Thickness (mm)
Density (kg/m3)
MOR (kgf/cm2)
IB strength (kgf/cm2)
Thickness swelling (%)
Water absorption (%)
2.0 878 634 16.6 39.2 56.2
4.5 796 468 12.7 20.7 38.7
9.0 572 265 4.6 15.0 48.9
18.0 566 258 5.1 7.3 33.7
30.0 570 227 4.6 5.8 18.8
For the HDD measurement, the weight and volume of MDF panel specimens (120 mm x 120 mm) were determined by an aide of chemical balance and micrometer. The volume of the specimens was calculated by using the measured dimensions of the specimens. The average or HDD was obtained by dividing the weight with the volume. The coefficient of variation (COV) was also obtained for the specimens as shown below:
100 (%)
COV ··· (1) whereδ and μ are the standard deviation and mean of each measurement.
3. Results and discussions
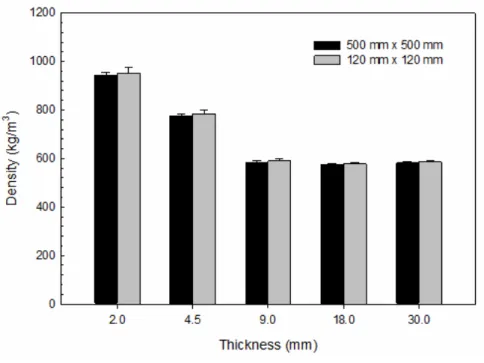
Fig. 1 represents average density values of MDF panels depending on panel thickness and sample size. As shown, the thinner the MDF panel is, the greater the density is. However, the sample size of the panel did not affect the average density values within measurement errors.
The HDD of MDF panels of 500 mm x 500 mm size, depending on panel thicknesses is exhibited in Fig. 3. Once again, thinner panels showed greater average density while thicker panels displayed lower average density. As expected from Table 1, Average densities of MDF with a thickness greater than 9 mm were quite similar each other. And the HDD of these MDF panels were not much different, depending on the panel thickness. However, 2 mm thick MDF panels showed the greatest variation in the HDD measurement among the five different panel thicknesses. The COV values of these MDF panels were presented in Table 2. The COV of 2 mm thick MDF panels was about 2%
while those of other panels were about 1% or less.
Fig. 2. Average density of MDF panels, depending on thickness and specimen size.
Table 2. COV of MDF panels (500 x 500 mm), depending on thickness
MDF thickness (mm) COV (%)
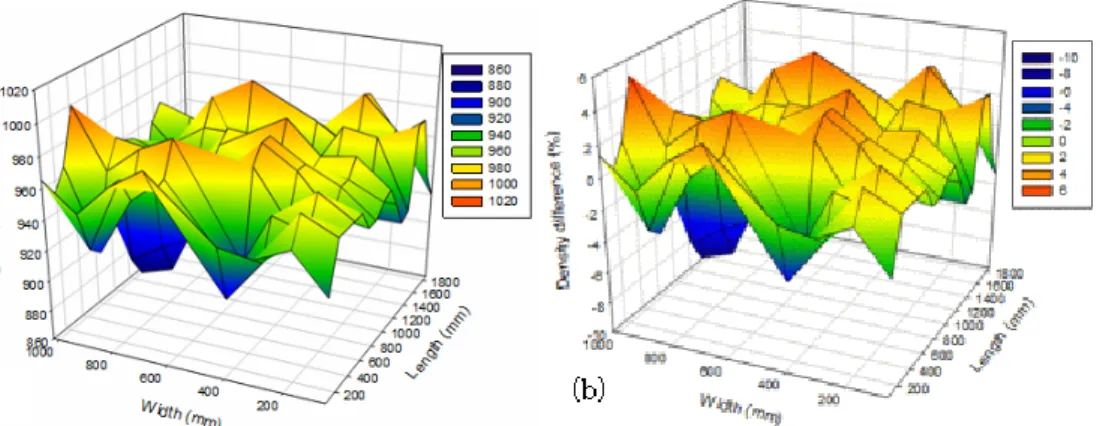
2.0 2.01 4.5 0.86 9.0 1.08 18.0 0.84 30.0 0.92 Fig. 4 displays three-dimensional profiles of the HDD for 2 mm thick MDF panels. The density difference percentage was calculated using the average panel density subtracted the actual density. Actual measurement profile (Fig. 4, a) and density difference (Fig. 4, b) showed the same trend as expected. Thus, all HDD profiles of other MDF panels were presented in terms of the density difference percentage. As expected, 2 mm thick MDF panels demonstrated a quite large variation in the HDD. Density differences of 2 mm thick MDF panel were about 5% and - 7% of the average density. Further discussion on the HDD of 2 mm thick MDF panels will be made in combination with a comparison with those of other thickness MDF panels.
(a)
Fig. 4. Comparison of the measured HDD with density difference for 2 mm thick MDF panels. (a) measured HDD, (b) density difference.
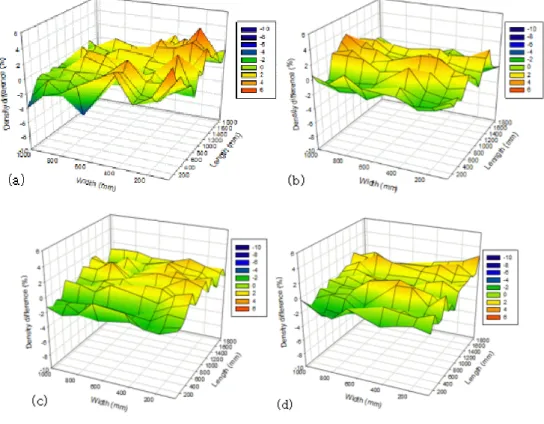
Fig. 5 shows three-dimensional profiles of the HDD for MDF panels with different thicknesses.
As expected, all MDF panels showed more or less HDD within a panel. In fact, density difference of 4.5 mm thick MDF panels was in the range of from 4.5% to -4.1%, which were narrower than those of 2 mm thick MDF panels. And 9 mm thick MDF panels resulted in density differences of 2.8% and -3.5% while 18 mm thick MDF panels resulted in density differences of about ±2.5%. 30 mm thick MDF panels showed a density difference of about ±2.2%. These results indicated that the extent of HDD was diminished as the thickness decreased. This result suggests that the homogeneity of mat consolidation of fibers is enhanced as the mat thickness increased. In other words, the chance of overlapping fibers in the fiber mat could be raised as the thickness became
larger, which could reduce the size of voids in the mat. A similar result has been reported by Steiner and Xu (1995).
Fig. 5. HDD profiles of MDF panels with different panel thicknesses. (a) 4.5 mm, (b) 9 mm, (c) 18 mm, and (d) 30 mm.
In order to better understand the HDD, we examined the range of density for the MDF panels used. Fig. 6 displays the frequency percentage of density ranges for 2 mm and 4.5 mm thick MDF panels. As shown, the density ranges of both 940 to 960 kg/m3 and 960 to 980 kg/m3 were dominant, which was about 63% of the total frequency percentage. However, 4.5 mm thick MDF panels exhibited about 51% frequency for the density range from 770 to 790 kg/m3. The density range of 580 ∼ 600 kg/m3 was 85.2% for 9 mm thickness. However, both 18 mm and 30 mm thicknesses showed 76.5% of 560 ∼ 580 kg/m3, and 75% of 580 ∼ 600 kg/m3 of the density ranges. These results indicated that thicker panel had a narrow range of the HDD of MDF panels.
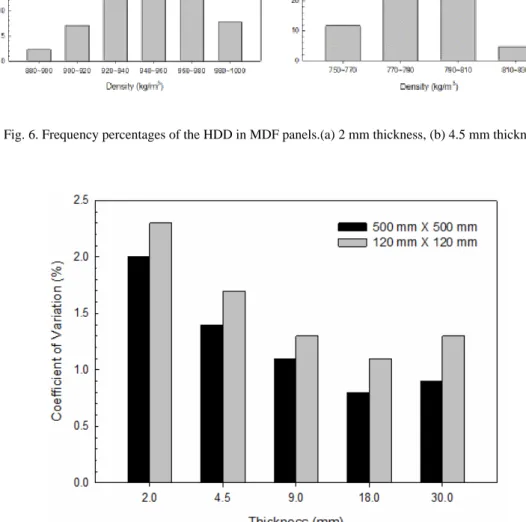
The COV values of the HDD for MDF panels as a function of the sample sizes and thicknesses were presented in Fig. 7. The COV values of MDF samples (500 mm x 500 mm) were smaller than those of MDF panels (120 mm x 120 mm). In addition, the COV value gradually decreased as the thickness increased except 5 mm thick panel. These results also suggest that smaller size MDF panels result in an increase in the COV. In other words, homogeneity of mat structure of the MDF panel increased as the thickness increased. Namely, the thinner MDF panel is, the less degree of homogeneity of the MDF panel is. This is why thinner MDF panels resulted in greater COV values
MDF samples. In other words, the COV value increased as the thickness decreased. As expected from the three-dimensional HDD profile, the COV of 2 mm thick MDF panels presented the highest value among the MDF panels used. This result is compatible with the three-dimensional profiles of HDD as shown Figs. 4 and 5.
Fig. 6. Frequency percentages of the HDD in MDF panels.(a) 2 mm thickness, (b) 4.5 mm thickness.
Fig. 7. COV of the MDF panel density, depending on thickness and specimen size.
4. Conclusion
This study was conducted to understand the effects of thickness on the HDD of MDF panels from five different thicknesses. Total of 640 samples were destructively prepared to determine the HDD of MDF panels with three sample sizes such as 1000 mm x 2000 mm, 500 mm x 500 mm, and 120 mm x 120 mm. MDF panel density diminished as the thickness increased. The thinnest MDF panels possessed the highest density. HDD variation was not significant for the sample size of 500 mm x 500 mm. However, the HDD had a quite large variation for 2 mm thick panels, but, it was reduced as the thickness increased. In addition, the thinner panels showed much wider range of the density than those of thicker panels. The COV variation of the HDD also followed a similar trend to the panel density as the thickness increased. In summary, MDF panel thickness had a significant impact on the HDD within a panel. The sample size also showed a considerable effect to the HDD of MDF panels.
5. References
Akbulut T, Koc E. 2004. The effects of the panel density, panel temperature and cutter sharpness during edge machining on the roughness of the surface and profiled areas of medium density fiberboard. Forest Products Journal 54(12): 67–70.
Brochmann J, Edwardson C, Shmulsky R. 2004. Influence of resin type and flake thickness on properties of OSB. Forest Products Journal 54(3): 51–55.
Cai Z, Muehl JH, Winandy JE. 2006. Effects of panel density and mat moisture content on processing medium density fiberboard. Forest Products Journal 56: 20–25.
Chen S, Wellwood R. 2002. Nondestructive evaluation of oriented strand board. In: Proceedings of the13th international symposium on nondestructive testing of wood, University of California, Berkeley, California, USA, August 19–21.
Chen S, Liu Xiahong, Fang L, Wellwood R. 2010. Digital X-ray analysis of density distribution characteristics of wood-based panels.Wood Science & Technology, 44: 85-93.
Kelly MW. 1977. Critical literature review of relationships between processing parameters and physical properties of particleboard. Gen. Tech. Rep. FPL-10.Forest Products Laboratory.Forest Service.US Department of Agriculture. USA, pp 66.
Kollmann FP, Coˆte´ WA. 1968. Principle of wood science and technology. Part I Solid wood.
Springer, Berlin.
Kruse K, Dai C, Pielasch A. 2000. An analysis of strand and horizontal density distributions in oriented strand board (OSB).HolzRohWerkst 58(4): 270–277.
Lee AWC, Stephens CB. 1988. Comparative shear strength of seven types of wood composite panels at high and medium relative humidity conditions. Forest Prod J 38: 49–52.
Maloney TM. 1993. Modern particleboard and dry-process fiberboard manufacturing. Miller Freeman, San Francisco, USA.
Shi JL, Zhang SY, Riedl B. 2005. Effect of juvenile wood on strength properties and dimensional stability of black spruce medium density fiberboard panels.Holzforschung 59(1): 1–9.
Steiner RP, Xu W. 1995. Influence of flake characteristics on horizontal density distribution of
Stritesky VF, Timusk PC. 2005. Moisture related properties of Oriented Strand Board (OSB). In:
10DBMC International conference on durability of building materials and components LYON, France, 17–20 April 2005.
Suchsland O, Woodson GE. 1986. Fiberboard manufacturing practices in the United States.
Agriculture Handbook No. 640.US Department of Agriculture.
Wang X, Salenikovich A, Mohammad M. 2007. Localized density effects on fastener holding capacities in wood based panels. Forest Prod J 57(1/2): 103–109.
KS F3200. 2006. Fiberboard, Korea Standard Association, Seoul, Korea.
Submission Information
Submission of Korean paper can be accepted for next Korean volume 22(1) before Nov 30, 2010.
Chief Editor, Journal of the Korea Furniture Society