Introduction
HCC is an aggressive cancer with a dismal outcomes mainly due to advanced stages at initial diagnosis, many recurrent cases and lack of effective treatment options.
Median overall survival for these advanced disease remains poor at less than 5 months and less than 10 % of the 5-year survival rate. Although chemotherapy is the main stay to treat advanced and recurrent HCC, the treatment outcome is still disappointing. After many years of discouraging results with conventional chemotherapy, sorafenib has been approved for the standard treatment of advanced HCC
1-4). Sorafenib is a multikinase inhibitor and it was shown to give 3-month medical survival benefit compared with placebo in advanced HCC. However, the time to symptomatic progression was not prolonged. The reason
for this might be presence of symptoms associated with the adverse effects of sorafenib and tumor related symptoms itself. This implies sorafenib has relatively strong toxic effects.
Korean herbal medicine (KHM) are often applied as one of the treatment options for cancer patients with wide public acceptance in Korea. Many studies have been done about how natural herbal medicines work against HCC
5-6). Flowerpot parts of Typha orientalis Presl (Typhaceae), Typhae Pollen (TP) have been traditionally used for difficulty in urination, galactophoritis purulenta, whooping cough, and allergic dermatitis in Korean medicine
7,8). TP have anti-inflammatory and antioxidative
8,9), hypolipidemic and anti-diabetic
7)and others effects
10,11), and also used to treat the hemorrhagic disease effect on promoting circulation and removing stasis
12). Especially, Jin et al.
13)Anticancer Effects of Typhae Pollen on HepG2 Human Hepatocellular Carcinoma
Jeong-Hyun Joo, Kyung-Soon Kim
1, Hong-Sik Choi
1, Seung-Mo Kim
1*
Comprehensive & Integrative Medicine Hospital,
1 : Department of Internal Medicine, College of Oriental Medicine, Daegu Haany University
The aim of this study was to evaluate the antitumor activities of Typhae pollen (TP) by confirming in vitro cytotoxicity and in vivo anti-tumor and immune-modulatory effect with anti-cachexia effect. The MTT assay is used in HepG2 cell to detect potential cytotoxic activities of aqueous extract of Typhae pollen (TPe). After HepG2 tumor cell implantation, eight mice per groups were assigned to six groups. Three different dosages of TPe (500, 250 and 125 ㎎/
㎏) were orally administered in the amount of 10 ㎖/㎏ and sorafenib also administered 20㎎/㎏, every day for 35 days from 28 days after the tumor cell implantation. We observed the changes on body weights, tumor volume and weights, lymphatic organ, serum interferon (IFN)-γ levels, splenocytes and peritoneal NK cell activity, splenic tumor necrosis factor (TNF)-α, interleukin (IL)-1β, IL-10 contents. Periovarian fat weights, serum IL-6 levels, thicknesses of deposited periovarian adipose tissue and mean diameters were also detected to monitor the tumor-related anticachexic effects.
In tumor masses, the immunoreactivities of cleaved caspase-3 and cleaved poly (ADP-ribose) polymerase (cleaved PARP) - apoptotic marks, cyclooxygenase-2 (COX-2), inducible nitric oxide synthases (iNOS) and tumor necrosis factor (TNF)-α were additionally observed by immunohistochemistry. The results were compared with sorafenib. Decreases of COX-2 were demonstrated in sorafenib and TPe treated mice and also increases of iNOS in tumor masses were observed in TPe, not in sorafenib. TPe increased periovarian fat pad weights compared with tumor-bearing controls and sorafenib treated mice. TPe showed increases of splenic TNF-α, IL-10 and IL-1β, serum IFN-γ and NK cell activities corresponding to increases of spleen weights, lymph node weights and non-atrophic changes of lymph nodes.
Our results show oral treatment of TPe 500, 250 and 125 ㎎/㎏ has potent in vitro and in vivo antitumor activities through modest cytotoxic effects, immunomodulatory effects and apoptotic activities in HepG2 tumor cells. In addition, TPe can prevent cancer related cachexia.
keywords : Typhae Pollen, HepG2, Hepatocellular carcinoma, Anti-cancer
* Corresponding author
Seung-Mo Kim, College of Korean Medicine, Daegu Haany University, 136, Sincheondong-ro, Suseong-gu, Daegu, Korea
·E-mail : [email protected] ·Tel : +82-53-770-2111
·Received : 2018/03/31 ·Revised : 2018/07/05 ·Accepted : 2018/08/22
ⓒ The Society of Pathology in Korean Medicine, The Physiological Society of Korean Medicine pISSN 1738-7698 eISSN 2288-2529 http://dx.doi.org/10.15188/kjopp.2018.08.32.4.261 Available online at https://kmpath.jams.or.kr
reported that methanol extract of TP induced G2/M arrest and apoptosis in human colon adenocarcinoma HT29 cells.
However, there are no reports showing antitumor effects of TP on hepatocelluar carcinoma, to the best of my knowledge.
The aim of this study was to evaluate the antitumor activities of TP by confirming in vitro cytotoxicity and in vivo anti-tumor and immune-modulatory effect with anti-cachexia effect.
Materials and Methods
1. Preparations of TPe
Dried TP was purchased from local herb shop (Jecheonhanbangyakcho, Jecheon, Korea) under inspection of herbologist (Dr. Park KY). Total 500 g of TP were put and heated in 5,000 ㎖ of distilled water for 4 hrs and this process was repeated 3 times at 60 ℃, and evaporated using the evaporator (Eyela N-1110, Tokyo, Japan), then completely lyophilized using a programmable freeze dryer (FDB-5503, Operon, Kimpo, Korea). Total 96.15 g (yield = 19.23%) of TPe were acquired, and were stored at 20 ℃ in a refrigerator to not to be exposed to light and moisture, and some specimens of TPe (TPe2015Ku01) were stored in the specimen room of the Medical Research Center for Globalization of Herbal Formulation in Daegu Haany University (Gyeongsan, Korea).
White powder of sorafenib (Jeil Pharm. Co., Yongin, Korea) was used as control drug. Each sorafenib was kept 4
℃ in a refrigerator to block humidity and light. In this experiment, TPe and sorafenib were well dissolved, up to 50
㎎/㎖ and 2 ㎎/㎖ solutions in distilled water as vehicle.
2. In vitro MTT assay
HepG2 (Human hepatocellular carcinoma cells;
HB-8065, American Type Culture Collection Center, Manassas, VA, USA) cells were kept in RPMI 1640 media (Gibco BRL, Grand Island. NY, USA) contains 100 U/㎖
penicillin and 10 ㎍/㎖ streptomycin (Sigma-Aldrich, St.
Louise, MO, USA), 10 % fetal bovine serum (FBS; Gibco BRL, Grand Island. NY, USA) at 37 ℃ with 5 % CO
2saturation. In short, Seeding HepG2 cells into 96-well plates with 1×10
4cells/well and maintained in the incubator during 24 hrs. That cells treated with different concentrations of sorafenib (0, 0.1, 1, 2, 4, 6, 8 and 10 μM) or TPe (0, 0.01, 0.1, 1, 10, 50, 100 and 1,000 ㎍/㎖) mixed in distilled water during 72 hrs. MTT solution (0.5 ㎍/㎖) was seeded to the wells in the culture medium. After 4 hrs more incubation,
removed the medium and added DMSO (Sigma-Aldrich, St Louis, MO, USA) to the plates. The absorbance at 570 ㎚ was checked using a microplate reader (Tecan; Mannedorf, Switzerland), after then relative of negative control (0 ㎍/㎖
or 0 μM) and IC
50were calculated. Six independent MTT assays was repeatedly used in this study.
3. In vivo HepG2 cell xenograft mouse 1) Animals and husbandry
After 14 days acclimatization, a total of one hundreds twenty virgin, specific pathogen-free female CAnN.Cg-Foxn1<nu>/CrlCrlj BALB/c-nu/nu mice (5-wk ago receipt; 14-18 g of body weights; Charles River, Tsukiba, Japan) were used. Animals were grouped four to five each filter capping polycarbonate cage in 20-25 ℃ temperature and 45-55 % humidity controlled aseptic clean room with 12 hr light and 12 hrs dark schedule. The mice were fed sterilized feed (Samyang, Korea) for 12 hrs and supplied water freely. One hundred ten mice were used as tumor-bearing mice and the ten remainder mice were used as intact control. On 28 days after the tumor implantation, eight mice per group checked regular body weights (intact mice: 24.40±0.63 g, ranged in 23.60~25.30 g; tumor bearing mice: 22.07±0.90 g, ranged in 20.40~23.70 g) and tumor volumes (115.47±9.43 ㎣, ranged in 101.75~139.54 ㎣) were chosen and used for further experiments in this study. All of the animals were treated as to the international guidelines of use, care and welfare of laboratory animals, and certified by the Institutional Animal Care and Use Committee at Daegu Haany University (Gyeongsan, Gyeongbuk, Korea) [Approval No DHU2015-076, 2015. 12. 05].
2) Tumor cells xenograft and drug administration
HepG2 cells were grown in saline as 1×10
8cell/㎖
concentration, and 0.2 ㎖ of cell suspensions (2×10
7cell/mouse) were implanted under the right dorsal hip skins of each mouse. Instead of tumor cell injections, the same volume of saline was injected in under the skin of intact control mice. Three different dosages of TPe (500, 250 and 125 ㎎/㎏) were orally administered in the amount of 10 ㎖/
㎏, daily for 35 days from 28 days after the tumor cell implantation (tumor volumes reached almost 100 ㎣)
14). There are no available efficacy dosage in vivo tests for TP, the highest dosage of TPe was selected as 500 ㎎/㎏
considering crude extracts, relatively higher efficacy
concentration on the previous in vitro antitumor activity
test
13)and also in the present MTT assay. In addition, 250
and 125 ㎎/㎏ were selected as the middle and lowest
dosages of TPe using common ratio 2, respectively. Once
daily for 35 days from 28 days after the tumor cell implantation, sorafenib was also orally administered in 10 ㎖ /㎏ of solution (dissolved in distilled water) at a dose level of 20 ㎎/㎏ as reported by before studies
15,16). Instead of test substances, intact controls and tumor-bearing mice were only supplied distilled water 10 ㎖/㎏ for comparison at the same time.
3) Body weight measurements
The changes on body weight were checked at 1 day before administration (27 days after tumor cell implantation), start day of the administration, 1 day, 7 day, 14 day, 21 day, 28 day and 34 day after start of the administration with the sacrifice by an automatic electronic balance (Instrument of precisa, Dietikon, Switzland), respectively. All of the mice were fasted for 18 hrs (except water) at the beginning and the ending of administration to minimize the differences from administration. The changes of body weight were respectively measured as [Body weight at sacrifice body weight at initial administration].
4) Tumor volume measurements
Except intact control mice, tumor width (short axis) and tumor length (long axis) of every tumor-bearing mice were checked 1 day before administration, start of the administration, 1 day, 3 day, 7 day, 14 day, 21 day, 28 day, 34 day and 35 days after start the administration by electronic digital caliper (Mytutoyo, Tokyo, Japan) and were measured tumor volumes using [1/2×width
2×length] as reported by before studies
17). To minimize the individual differences, the changes of tumor volume were also measured as [Tumor volume at the sacrifice Tumor volume at the start of administration] after the 35 days test material administrations.
5) Tumor weight and Periovarian fat pad and Lymphatic weight measurements
Tumor mass of each mouse were measured after removing the he surrounding skins, muscles, connective tissues and any debris form the sacrifice. The weight was measured at g levels about absolute wet-weights. To minimize the individual weight differences, the relative tumor (organ) weight(%) was measured using as [(Absolute tumor(organ) weights / body weight at the sacrifice) × 100].
6) Serum IFN-γ and IL-6 level measurements
Whole blood (1 ㎖) was sampled from vena cava at the sacrifice under anesthetized with 2 to 3 % isoflurane in the mixture of 70 % N
2O and 28.5 % O
2using rodent inhalation anesthesia apparatus (Surgivet, Waukesha, WI, USA) and rodent ventilator (Model687, Harvard Apparatus, Cambridge, UK), and separated the serum. The serum samples were
quickly frozen at 150 ℃ and stored until assayed. The serum IL-6 levels were detected with test kits using enzyme-linked immunosorbent assay (ELISA) technique (R&D Systems, Minneapolis, MN, USA) as following previous method
18), and the serum IFN-γ levels were also detected using mouse ELISA kit for IFN-γ (BD Biosciences Pharmingen, San Francisco, CA, USA) as manufacturer's recommended protocols.
7) NK cell activity measurements
Peritoneal NK cell and splenic activities was calculated by using the standard
51Cr release assay
19,20). The percentage of specific
51Cr Release was measured as [[(Exp–
S)/(M–S)] 100 % (Where, Exp is the observed released
51Cr value, Sis the spontaneously released
51Cr value and Mis the maximum released
51Cr value)].
8) Splenic cytokine content measurements
Concentrations of TNF-α, IL-10 and IL-1β in spleen were assessed using commercial ELISA kits as before methods
21,22). A standard curve extrapolated from each assays that was performed in duplicate and demonstrated an average coefficient of variance of <10 %.
9) Histopathology
After weights of the sacrifice were measured, some portions of tumor mass, left side of submandibular lymph node, spleen and periovarian fat pads were isolated and preserved in 10 % neutral buffered formalin (NBF) at least for 24 hrs. After embedded in paraffin, obtain 3 ㎛-thick sections. Then those sections were dyed with hematoxylin and eosin stain (H&E). Histology was evaluated on the central zone of tumor mass or each organ. To detect more minute changes, tumor cell volumes, regions occupied with intact tumor cell and apoptotic tumor cell were analyzed in each prepared samples by automated image analyzer (iSolution FL version 9.1, IMT i-solution Inc., Quebec, Canada) under microscopy (Nikon, Tokyo, Japan)
23). Total thickness of central cross spleen (㎜/spleen), the number of white pulp (/㎟ of spleen) and diameters (㎛/white pulps), total thicknesses of submandibular lymphnode (㎛/central regions), the number of cortex lymphoid follicles (numbers/
㎟ of cortex) and cortex thicknesses (㎛/lymph node) were also analyzed as previous studies
22,23). In addition, mean diameters of white adipocyte (μm/white adipocytes) and total thicknesses (㎛/central regions) were analyzed by automated image analyzer as previous studies
23,24).
10) Immunohistochemistry
The immunohistochemistrical changes of caspase-3,
PARP, COX-2, iNOS and TNF-α in the tumor masses were
examined by purified primary antibodies with
avidin-biotin-peroxidase complex (ABC) and peroxidase substrate kit (Vector Labs, Burlingame, CA, USA).
Endogenous peroxidase activity was blocked by treated with 0.3 % hydrogen peroxide (H
2O
2) in methanol for 20-30 min and non-specific binding of immunoglobulin was also blocked with horse serum blocking solution at 95-100 ℃ for 1 hr based on 10 mM citrate buffers (pH 6.0)
25). Primary antiserum was incubated overnight at 4 ℃ with ABC reagents and biotinylated universal secondary antibody for 1 hr at room temperature in humidity. Finally, sections were treated again with peroxidase substrate kit at room temperature for 3 min. A three times rinse of the all sections with 0.01 MPBS was carried out between each of incubations
23). The percentage regions of immunoreactivities, density of caspase-3 and PARP
26,27), TNF-α
28), COX-2 and iNOS
29,30)cells over 20 % were regarded as positive and calculated by automated imagean alyzer (%/㎟ of tumor mass)
23,31).
4. Statistical analysis
The Levene test
32)analyzed the homogeneity of variance. If the Levene test showed non-significant variance, the obtained data were analyzed by using one way analysis of variance (ANOVA) test and then by least-significant differences multi-comparison (LSD) test to investigate which pairs of group comparison were statistically different. Otherwise the Levene test showed non-significant variance, conducted Kruskal-Wallis H test that is a non-parametric method for testing. When significant difference was showed in Kruskal-Wallis H test, the Mann-Whitney U (MW) test was measured to select the specific pairs of group. IC
50value were calculated in Probit analysis. Statistical and Probit analysis were performed using SPSS program for Windows (Release 14.0K, SPSS Inc., Chicago, IL, U.S.A)
33).
Results
1. Results of MTT assay
1) Effects of TPe and Sorafenib on HepG2 cell proliferations
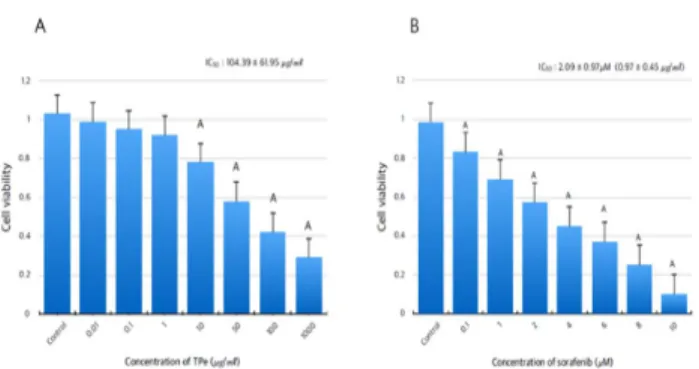
The survivability of HepG2 tumor cells significantly decreases in TPe treatment from 10 ㎍/㎖ to 1,000 ㎍/㎖
concentration (p<0.01). The IC
50of TPe against HepG2 tumor cells was measured as 104.39 ± 61.95 ㎍/㎖ in this study (Fig 1a).
The survivability of HepG2 tumor cells significantly decreases in sorafenib treatment from 0.1 μM to 10 μM
concentration (p<0.01). The IC50 of sorafenib against HepG2 tumor cells was measured as 2.09± 0.97 μM (0.97 ± 0.45 μ g/㎖) in this study(Fig 1b).
Fig. 1. Effects of TPe and Sorafenib on the HepG2 Cell Viabilities. The values are expressed Mean ± SD of each six experiments. TP=Typhae Pollen, Flowerpot of Typha orientalis Presl (Typhaceae), TPe=Aqueous extracts of TP, IC
50= 50 % inhibition concentration. Cells were treated with 0 (control), 0.1, 1, 2, 4, 6, 8 and 10 μM of sorafenib dissolved in media, and cultured for 72 hrs. Ap<0.01 versus control (0 μM) by LSD test.
2. Results on HepG2 cell xenograft nude Mice 1) Effects on body weights
Selected mice based on tumor volumes and body weights, at 27 days after HepG2 cell inoculation. The body weights of tumor-bearing control groups significantly decreased before the initial treatment as compared with intact control groups (p<0.01). Body weight gains also significantly decreased for 35 days oral administration (p<0.01). However, the body weights of TPe 500 ㎎/㎏
significantly increased as compared with tumor-bearing control groups from 21 days after the initial administration (p<0.01), and from 28 days after the initial administration in TPe 250 and 125 ㎎/㎏ treated groups also significantly increased (p<0.01 or p<0.05). The body weight gains of all the three different dosages TPe treated groups significantly increased as compared with tumor-bearing control groups (p<0.01). On the other hand, the body weights of sorafenib 20 ㎎/㎏ treated groups significantly decreased from 14 days after the first administration (p<0.01 or p<0.05), and the body weight gains during 35 days oral administraion also significantly decreased as compared with tumor-bearing control groups (p<0.01) (Fig 2a).
2) Effects on tumor volumes
The tumor volumes of sorafenib 20 ㎎/㎏ treated groups significantly decreased as compared with tumor-bearing control groups from the 1 day of administration (p<0.01). After the ending of the 35 days administration, the tumor volume changes of sorafenib 20
㎎/㎏ treated groups also significantly decreased as
compared with tumor-bearing control groups in this study
(p<0.01). The tumor volumes of TPe 500, 250 and 125 ㎎/㎏
treated groups also dose-dependently and significantly decreased from 7 or 14 days after the initial administration, respectively (p<0.01). After the ending of the 35 days administration, the tumor volume changes of all the three different dosages TPe treated groups also dose-dependently and significantly decreased as compared with tumor-bearing control groups, in this study (p<0.01) (Fig 2b).
Fig. 2. Changes on the Body Weights and Tumor Volumes. The values are expressed Mean ± SD of eight mice, g, ㎣. TP = Typhae Pollen, Flowerpot of Typha orientalis Presl (Typhaceae), TPe = Aqueous extracts of TP. All test materials were orally administered, every day for 35 days. (a)
A
p<0.01 versus intact control by LSD test. Bp<0.01 and Cp<0.05 versus TB control by LSD test. (b)
Ap<0.01 versus tumor-bearing control by LSD test.
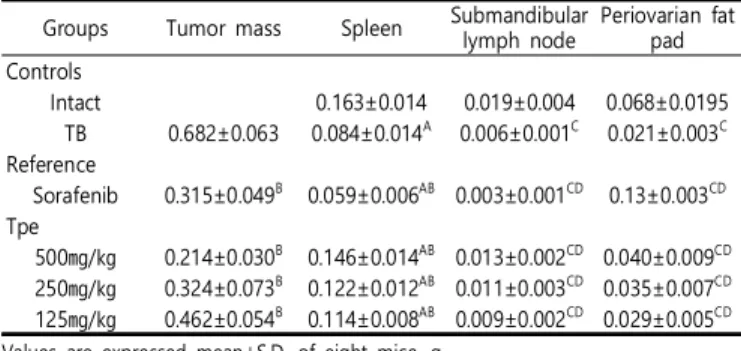
3) Effects on tumor weights
The absolute and relative (% of body weight) tumor weights in all drug administrered groups significantly decreased as compared with tumor-bearing control groups at the sacrifice including TPe 125 ㎎/㎏ treated groups in this study (p<0.01). The tumor weights in 500, 250 and 125
㎎/㎏ TPe treated groups obvious dose-dependently and significantly decreased as compared with tumor-bearing control groups at the sacrifice, respectively (p<0.01)(Table 1a, 1b).
4) Effects on spleen weights
The absolute and relative spleen weights in tumor-bearing control groups significantly decreased as compared with intact control groups, respectively (p<0.01).
However, spleen weights in 500, 250 and 125 ㎎/㎏ TPe treated groups dose-dependently and significantly increased as compared with tumor-bearing control groups, respectively (p<0.01). But each of the absolute and relative spleen weights in sorafenib 20 ㎎/㎏ treated groups significantly decreased as compared with tumor-bearing control groups (p<0.01) (Table 1a, 1b).
5) Effects on submandibular lymph node weights
The absolute and relative weights of submandibular lymph node in tumor-bearing control groups significantly decreased as compared with intact control groups,
respectively (p<0.01). However, submandibular lymph node weights in 500, 250 and 125 ㎎/㎏ TPe treated groups dose-dependently and significantly increased as compared with tumor-bearing control groups (p<0.01 or p<0.05). On the other hand, the absolute and relative submandibular lymph node weights in sorafenib 20 ㎎/㎏ treated groups significantly decreased as compared with tumor-bearing control groups, respectively (p<0.05 or p<0.01) (Table 1a, 1b).
6) Effects on periovarian fat pad weights
The absolute and relative weights of periovarian fat pad in tumor-bearing control groups singificantly decreased as compared with intact control groups, respectively (p<0.01). However, periovarian fat pad weights in 500, 250 and 125 ㎎/㎏ TPe treated groups dose-dependently and significantly increased as compared with tumor-bearing control groups (p<0.01 or p<0.05). On the other hand, the absolute and relative periovarian fat pad weights in sorafenib 20 ㎎/㎏ treated groups significantly decreased as compared with tumor-bearing control groups, respectively (p<0.01) (Table 1a, 1b).
Table 1. Absolute and Relative Changes on the Organ Weights and Tumor Mass.
A. Absolute Changes on the Organ Weights and Tumor Mass Groups Tumor mass Spleen Submandibular
lymph node Periovarian fat pad Controls
Intact 0.163±0.014 0.019±0.004 0.068±0.0195
TB 0.682±0.063 0.084±0.014
A0.006±0.001
C0.021±0.003
CReference
Sorafenib 0.315±0.049
B0.059±0.006
AB0.003±0.001
CD0.13±0.003
CDTpe
500㎎/㎏ 0.214±0.030
B0.146±0.014
AB0.013±0.002
CD0.040±0.009
CD250㎎/㎏ 0.324±0.073
B0.122±0.012
AB0.011±0.003
CD0.035±0.007
CD125㎎/㎏ 0.462±0.054
B0.114±0.008
AB0.009±0.002
CD0.029±0.005
CD Values are expressed mean±S.D. of eight mice, gB. Relative Changes on the Organ Weights and Tumor Mass Groups Tumor mass Spleen Submandibular
lymph node Periovarian fat pad Controls
Intact 0.639±0.067 0.076±0.017 0.268±0.056
TB 3.379±0.447 0.462±0.083
A0.034±0.006
A0.112±0.0.16
EReference
Sorafenib 1.913±0.0373
C0.356±0.48A
C0.020±0.006
AD0.075±0.017
EGTpe
500㎎/㎏ 1.018±0.183
C0.690±0.087
C0.059±0.010
AC0.188±0.042
FG250㎎/㎏ 1.577±0.375
C0.595±0.074
C0.055±0.013
AC0.171±0.031
EG125㎎/㎏ 2.293±0.271
C0.563±0.031
BC0.046±0.010
AD0.145±0.024
EH Values are expressed mean±S.D. of eight mice, % of body weightsTP = Typhae Pollen, Flowerpot of Typha orientalis Presl (Typhaceae), TPe = Aqueous extracts of TP. Sorafenib was administered 20 ㎎/㎏, and TPe was orally administered, every day for 35 days. (a) Ap<0.01 versus intact control by LSD test, Bp<0.01 versus TB control by LSD test, Cp<0.01 versus intact control by MW test, Dp<0.01 versus TB control by MW test. (b) Ap<0.01 and Bp<0.05 versus intact control by LSD test, Cp<0.01 and Dp<0.05 versus TB control by LSD test, Ep<0.01 and Fp<0.05 versus intact control by MW test, Gp<0.01 and Hp<0.05 versus TB control by MW test.
7) Effects on serum IL-6 and IFN-γ levels
The serum IL-6 levels significantly increased, the IFN-
γ levels significantly decreased in tumor-bearing control groups as compared with intact control groups (p<0.01).
However, 500, 250 and 125 ㎎/㎏ TPe treated groups dose-dependently and significantly decreased in serum IL-6 levels and increased in serum IFN-γ levels compared to tumor-bearing control groups (p<0.01 or p<0.05). On the other hand, the serum IL-6 and IFN-γ level changes in sorafenib 20 ㎎/㎏ treated groups significantly became to worse as compared with tumor-bearing control groups in this study (p<0.01)(Fig 3.).
Fig. 3. Changes on the Serum levels of IL-6 and INF-γ. The values are expressed Mean ± SD of eight mice, pg/㎖. TP=Typhae Pollen, Flowerpot of Typha orientalis Presl (Typhaceae), TPe=Aqueous extracts of TP, TB=Tumor-bearing, IFN=Interferon, IL=Interleukin. Sorafenib was administered 20 ㎎/㎏, and TPe was orally administered, every day for 35 days. Ap<0.01 versus intact control by LSD test. Bp<0.01 versus TB control by LSD test. Cp<0.01 and Dp<0.05 versus intact control by MW test.
Ep<0.01 and Fp<0.05 versus TB control by MW test.
8) Effects on NK cell activity
The splenic and peritoneal NK cell activities in tumor-bearing control groups significantly decreased as compared with intact control groups, respectively (p<0.01).
However, NK cell activities in 500, 250 and 125 ㎎/㎏ TPe treated groups dose-dependently and significantly increased as compared with tumor-bearing control groups (p<0.01 or p<0.05). In contrast, the splenic NK cell activities significantly decreased (p<0.05) but the peritoneal NK cell activities non-significantly but obviously decreased in sorafenib 20 ㎎/㎏ treated groups as compared with tumor-bearing control groups.
9) Effects on splenic cytokine contents
The splenic TNF-α, IL-1β and IL-10 contents in tumor-bearing control groups significantly decreased as compared with intact control groups, respectively (p<0.01).
However, the splenic cytokine contents in 500, 250 and 125
㎎/㎏ TPe treated groups dose-dependently and significantly increased as compared with tumor-bearing control groups (p<0.01 or p<0.05). On the other hand, the splenic TNF-α, IL-1β and IL-10 contents in sorafenib 20 ㎎/㎏ treated
groups significantly and obviously decreased as compared with tumor-bearing control groups (p<0.01).
10) Effects on tumor mass histopathology and immunohistochemistry
The tumor masses showed solid and brownish block nodular and that are consisted of very undifferentiated polymorphic malignant hepatocellular carcinoma. The apoptotic cells in HepG2 showed acidophilic cytoplasms and nuclei condensation and frequent mitosis. However, the apoptotic tumor cells in tumor mass obviously increased in sorafenib 20 ㎎/㎏, and also in TPe 500, 250 and 125 ㎎/㎏
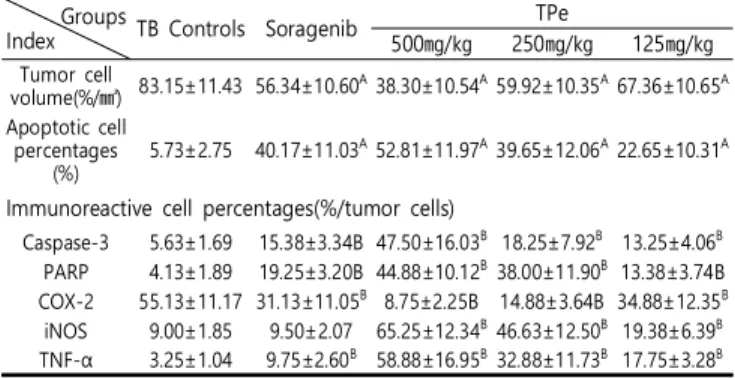
administered treated groups as compared with tumor-bearing control groups. Consequently, the tumor cell volumes significantly decreased in sorafenib, TPe 500, 250 and 125 ㎎/㎏ treated groups (p<0.01), but percentages of apoptosis cell in tumor masses significantly increased as compared to tumor-bearing control groups (p<0.01), respectively. Above all, markly dose-dependent cytotoxic effects against tumor-bearing control groups were seen in TPe 500, 250 and 125 ㎎/㎏ administered groups in this study (Table 2).
The caspase-3, PARP and TNF-α immunoreactivities in tumor masses significantly increased (p<0.01) and COX-2-immunolabeled cells decreased in all drug treated groups as compared with tumor-bearing control groups. In addition, the iNOS immunoreactivities significantly and dose-dependently increased in all of 500, 250 and 125 ㎎/㎏
TPe administered groups as compared with tumor-bearing groups (p<0.01), but the sorafenib 20 ㎎/㎏ groups did not significantly affected the iNOS immunoreactivities in tumor masses(Table 2).
Table 2. Changes on Histomorphometry of the Tumor Mass.
Groups
Index TB Controls Soragenib TPe
500㎎/㎏ 250㎎/㎏ 125㎎/㎏
Tumor cell
volume(%/㎟) 83.15±11.43 56.34±10.60A38.30±10.54A59.92±10.35A67.36±10.65A Apoptotic cell
percentages
(%) 5.73±2.75 40.17±11.03A52.81±11.97A39.65±12.06A22.65±10.31A
Immunoreactive cell percentages(%/tumor cells)
Caspase-3 5.63±1.69 15.38±3.34B 47.50±16.03B 18.25±7.92B 13.25±4.06B PARP 4.13±1.89 19.25±3.20B 44.88±10.12B38.00±11.90B 13.38±3.74B COX-2 55.13±11.17 31.13±11.05B 8.75±2.25B 14.88±3.64B 34.88±12.35B
iNOS 9.00±1.85 9.50±2.07 65.25±12.34B46.63±12.50B 19.38±6.39B TNF-α 3.25±1.04 9.75±2.60B 58.88±16.95B32.88±11.73B 17.75±3.28B COX-2=Cyclooxygenase-2, PARP= Poly(ADP-ribose) polymerase, TNF=Tumor necrosis factor, iNOS=Inducible nitric oxide synthases. Sorafenib was administered 20㎎/㎏, and TPe was orally administered, every day for 35 days. A p<0.01 versus TB control by LSD test, B p<0.01 versus TB control by MW test.
11) Effects on spleen histopathology
The splenic white pulp lymphoid cells of tumor-bearing
control groups were showed atrophic changes as compared
with intact control groups. As a result, each of the total splenic thicknessess, white pulp numbers and diameters significantly decreased in tumor-bearing groups compared with intact control groups (p<0.01). However, the treatment of TPe 500, 250 and 125 ㎎/㎏ significantly and dose-dependently inhibited these atrophic changes in spleen as compared with tumor-bearing control groups, respectively (p<0.05 or p<0.01). On the contrary, Total thicknesses, white pulp numbers and diameters on spleen significantly decreased in sorafenib 20 ㎎/㎏ treated groups as compared with tumor-bearing control groups in this study (Fig 4a).
12) Effects on submandibular lymph node histopathology The submandibular lymph nodes in tumor-bearing control groups were showed obviously atrophic change as compared with intact control groups that was related to decrease in lymphoid cells. As a result, each of the total and cortex thicknesses and follicle numbers significantly decreased in tumor-bearing control groups as compared with intact control groups (p<0.01). However, the treatment of TPe 500, 250 and 125 ㎎/㎏ dramatically and dose-dependently inhibited these atrophic changes in submandibular lymph node as compared with tumor-bearing control groups, respectively. The TPe 500 and 250 ㎎/㎏
treated groups significantly increased in the total and cortex thicknesses and follicle numbers of submandibular lymph node as compared with tumor-bearing control groups, respectively (p<0.01). TPe 125 ㎎/㎏ treated groups also significantly increased in the total thicknesses and follicle numbers of submandibular lymph node (p<0.01 or p<0.05), but non-significant but obviously increased in the cortex thicknesses of submandibular lymph node as compared with tumor-bearing control groups. The total and cortex thicknesses and follicle numbers of submandibular lymph node significantly decreased in sorafenib 20 ㎎/㎏
treated groups as compared with tumor-bearing control groups (Fig 4b).
13) Effects on periovarian fat pad histopathology
The periovarian fat tissues in tumor-bearing control groups were showed markly atrophic change as compared with intact control groups that was related to decrease in the sizes of white adipose cells. As a result, the mean diameters of white adipocyte and total deposited fat thicknesses significantly decreased in tumor-bearing control groups as compared with intact contror groups, respectively (p<0.01). However, the treatment of TPe 500 and 250 ㎎/㎏
significantly and dose-dependently inhibited those atrophic changes on the periovarian white adipose tissues as
compared with tumor-bearing control groups, respectively (p<0.01). In addition, TPe 125 ㎎/㎏ treated groups also significantly increased in the total deposited periovarian fat pad thicknesses (p<0.01), and non-significantly but obviously increased the white adipocyte diameters as compared to tumor-bearing control groups in this study. The total deposited periovarian fat pad thicknesses significantly decreased and the mean diameters of white adipocytes non-significantly but markly decreased in sorafenib 20 ㎎/㎏
intraperitoneally treated groups as compared with tumor-bearing control groups (Fig 4c).
Fig. 4. Spleen, Submandibular Lymph Node and Periovarian Fat Pad Histology. A=Intact vehicle control groups B=Tumor-bearing control groups C=Sorafenib 20 ㎎/㎏ treated groups D= TPe 500 ㎎/㎏ treated groups E=TPe 250 ㎎/㎏ treated groups F=TPe 125 ㎎/㎏ treated groups.
All Hematoxylin-Eosin(H&E) stain, (a)RP=Red pulps;WP=White pulps; Scale bars=400 ㎛ (b)CO=Cortex; MS=Medullary sinus;FO=Follicle;Scale bars=400
㎛ (C)OV=Ovary; Scale bars=100 ㎛
Discussion
Results described in this study show that Typhae Pollen (TP) inhibited cell proliferation dose-dependently with an IC
50of 104.39 in HepG2 cell line in vitro, and potently inhibited tumor growth, induced apoptosis, had immunomodulatory effects and prevented cancer related cachexia in HepG2 cell xenograft mice. Cell viability was measured using the MTT assay against HepG2 cells. In the present study, IC
50of TPe against HepG2 cells was measured as 104.39 ± 61.95 μg/㎖, showing modest cytotoxic effects on HepG2 cells. The TPe 250㎎ used in this experiment is approximately 1.25g in the human body. This dose is tolerable and applicable to humans.
In this study, after tumor cell inoculation on mice, we
observed that marked reductions of splenic TNF-α, IL-10
and IL-1β, serum IFN-γ and NK cell activities with
histopathological atrophic changes of submandibular and
spleen lymph nodes in HepG2 cell implanted xenograft
models. In addition to those, decreases of the body weights
and periovarian fat pad weights, and increases of the serum IL-6 levels suggested that HepG2 tumor cell inoculations produced tumor-related immunosuppression and cachexia.
The in vivo anti-tumor growth activities of TP were evaluated by the changes of tumor volumes and weights between pre-treatment and post-treatment. Both tumor volumes and weights increased in all of the experimental mice, that is, in untreated mice, sorafenib treated mice and TP treated mice. However, statistically significant less increases of tumor weights and volumes were investigated in sorafenib treated mice and TP treated mice compared with treatment naive tumor bearing mice. Although sorafenib and TP could not achieve tumor stasis or tumor regression, tumor growth was significantly inhibited relative to the control group. In other sorafenib study, doses shown tumor regression or tumor stasis was about above at a dose of 30 ㎎/㎏ of sorafenib
34).
We showed TP could prevent cancer cachexia by increases of periovarian fat pad weights compared with tumor-bearing controls and sorafenib treated mice through the reduction of IL-6.
In the present study, remarkable increases of serum IL-6 levels, body weight decrease, and atrophic histologic changes of deposited periovarian fat pads were demonstrated after HepG2 cell implantation. Both sorafenib and TP showed anti-tumor effects, but sorafenib treated mice showed significant reduction of body weights and periovarian fat pad weights contrary to increase of those parameters in TP treated mice. However, TP treated mice did not lose weights despite of modest tumor growth similar with sorafenib. This suggests sorafenib had considerable toxicities and treatment of TP can control the cancer associated cachexia.
Nowadays, immunomodulatory agents and immunotherapy including immune checkpoint inhibitors or cancer vaccines are in the world limelight in the field of oncology
35). TNF-α has conflicting functions that can lead to cell death (apoptosis) or cell survival (anti-apoptosis), and even tumorigenesis
36). TNF-α has played an important function in tumor regression but also been related with cancer cachexia
37). In this study, TPe at each three doses showed immunostimulatory effects dose-dependently through increases of splenic TNF-α, IL-10 and IL-1β, serum IFN-γ and NK cell activities corresponding to increases of spleen weights, lymph node weights and non-atrophic changes of lymph nodes. On the other hand, sorafenib induced decreases of serum IFN-γ levels, NK cell activities
concomitant with loss of lymphatic organ weights, and splenic TNF-α, IL-10 and IL-1β contents as compared with tumor implanted controls, and led to histopathological atrophic changes of lymphatic organ although it showed inhibition of tumor growth.
The function of COX-2 was well known as modulation of cell proliferation and apoptosis commonly in solid tumors. Cyclooxygenase-2 has also contributed enhanced angiogenesis, which plays a role in tumor growth. Marked decreases of COX-2 were demonstrated in sorafenib and TPe treated mice in this experiment. This suggested that they inhibited HepG2 tumor cell related angiogenesis and tumor progression
38). In many tumors, iNOS expression is commonly high and overexpression of iNOS were demonstrated to be anti-cancer potential in vitro and in vivo studies. NO-mediated apoptotic mechanisms include caspase activation, chromatin condensation, and DNA fragmentation
39,40). In the present study, marked increases of iNOS immunoreactivities were observed in tumor masses at TPe 500, 250 and 125 ㎎/㎏, not in sorafenib. These iNOS increases in tumor mass are considered as secondary changes from immunostimulatory effects of TPe through NK cell activity.
Several polysaccharides from natural herbs stimulated macrophage proliferation, NO production and phagocytosis
41)