Manuscript received May 11, 2016, revised June 6, 2016, accepted June 14, 2016
Release of Ammonia Odor from AAFA (Ammonia Adsorbed Fly Ash) by Installation of NOx Reduction System
Jae-kwan Kim†, Seok-un Park, Hyun-dong Lee, Jun-wha Chi
KEPCO Research Institute, Korea Electric Power Corporation, 105 Munji-Ro, Yusung-Gu, Daejeon, 34056, Korea
† [email protected]
Abstract
This paper discussed the effect of ammonia concentration adsorbed on fly ash for the ammonia emission as AAFA (Ammonia Adsorbed Fly Ash) produced from coal fired plants due to operation of NOx reduction technologies was landfilled with distilled or sea water at closed and open systems, respectively. Ammonia bisulfate and sulfates adsorbed on fly ash is highly water soluble. The pH of ammonium bisulfate and sulfate solution had significant effect on ammonia odor emission. The effect of temperature on ammonia odor emission from mixture was less than pH, the rate of ammonia emission increased with increased temperature when the pH conditions were kept at constant. Since AAFA increases the pH of solution substantially, NH
3in the ash can release the ammonia order unless it is present at low concentration. NH
4+ion is unstable in fly ash and water mixtures of high pH at open system, which is changed to nitrite or nitrate and then released as ammonia gas. The proper conditions for < 20 ppm of ammonia concentration released from the AAFAs landfilled in ash pond were explored using an open system with sea water. It was therefore proposed that optimal operation to collect AAFA of less than 168 ppm ammonia at the electrostatic precipitator were controlled to ammonia slip with less than 5 ppm at SCR/SNCR installations, and, ammonia odor released from mixture of fly ash of 168 ppm ammonia with sea water under open system has about 20 ppm.
Keywords: Ammonia, Selective Catalytic Reduction (SCR), Selective Non-Catalytic Reduction (SNCR), fly ash, ammonia, landfill
I. INTRODUCTION
In Korea, the current production of fly ash from coal fired thermal power plants is about 7.2 million tons a last year and is expected to increase to more than 12.8 million tons, in 2020. At present only 82.1% of fly ash produced is being used for the production of cement clinker, and as an additive of mortar and concrete mixtures with remaining 17.9% being disposed as a waste [1]. Many Korea utilities with coal-fired boilers are being required to reduce emissions of NOx. As the utility industry gears up for the next major round for NOx reductions, it is widely anticipated a significant number of units will be equipped with either selective non-catalytic reduction (SNCR) or selective catalytic reduction (SCR) technologies. For coal-fired power plants, both techniques use ammonia in the conversion reaction of NOx to nitrogen and water.
4NO + 4NH
3+ O
2→ 4N
2+ 6H
2O (1) 2NO
2+ 4NH
3+ O
2→ 3N
2+ 6H
2O (2) In all cases, some non-reacted ammonia reaches the stack as part of the flue gas and much of the ammonia is adsorbed on fly ash in the form of ammonium salt formed by reaction occurring in NH
3- and SO
3- containing flue gas.
2NH
3+ SO
3+ H
2O → (NH
4)
2SO
4ammonium sulfate
(3)
NH
3+ SO
3+ H
2O → NH
4HSO
4ammonium bisulfate
(4)
2NH
3+ 2SO
3+ H
2O → (NH
4)
2S
2O
7ammonium pyrosulfate
(5)
The ammonium sulfate is dry, powdery material whereas ammonium bisulfate with being dominant is a sticky, partially liquid material, which can be adhered to surface and build up.
There is widespread concern that the presence of ammonia on the
fly ash will adversely affect the ash landfill and utilization
industries. Also, most of coal-fired thermal power plants in Korea
have been installed and operated the SCR or SNCR to meet the
stringent regulations for NOx emissions from 2003 [2]. As the
AAFAes were landfilled into ash pond, ammonia odor occur
around civil village near coal-fired plant, and then civil trouble
can cause. When a person is exposed to ammonia released from
industrial unit as AAFA was utilized, and landfilled, it generates
a number of problem as temporary blindness, pulmonary edema,
marked eye, skin, and respiratory irritation. Table 1 is ammonia
exposure limits regulated by NIOSH (National Institute of
Occupational Safety and Health), OSHA (Occupational Safety
and Health Administration) and ACGIH (American Conference
of Government Industrial Hygienists) [3]. It is necessary that
ammonia concentration released from ash pond was limited under
at least 25 to 35 ppm or less, and optimal disposal methods to
control ammonia odor concentration was derived. Therefore,
KEPCO Research Institute has investigated the physicochemical
properties of AAFA produced from coal-fired boiler due to
installation of NOx reduction technologies, and its landfilling
characteristics under diatilled or sea water.
II. EXPERIMENTAL METHOD
Materials used in this study were six AAFA samples collected from the Honam coal fired plant owned by the Korea East-West Electric Power Corporation in operating of SNCR based on urea agent. The physicochemical properties of ash samples were measured as follows. The chemical composition was analyzed using inductively coupled plasma emission spectroscopy (ICP, Arcos FHE12, SPECTRO ARCOS Corp.).
Particle morphology was analyzed by scanning electron microscopy-energy dispersive spectroscopy (SEM-EDS, 5200- 1AE, JEOL Ltd), and deposit crystals were analyzed by X-ray diffraction (XRD) using a Philips PW 1830 diffractometer with Cu-K radiation (1.5496 Å). The ammonia concentration was measured using an Orion 95-12 NH
3electrode. The quality of water soluble ammonia present on the ash then calculated.
Comparison of the NH
3concentration determined in this study with those provided by the power plant indicates that most of the ammonia present on the fly ash is readily water soluble, probably as ammonium salts. This results is not unexpected, as the presence of ammonium sulfate and bisulfate on SNCR fly ash has been inferred for our research [2].
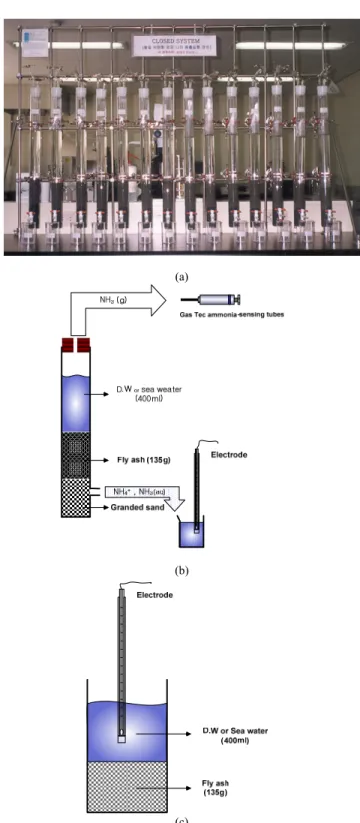
Ammonia release from AAFA in a closed system was studied using Pyrex columns that were 60 cm long and 4.25 cm in diameter as shown in Fig. 1(a) and (b). The column of fly ash and water was supported by a porous glass frit overlain by 50 g of washed, granded sand. Fly ash (135 g) was slurried with 300 ml of distilled water of pH 7.0, or sea water of pH 8.0 (Table 2) sampled at Yeosoo Odongdo sea in a polyrthylene bottle and the mixture poured into the Pyrex column, followed by washing the remaining fly ash from the bottle and column sides with 100ml of distilled water or sea water. This procedure yielded a total ash content of 25% by weight in accordance with E2060-06 standard guide for landfill of coal combustion products for solidification /stabilization of inorganic soil [4]. A two-hole rubber stopper was fitted tightly over the opening at the top of the column, and the holes sealed using small stoppers. 14 columns were prepared for each ashes such that periodic measurements could be made over the course of 12 weeks. At each specified interval, ammonia gas concentration in the sealed head-space was measured using Gas Tec ammonia-sensing tubes, followed by draining the water from
the bottom of the column into an Erlenmeyer flask. Aqueous un- ionized NH
3was measured in solution using the Orion ammonia electrode described in Fig. 1(b), while NH
4+ion was estimated using an Orion 93-18 ammonia-specified electrode and Water ion chromatograph in Fig. 2.
Due to interferences with other ions in solution the NH
4+concentrations reported herein only approximate the actual concentrations. In addition to testing in a open system, experiments were conducted to study ammonia release from fly ash/water mixture that were open to the atmosphere in shown as Fig. 1(c). In this series of tests, fly ash was slurried into a 1L polyethylene beaker. As with the previous tests, the fly ash was
Table 1. Ammonia exposure limits
Standard Concentration (ppm)
Least perceptible odor 5 Readily detectable odor 5-50
NIOSH/ACGIH-TWA(REL) 25 NIOSH/ACGIH-STEL(REL) 35
OSHA (PEL) 50
Immediately dangerous to life 300
Table 2. Composition of sea water
Component mg/kg (ppm)
Sodium 10,500 Magnesium 1,350
Calcium 400 Ammonium 7.6
Chloride 19,000 Sulfate 2,700 REL (Recommended Exposure Limit), PEL (Permissible Exposure Limit), TWA
(Time weighted average) : Exposure over an 8 hours workday or 40 hour workweek to which nearly all workers may be repeatedly exposed without adverse effects. STEL (Short term exposure limit) : The maximum concentration to which workers cab be exposed for a period no longer than 15 minutes.
(a)
(b)
(c)
Fig. 1. (a) Images, (b) diagrams for closed system, (c) diagram for open system.
comprised 25 percent by weight of the mixture. The temperature was controlled by settings the samples in a water bath. In order to compensate for evaporation the total mass of the beaker with fly ash and water was determined, compared with the starting mass, and the required amount of distilled water or sea water added.
Similar to the closed vessel experiments, un-ionized NH
3and NH
4+ion were measured using Orion ammonia and 93-18 ammonia-specified electrode, respectively; pH and temperature were also measured.
III. RESULT AND DISCUSSION
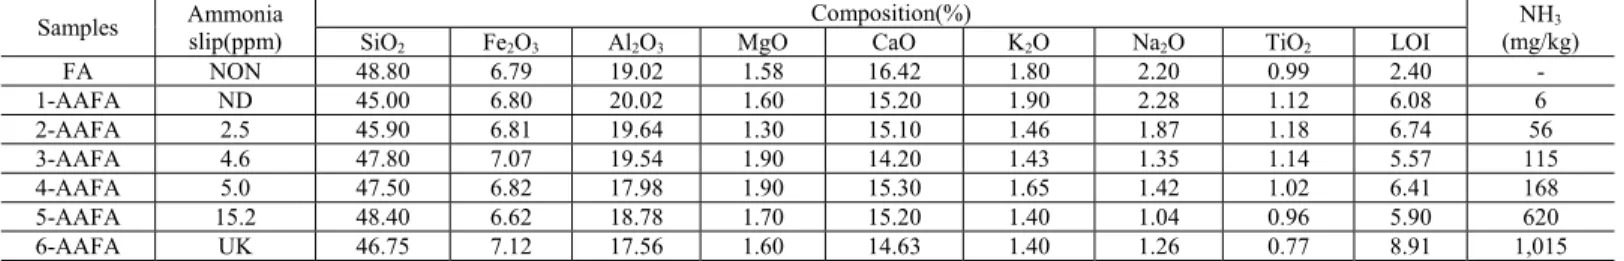
A. Characteristics of AAFA
Table 3 shows the chemical compositions of one fly ash (FA) collected from Boryung power plant without SCR/SNCR installations, and six AAFA (ammonia adsorbed fly ash)es. In case of chemical composition of fly ash, mass fractions of SiO
2+ Al
2O
3+ Fe
2O
3has over 70%, satisfying the specifications of fly ash in Korea. Sample symbols covered six series of fly ash with ammonia concentration of 0 (FA), 6 (1-AAFA), 56 (2-AAFA), 115 (3-AAFA), 168 ppm (4-AAFA), 620 ppm (5-AAFA), and 1,015 ppm (6-AAFA), respectively. 1-5 AAFAes were sampled at electrostatic precipitator of SNCR installation boiler of Honam power plant whereas 6 AAFA of 1,015 ppm ammonia was sampled at air preheator of the same plants.
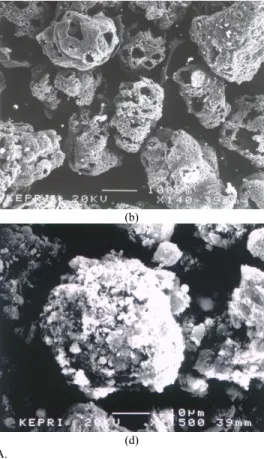
Fig. 3 is SEM images of fly ashes, unburned carbon collected from non-SCR/SNCR boiler,and 5 and 6-AAFA with ammonia concentrations of 620 and 1,015 ppm, respectively.
Most general fly ash particles without adsorbed ammonia show spherical shape whereas unburned carbon particles shows a porous structure with sponge shape. However, AAFA shows an no definite shape with agglomerated fine particles due to the presence of sticky ammonium bisulfate and sulfates.
These crystallines collected from non-SCR/SNCR boiler and 5-AAFA with ammonia concentrations of 620 ppm were confirmed by the XRD analysis results in Fig. 4. Most minerasls such as aluminosilicate at boiler were fast melted, agglomerated, and then crystallized to α-quartz (Q:SiO
2), mullite (M:2Al
2O
3․2SiO
2)
and magnetite (Ma:Fe
3O
4). In case of AAFA, much of the ammonia is adsorbed on fly ash in the form of ammonium salt formed by reaction occurring in NH
3unreacted at SCR/SNCR installation and SO
3containing flue gas. Main crystallines of ammonium slats adsorbed on fly ash were ammonium bisulfate (ABS:NH
4HSO
4) and ammonium sulfate (AS:(NH
4)
2SO
4).
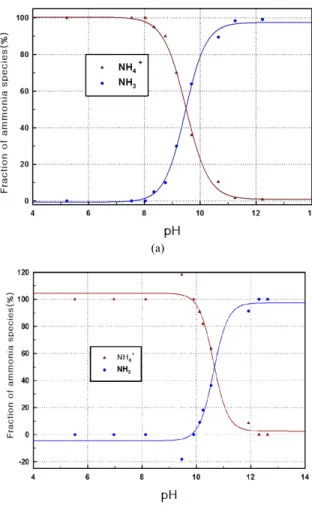
B. Distribution of Ammonia Species in Aqueous Solution as a Function of pH and Temperature
Ammonia in aqueous solution is primarily present in two forms : NH
4+ion and un-ionized NH
3. The distribution of these species is largely controlled by pH and temperature. Fig. 5 depicts the effect of pH at a single temperature (25 °C) as dissolved the ammonium bisulfate of 50 g in distillated water or sea water of 100 g (maximum solubility : 290 NH
4HSO
4/100g H
2O), and shows that increasing the pH cause the NH
3fraction to increase.
When ammonia is dissolved in water it reacts with hydrogen ion to form ammonium ion:
NH
3(g) + H
3O
+ NH
4+(aq) + H
2O(l) (6) The relative amount of ammonia and ammonium ion is determined by the solution pH. In acid solution, where hydrogen ion is readily available, virtually all the ammonia are converted to ammonium ion. At a pH of about 9.3, half the ammonia will be in the form of ammonium ion. Theoretically, it is possible to calculate the ratio of ammonia to ammonium ion, if the pH is known. The equilibrium constant for the reaction is :
[NH4+]
[H3O+][NH3]
=
10[NH-pH[[NH4+]3]
=K10
-9.3(7)
at 25 °C and pK= 9.3 [5]. The ratio of ammonium to ammonia is given by:
[NH4+]
[NH3]
= K10
-pH=10
9.3-pH(8)
As ammonium bisulfate identified as a major component crystalline of AAFA in Fig. 4(b) dissolved in distilled water, at a pH of about 9.6, half the ammonia became in the form of ammonium ion as shown in Fig. 5(a). Although ammonium bisulfate unlike ammonia gas dissolved in distilled water, theoretical pH values (9.3) with the same ammonia and ammonium ion concentration were very similar to experimental pH (9.6).
However, as ammonium bisulfate dissolved in sea water with containing various cation and anions as shown in Table 2, pH values of the same ammonia and ammonium ion concentration was about 10.7 (Fig. 5(b)), and higher than above distilled water due to presence of much interference ions and ammonium ion nitrificating from nitrogen in air. As NaOH was added to increase
Table 3. Chemical composition of fly ash and AAFAes (unit : wt.%) Samples Ammonia
slip(ppm)
Composition(%) NH3
(mg/kg) SiO2 Fe2O3 Al2O3 MgO CaO K2O Na2O TiO2 LOI
FA NON 48.80 6.79 19.02 1.58 16.42 1.80 2.20 0.99 2.40 -
1-AAFA ND 45.00 6.80 20.02 1.60 15.20 1.90 2.28 1.12 6.08 6 2-AAFA 2.5 45.90 6.81 19.64 1.30 15.10 1.46 1.87 1.18 6.74 56 3-AAFA 4.6 47.80 7.07 19.54 1.90 14.20 1.43 1.35 1.14 5.57 115 4-AAFA 5.0 47.50 6.82 17.98 1.90 15.30 1.65 1.42 1.02 6.41 168 5-AAFA 15.2 48.40 6.62 18.78 1.70 15.20 1.40 1.04 0.96 5.90 620 6-AAFA UK 46.75 7.12 17.56 1.60 14.63 1.40 1.26 0.77 8.91 1,015
NON : Non-installation of SCR/SNCR, ND : Not Detection, UK : Un-known
Fig. 2. Un-ionized ammonia and ammonium analysis system.
pH of sea water, the white salt was precipitated, and conversionof ammonium ion was started to ammonia at pH 9.7. Increasing water temperature also results in an increased proportion of NH
3[6].
NH
3(g) + nH
2O(l) NH
3n H
2O(aq) (9) Aqueous ammonia is a weak base, releasing hydroxide and ammonium ions into solution. Although ammonium hydroxide is conveniently expressed as NH
4OH, dissolved ammonia is
actually present in a hydrated form that is hydrogen bonded to water molecules. Increasing the partial pressure of ammonia gas results in an increase in ammonia solubility, as described by Henry’s Law.
= (NH
3(aq))/
( )(10)
where k
His Henry’s Law constant, NH
3(aq)is the concentration of ammonia dissolved in aqueous solution and P
NH3(g)is the partial
(a) (b)
(c) (d)
Fig. 3. SEM images of (a) general fly ash (FA), (b) unburned carbon, (c) 5-AAFA, and (d) 6-AAFA.
(a)
(b) Fig. 4. XRD result of (a) general ash, and (b) 5 AAFA.
pressure of ammonia gas. Ammonia solubility is affected by temperature, with an increase in temperature causing a decrease in the Henry’s Law constant.
= − 9.70 (11)
where T = temperature in Kelvin
Increasing the temperature of water can theretically increase the concentration of aqueous ammonia. Fig. 6 shows in greater detail the effect of temperature at different pH. Note that, although the proportion of un-ionized ammonia is affected by temperature at all pH levels, the most pronounced influence from a practical standpoint is at intermediate pH with the same ammonia and ammonium ion concentration. As AAFA was landfilled into ash pond, the rate of ammonia emission from leachelate water to atmosphere is primarily controlled by pH, temperature, and wind speed : increase in any of these variables causes an increase in the rate of ammonia emission. Suspended particles can also increase the emission rate. The solution pH has a dramatic effect on ammonia emission primarily because of its effect on the proportion of un-ionized NH
3in solution. As NH
3gas leaves a solution, restoration of equilibrium cause more NH
4+to NH
3, thus eventually depleting the total ammonia. At high pH, most of the ammonia is present as un-ionized NH
3, causing the total ammonia concentration to inecrease relative rapidly.
Conversely, at low pH , the proportion of NH
3is very small which cause the total ammonia to persist for a much longer time. At a low pH, temperature changes has very little effect on the ammonia
emission rate from water. However, at high pH of sea water increasing the temperature can cause a substantial increase in the rate of ammonia evolution as seen in Fig. 6(b).
C. Ammonia Emission from Fly Ash at Closed System
Fig. 7 provides an experimental results landfilled in distilled water at room temperature (approximately 24 °C) for fly ashes of ammonia concentration of 115 mg/kg (3-AAFA), and 1,015 mg/kg (6-AAFA), respectively. At the beginning of the experiment the pH values in case of 3-AAFA was approximately 11.6 and decreased to 9.5 over the course of the measurements.
Note that the proportion of un-ionized NH
3is much higher than NH
4+ion. This relationship was confirmed with other ash samples of ammoia concentration of 1,015 ppm tested. The relative abundance of un-ionized NH
3in solution was also manifested as a measurable quantity of NH
3gas in the head-space, which increased to a maximum of 17.5 ppm within two weeks. In contrast, fly ash of 1,015 ppm ammonia produced a higher ammonia emission in solution (62-138 ppm), and thus the ammonium salts was decomposed almost entirely as NH
3, resulting in a much emission of NH
3gas from the solution. Because of the fineness of this ash (which prevents water percolation through the ash column), the ammonia emission experiments were conducted in stoppered 500 ml polyethylene bottles, using 50 g of fly ash with 150 ml sea water. Fig. 7 presents the NH
4+concentration in spite of high pH of more than 8.7 remained constant over the course of the experiment. These data suggest the certain amount of NH
4+ion remained stable in solution although high pH conditions in
(a)
(b)
Fig. 5. Ammonia species in (a) distillated water, and (b) sea water as a function of pH at 25°C.
(a)
(b)
Fig. 6. The effect of temperature and pH on the fraction of NH3 in (a) distilled water, and (b) sea water.
case of landfillment of AAFA.
Fig. 8 shows experimental results landfilled in sea water at room temperature (approximately 24
oC) for fly ash of ammonia concentration of 115 mg/kg, and 620 mg/kg, respectively. pH values at starting point of one week were approximately 10.5 and 10.3, and decreased to 8.6 and 8.3, respectively, near the pH 8.0 of original sea water after 12 weeks. Fly ash of 115 ppm ammonia produced a higher un-ionized ammonia in solution(40-70 ppm), and was slightly decreased as NH
4+, resulting in a continuous emission of NH
3gas from the solution. In sea water, the NH
4+concentration was remained in range of 30-40 ppm over the course of the experiment in spite of high pH of more than 10.7.
In case of fly ash of 620 ppm ammonia, ammonia gas during between 2 and 5 weeks was high released with decreasing the un- ionized ammonia, and results in the decrease of the pH.
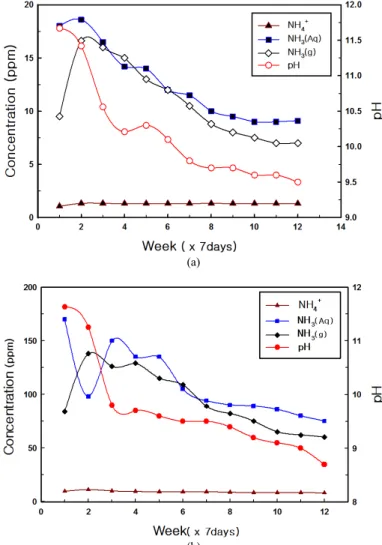
D. Ammonia Emission from Fly Ash at Open System
Fig. 9 show the ammonia emissions landfilled at open system for fly ash of ammonia concentration of 115 mg/kg (3- AAFA) that exhibited a range of different pH values in distilled water or sea water at closed system. Fly ash (3-AAFA) initially produced a pH of 11.7 and 9.8 at each distilled or sea water, which progressively decreased to 9.1 and 8.4, respectively, after 2,016 hours (12 weeks; 84 days). Un-ionized NH
3in distilled water is the dominant species in solution initially, although the fraction of
NH
3and NH
4+became equal when the pH decreased to 9.0-9.7.
After this, NH
4+became the minimal species, also the total ammonia concentration continued to decrease as the NH
3out- gassed from the solution. Un-ionized ammonia similar behaved in sea water, but exhibited an initially lower pH of 9.8. Note that the fraction of NH
4+ion after 2 weeks is higher than for un- ionized ammonia. This is expected based on the comparatively pH similar to original sea water (pH 8.0). Early in the experiment the un-ionized ammonia and NH
4+ion in sea water fluctuated significantly, probably caused by ions being expelled into the overlaying water column from the fly ash, as well as suspended solids that eventually settled. As noted for fly ash of ammonia concentration of 115 mg/kg, the two ammonia species progressively decreased at a similar rate as the NH
3gas left the solution.
Ammonia concentration (11.2-1.8 ppm) released from 3-AAFA in distilled water at open system was very low than closed system (17.0-8.0) because ammonia gases continuously generating from fly ash was gone into outside air, and not concentrated in open space. As fly ash of ammonia concentration with 168 ppm (4- AAFA) was landfilled in sea water under open system as shown in Fig. 10(a), ammonia emission was slightly increased to 20 ppm than it of ammonia concentration of 115 ppm. It is low level than the legal standard of ammonia exposure limit of below 25 ppm.
Like the above 3-AAFA sample, the un-ionized NH
3species was slightly high than the NH
4+ions at early one week, and then significantly decreased after 2 weeks.
(a)
(b)
Fig. 7. Ammonia release from (a) 3-AAFA, and (b) 6-AAFA in distilled water under closed system.
(a)
(b)
Fig. 8. Ammonia release from (a) 3-AAFA, and (b) 5-AAFA in sea water under closed system.
Usually, NH
4+in aquoues in contact with air was oxidized to nitrite in two steps [7]. The first step is catalyzed by the enzyme, monooxygenase which forms the hydroxylamine by using O
2as oxidant. In the second step, hydroxylamine is oxidized to nitrite by the enzyme hydroxylamine-dehydrogenase.
The oxidation of nitrite to nitrate, which occurs through the activity of the nitrite oxidase enzyme, completes the process of nitrification.
2NH
4++ O
2→ 2NH
2OH + 2H
+(12) 2NH
2OH + 2O
2→ 2H
++ 2H
2O + 2NO
22-(13) 2NO
22-+ O
2→ 2NO
32-(14) The conventional view of nitrification occurs in the presence of oxygen and anticipates the oxidation of ammonium to nitrate based on the following global synthetic formula.
2NH
4++ 4O
2→ 4H
++ 2H
2O + 2NO
32-(15) That is, conversion of ammonium ions dissolved from 4- AAFA to nitrate(NO
32-) and nitrite(NO
22-) is likely to occur in the natural environment due to the presence of nitrifying bacteria, particularly where pH is between 9.5 and 7.5. However, as fly ash of high ammonia concentration with more than 620 ppm(5-AAFA)
was landfilled in sea water as shown in Fig. 10(b), ammonia emission was significantly increased to 45 ppm at one week. It is much higher than the legal standard of ammonia exposure limit of less than 25 ppm. Unlike the above 3- and 4-AAFA samples, the un-ionized NH
3species was clearly more abundant than the NH
4+ions during the 12 weeks, and slightly decreased to 35 ppm over the experiment. NH
4+ions shows a constant concentration around 9.0 ppm during the 12 weeks. This indicated that, even under open system, un-ionized ammonia was affected to decrease of pH, and most of the NH
4+ion remained in solution and is not transformed(i.e. to nitrate/nirite) or out-gased as ammonia gas.
The appropriate conditions to control ammonia odor of less than 25 ppm as AAFA landfilled into ash pond was obtained at open system when AAFA with ammonia concentration of less than 168 ppm landfilled with sea water.
As fly ash of high ammonia concentration with 1,015 ppm (6-AAFA) was landfilled in sea water at open system as shown in Fig. 11, ammonia gas emission was significantly increased to 84 ppm at one week. It is much higher than the legal recommended standard of ammonia exposure limit of less than 25 ppm. Like the above 5-AAFA sample, the un-ionized NH
3species was clearly more abundant than the NH
4+ions during the 12 weeks, and significantly decreased from 170 ppm to 80 ppm over the experiment. NH
4+ions shows a constant concentration around 9.5 ppm during the 12 weeks. This also indicated that, even under open system, most of the NH
4+ion remained in solution and is
(a)
(b)
Fig.10. Ammonia release from (a) 4-AAFA, and (b) 5-AAFA in sea water under open system.
(a)
(b)
Fig.9. Ammonia release from 3-AAFA in (a) distilled water, and (b) sea water under open system.
not transformed(i.e. to nitrate/nirite) or out-gased as ammonia gas.
Un-ionized ammonia is highly toxic to aquatic organisms whereas ammonium ion was much less so, comparatively stable.
Therefore, as AAFA is landfilled into ash pond, concentration of un-ionized ammonia must be keep to less than 10 ppm due to contaminate both ground and surface waters, in case of landfilling of AAFA with less than 168 ppm ammonia in sea water at open system, ammonia odor was generated from 20 ppm to 0 ppm, and
un-ioninized ammonia was keep to less than 10 ppm from after 2 weeks.
In previous studies [8] for utilization of AAFA replaced by cement as an additives of concrete mixture, it has been noted that the ammonia odor was detected during the mixing the mortar containing AAFA. Tests to measure ammonia concentration released from concrete blended with AAFA were performed at the ages of 1 day, 3 days, 7 days and 28 days as shown in Fig. 12. At age of 1 day, ammonia concentration released from concrete is increased with increased ammonia concentration in AAFA for cement whereas at age of 3 and 7 days, concrete (5AAFA-C15) containing with AAFA of 620 ppm NH
3has the lowest ammonia releasing concentration. After age of 28 days, ammonia concentration released from concrete for all cases has low values with less than 4.7 ppm. But, most people working in the concrete field will feel ammonia odor because ammonia concentration at age of 1day was about more than 5 ppm for all cases.
Although AAFA was landfilled with sea water at open system in optimal conditions for releasing a lowest ammonia odor, the ammonia concentration adsorbed on fly ash must be regulated to less than 168 ppm. Ammonia slip results in a significant portion of ammonia being adsorbed on fly ash. Ammonia concentration adsorbed on fly ash collected at electrostatic precipitator was concentrated to more than 32.19 times or less of ammonia slip in flue gas of SNCR outlet as shown in Fig. 12 [2].
= 32.19( ) − 24.33 ( = 0.71) (16) where, C
Ais the predicted ammonia concentration adsorbed on fly ash of ESP, S
Ais ammonia slip content in flue gas phase of SNCR installation outlet at blending coal fired boiler of bituminous and subbituminous coals. Fundamentally, ammonia slip of SCR/SNCR should be controlled to less than 5 ppm in order to manage ammonia concentration of less than 150 ppm in fly ash as shown in Fig. 13.
IV. CONCLUSION
A ash handling problem associated with the post-combustion NOx reduction technologies is presence of ammonia from such agents as ammonia or urea to reduce NOx to N
2. Unreacted ammonia, usually called “ammonia slip,” being adsorbed as ammonium bisulfate and sulfate on the fly ash collected in the electrostatic precipitator. Ammonia bisulfate and sulfate adsorbed fly ash represents a disposal problems of both landfilling into ash pond and recycling as additives of concrete mixture. Most of the ammonia adsorbed on fly ash is highly water soluble, and is completely dissolved into solution. As fly ash of high ammonia concentration of 1,015 ppm landfilled with sea water under open system, ammonia odor was increased to 84 ppm for one week.
Conversion of ammonium ions dissolved from fly ash containing ammonia of less than 168 ppm with sea water to nitrate (NO
32-) and nitrite (NO
22-) is likely to occur in the natural environment due to the presence of nitrifying bacteria, particularly where pH is between 9.5 and 7.5. However, as fly ash of high ammonia with more than 620 ppm (5-AAFA) was landfilled in sea water at open system, ammonia emission was significantly increased to 45 ppm at one week. It is much higher than the legal recommended standard of ammonia exposure limit of less than 25 ppm. Although AAFA was landfilled at sea water
Fig.11. Ammonia release from 6-AAFA of high ammonia concentration in sea water under open system.
Figure 12. Ammonia concentration released from concrete mixtures blended with AAFA during the curing [8].
Figure 13. Ammonia concentration adsorbed on fly ash collected at ESP vs. gas phase ammonia slip level of SNCR boiler [2].
![Figure 12. Ammonia concentration released from concrete mixtures blended with AAFA during the curing [8]](https://thumb-ap.123doks.com/thumbv2/123dokinfo/4900957.291541/8.936.63.454.88.335/figure-ammonia-concentration-released-concrete-mixtures-blended-curing.webp)
