
Distribution and accumulation of Cy5.5-labeled thermally cross-linked superparamagnetic iron oxide nanoparticles in the tissues of ICR mice
7
0
0
전체 글
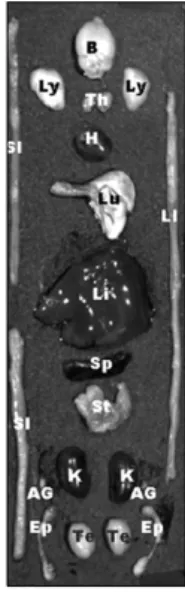
(2) 474 Jin Joo Hue et al.. directed to an organ, tissue, or tumor using an external magnetic field [6]. Cyanine (Cy) is a synthetic dye belonging to the polymethine group and has been recently used in biotechnology (for labeling and analysis) [32]. Cyanines have many uses as fluorescent dyes, particularly for biomedical imaging, that increase the range of wavelengths which form images on film [5]. Cyanine labeling is done for visualization and quantification purposes [9]. Cy5.5 N-hydroxysuccinimide (NHS) ester is a reactive dye used for labeling amino groups in peptides, proteins, and oligonucleotides [20]. Cy5.5 emits a far-red (and near-infrared) signal that is ideal for fluorescence measurements for which background fluorescence is a concern [28]. The present study was conducted to evaluate the distribution and accumulation of free Cy5.5 dye and Cy5.5-labeled TCL-SPION in tissues of mice. The optical imaging method performed with an in vivo imaging system (IVIS) has been routinely used for assessing the tissue distribution of polymer-coated nanoparicles.. Materials and Methods Drugs Cy5.5 mono NHS ester was purchased from Amersham Biosciences (UK), and Cy5.5-labeled TCL-SPION was obtained from the Gwangju Institute of Science and Technology (Korea). Cy5.5-labeled TCL-SPION consisted of three components: an iron oxide core, a hydrophilic coating, and optical imaging detection Cy5.5 dye. Mean size of the hydrodynamic particles was about 35 nm and the zeta potential intensity was −25.13 mV. Animals and treatments All animal experiments were performed in accordance with standard procedures for laboratory animals approved by the Institutional Animal Care and Use Committee of Chungbuk National University (Korea). A total of 120 male, 5-week old ICR mice (body weight, 21.3 ± 1.7 g) were purchased from Koatec Inc. (Korea). Upon arrival, the mice were housed in a temperature- and humiditycontrolled environment with a reversed 12/12 h light/dark cycle, and had free access to food and water. After 1 week of acclimation, the mice were randomly divided into a normal group (n = 5), a Cy5.5-treated group (n = 60), and a Cy5.5-labeled TCL-SPION-treated group (n = 60). Fifty μL of saline, a Cy5.5 suspension (0.1 mg/kg body weight), or a Cy5.5-labeled TCL-SPION suspension (15 mg of Fe/kg body weight) were injected into the tail vein of the mice according to a modified method by Lee et al. [22]. Kinetic evaluate of free Cy5.5 and Cy5.5-labeled TCL-SPION For the kinetic study of free Cy5.5, the mice were. sacrificed by cervical dislocation at 0.5, 1, and 4 h as well as 1, 4, 7, 14, and 28 days following injection of the compound. For the kinetic study of Cy5.5-labeled TCL-SPION, the animals were also sacrificed at 0.5, 1, 2, 4, 8 h as well as 1, 2, 4, 7, 14, 21, and 28 days following exposure. During necropsy, the major organs (brain, lymph node, thymus, heart, lung, liver, spleen, kidney, epididymis, and testis) of each animal were collected for relative quantitation of fluorescence signals.. Monitoring the in vivo characteristics of free Cy5.5 and Cy5.5-labeled TCL-SPION Twenty-eight days after treatment, optical imaging was performed using an IVIS 200 imaging system (Xenogen, USA). Near-infrared fluorescence (NIR) images of various organs (brain, lymph node, thymus, heart, lung, liver, spleen, kidney, epididymis, and testis) were obtained with a Cy5.5 filter channel. Organ distribution of the nanoparticles was quantified by measuring the ratio of NIR intensity of Cy5.5-labeled TCL-SPION and free Cy5.5 and comparing the data to that of the normal group. All results were measured using the region of interest (ROI) function of analysis workstation software (Living Image, Caliper Life Sciences, USA). Statistical analysis Data were analyzed with a one-way analysis of variance (ANOVA) followed by a two-tailed Student’s t test when the ANOVA indicated statistically significant differences (p < 0.05). All statistical analyses were performed using. Fig. 1. The location of various organs used for kinetic studies of free Cy5.5 and Cy5.5-labeled thermally cross-linked superparamagnetic iron oxide nanoparticles (TCL-SPION). B: brain, Ly: lymph node, Th: thymus, H: heart, Lu: lung, LI: large intestine, Li: liver, SI: small intestine, Sp: spleen, St: stomach, K: kidney, AG: adrenal gland, Te: testis, Ep: epididymis..
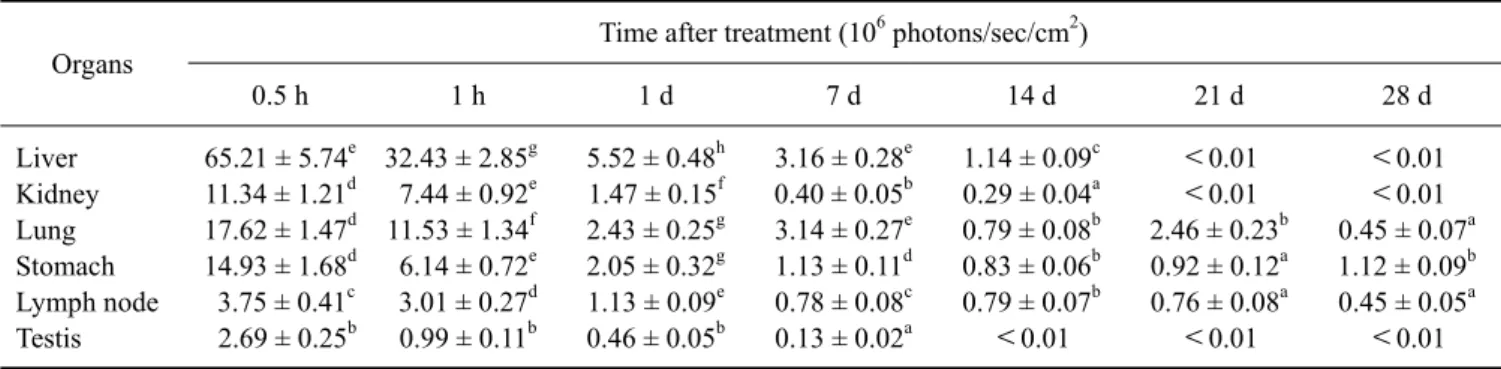
(3) Distribution and accumulation of Cy5.5-labeled TCL-SPION 475. Stat View J-5.0 software (SAS Institute, USA). The results are expressed as the mean ± standard deviation (SD).. Results Ex vivo kinetic study of free Cy5.5 Fig. 1 shows the location of free Cy5.5 in various murine organs. Fig. 2 presents the florescence images of free Cy5.5 dye in different organs of the mice observed 24 days post-injection. Cy5.5 dye in the different organs was rapidly eliminated from 0.5 to 24 h post-injection. However, a low level of Cy5.5 dye was constantly maintained for 28 days in certain organs such as the stomach, thymus, lymph node, brain, and epididymis. In. particular, fluorescence intensity of the Cy5.5 dye was fairly strong in the liver, lung, kidney, and stomach within 1 day post-treatment (Fig. 2). Other organs including the brain, spleen, heart, lymph node, thymus, adrenal gland, epididymis, and testis contained a low level of fluorescence intensity throughout the experiment. Table 1 shows the relative intensities in different organs 28 days after the injection of Cy5.5 (0.1 mg/kg). At 0.5 h post-injection, the relative fluorescence intensity in liver was the highest compared to the other organs (p < 0.05). However, the relative fluorescence intensity in liver rapidly decreased 1 day post-injection. Until 7 days post-injection, the relative fluorescence intensity in liver, lung, and stomach was significantly high compared to the. Fig. 2. Florescence images showing the biodistribution and accumulation of fluorescence in various organs for 28 days after the injection of 0.1 mg/kg Cy5.5. Yellow indicates a higher intensity at 615∼707 nm. Images were acquired with an exposure time of 1 sec using the Cy5.5 filter channel. Left: organs of a normal mouse; Middle and right: organs of mice injected with Cy5.5. Table 1. Relative fluorescence intensity measured during a 28-day period in various organs of mice injected with Cy5.5 Organs Liver Kidney Lung Stomach Lymph node Testis. Time after treatment (106 photons/sec/cm2) 0.5 h. 1h. 65.21 ± 5.74e 32.43 ± 2.85g 11.34 ± 1.21d 7.44 ± 0.92e d 17.62 ± 1.47 11.53 ± 1.34f 14.93 ± 1.68d 6.14 ± 0.72e c 3.75 ± 0.41 3.01 ± 0.27d b 2.69 ± 0.25 0.99 ± 0.11b. 1d. 7d. 14 d. 21 d. 28 d. 5.52 ± 0.48h 1.47 ± 0.15f 2.43 ± 0.25g 2.05 ± 0.32g 1.13 ± 0.09e 0.46 ± 0.05b. 3.16 ± 0.28e 0.40 ± 0.05b 3.14 ± 0.27e 1.13 ± 0.11d 0.78 ± 0.08c 0.13 ± 0.02a. 1.14 ± 0.09c 0.29 ± 0.04a 0.79 ± 0.08b 0.83 ± 0.06b 0.79 ± 0.07b <0.01. <0.01 <0.01 2.46 ± 0.23b 0.92 ± 0.12a 0.76 ± 0.08a <0.01. <0.01 <0.01 0.45 ± 0.07a 1.12 ± 0.09b 0.45 ± 0.05a <0.01. Data are expressed as the mean ± SD. Images were acquired with an exposure time of 1 sec using the Cy5.5 filter channel (615∼707 nm). The value means ROI densities in various organs of each mouse. a-gMean values with different letters in the same column are significantly different (p < 0.05)..
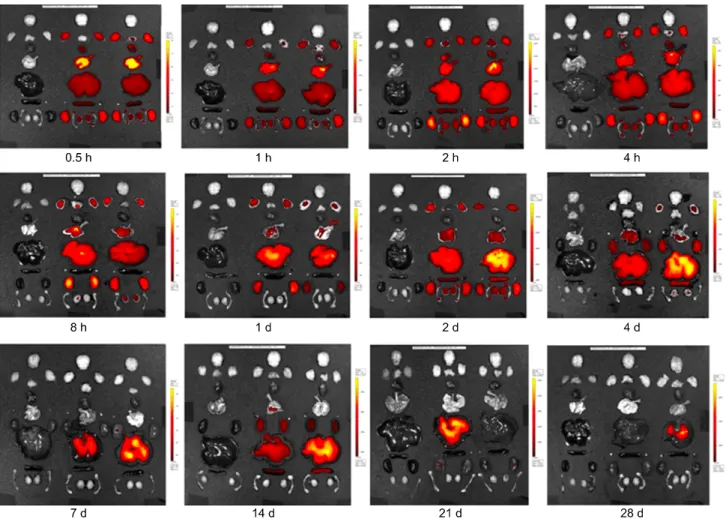
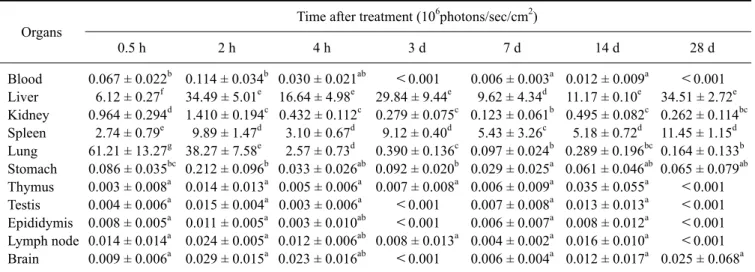
(4) 476 Jin Joo Hue et al.. other organs (p < 0.05). At 28 day post-injection, the relative fluorescence intensity in stomach was the highest compared to the other organs (p < 0.05). Other organs including blood, spleen, thymus, epidiymis, and brain contained a low level of fluorescence throughout the experimental period (data did not show).. Ex vivo kinetic study of Cy5.5-labeled TCL-SPION Fig. 3 shows the florescence images of Cy5.5-labeled TCL-SPION in different organs of the mice 24 days post-injection. Similar to the pattern of free Cy5.5, Cy5.5-labeled TCL-SPION in the various organs was rapidly eliminated from 0.5 to 24 h post-injection. Optical imaging density in the liver rapidly decreased until 28 days post-injection. In addition, optical imaging density in the lung gradually decreased over time. Optical imaging density in the kidney and lymph node was constantly maintained for 28 days. In the liver, the fluorescence intensity of Cy5.5-labeled TCL-SPION was the strongest. and persisted at high levels throughout the whole experimental period. Other organs including the brain, heart, thymus, adrenal gland, epididymis, and testis had a slightly lower fluorescence intensity during the experimental period. Table 2 shows relative intensities observed in different organs 28 days after injection of 15 mg/kg Cy5.5-labeled TCL-SPION. The relative fluorescence intensity in most organs peaked at 2 h while the peak time of the relative fluorescence intensity in the lung (0.5 h), thymus (14 days), liver (28 days) and spleen (28 days) diverged from this average. Until 3 days after injection, relative fluorescence intensity in the liver, spleen, kidney, and lung was significantly higher than that in the other organs (p < 0.05). However, relative fluorescence intensity in the lung and kidney rapidly decreased 4 h post-injection. During the 28-day post-injection period, relative fluorescence intensity in the liver and spleen was significantly higher than that observed in other organs except for lung until 1. Fig. 3. Florescence images showing the biodistribution and accumulation of fluorescence in various organs over a 28-day period after the injection of 15 mg/kg Cy5.5-labeled TCL-SPION. Yellow indicates higher intensity at 615∼707 nm. Images were acquired with an exposure time of 1 sec using the Cy5.5 filter channel. Left: organs of a normal mouse; Middle and right: organs of mice injected with Cy5.5-labeled TCL-SPION..
(5) Distribution and accumulation of Cy5.5-labeled TCL-SPION 477. Table 2. Relative fluorescence intensity measured during a 28-day period in various organs of mice injected with Cy5.5-labeled TCL-SPION 6. Organs Blood Liver Kidney Spleen Lung Stomach Thymus Testis Epididymis Lymph node Brain. 2. Time after treatment (10 photons/sec/cm ) 0.5 h. 2h. 4h. 3d. 7d. 0.067 ± 0.022b 6.12 ± 0.27f 0.964 ± 0.294d 2.74 ± 0.79e 61.21 ± 13.27g 0.086 ± 0.035bc 0.003 ± 0.008a 0.004 ± 0.006a 0.008 ± 0.005a 0.014 ± 0.014a 0.009 ± 0.006a. 0.114 ± 0.034b 34.49 ± 5.01e 1.410 ± 0.194c 9.89 ± 1.47d 38.27 ± 7.58e 0.212 ± 0.096b 0.014 ± 0.013a 0.015 ± 0.004a 0.011 ± 0.005a 0.024 ± 0.005a 0.029 ± 0.015a. 0.030 ± 0.021ab 16.64 ± 4.98e 0.432 ± 0.112c 3.10 ± 0.67d 2.57 ± 0.73d 0.033 ± 0.026ab 0.005 ± 0.006a 0.003 ± 0.006a 0.003 ± 0.010ab 0.012 ± 0.006ab 0.023 ± 0.016ab. <0.001 29.84 ± 9.44e 0.279 ± 0.075c 9.12 ± 0.40d 0.390 ± 0.136c 0.092 ± 0.020b 0.007 ± 0.008a <0.001 <0.001 0.008 ± 0.013a <0.001. 0.006 ± 0.003 9.62 ± 4.34d 0.123 ± 0.061b 5.43 ± 3.26c 0.097 ± 0.024b 0.029 ± 0.025a 0.006 ± 0.009a 0.007 ± 0.008a 0.006 ± 0.007a 0.004 ± 0.002a 0.006 ± 0.004a. a. 14 d. 28 d. 0.012 ± 0.009a 11.17 ± 0.10e 0.495 ± 0.082c 5.18 ± 0.72d 0.289 ± 0.196bc 0.061 ± 0.046ab 0.035 ± 0.055a 0.013 ± 0.013a 0.008 ± 0.012a 0.016 ± 0.010a 0.012 ± 0.017a. <0.001 34.51 ± 2.72e 0.262 ± 0.114bc 11.45 ± 1.15d 0.164 ± 0.133b 0.065 ± 0.079ab <0.001 <0.001 <0.001 <0.001 0.025 ± 0.068a. Data are expressed as the mean ± SD. Images were acquired with an exposure time of 1 sec using the Cy5.5 filter channel (615∼707 nm). The value means ROI densities of various organs in each mouse. a-gMean values with different letters in the same column are significantly different (p < 0.05).. day after injection (p < 0.05). In particular, relative fluorescence intensity in the liver and spleen gradually decreased at 7 and 14 days post-injection, respectively, while that in liver and spleen increased at 14 and 28-day post-treatment, respectively. At 28-day post-injection, the relative fluorescence intensity was the highest compared to the other organs (p < 0.05).. Discussion Recently, the potential of magnetic nanoparticles as drug delivery vehicles has been extensively investigated [1,2,15,18,25,33,36]. Magnetic nanoparticles have been used as contrast agents and in thermal therapy for treating cancer and to target sites using an external magnetic field. Paramagnetic or modified dextran-coated SPION have been used to label cells ex vivo, providing researchers with the ability to monitor cell migration with MRI [4,17,24]. The purpose of the present research was to monitor the distribution and accumulation of Cy5.5-labeled nanoparticles, and measure the in vivo kinetics of free Cy5.5 and Cy5.5-labeled TCL-SPION. Cy5.5-labeled TCL-SPION are stable under biological conditions. The Cy5.5 dye is slowly released from Cy5.5-labeled TCL-SPION and the percentage of released Cy5.5 dye is less than 10% [7]. This indicates that the nanoparticles resist dissolution, resulting from the covalent conjugation of Cy5.5 to the TCL-SPION [21-23,35]. In the present investigation, Cy5.5 dye injected into mice was distributed in various organs and rapidly eliminated from 0.5 to 24 h post-injection. Low fluorescence intensities of free Cy5.5 remained in different organs until 28 days. In contrast,. Cy5.5-labeled TCL-SPION were distributed in various organs and slowly eliminated from 0.5 h to 28-day post-injection. Thus, the intensities of signals generated by Cy5.5-labeled TCL-SPION were higher than those of free Cy5.5 for 28 days. These results indicated that the intravenously injected Cy5.5-labeled TCL-SPION entered into the systemic circulation and were stored for certain periods of time in the different organs, especially liver. When nanoparticles are intravenously or intraperitoneally injected, inorganic and organic nanoparticles are mainly sequestered in the liver and spleen [27]. Quantum dots accumulate in the liver, spleen, and kidneys after intravenous injection in mice [8,35]. Gold nanoparticles accumulate in the liver and spleen after intravenous injection in mice [7]. When poly lactide glycolide (PLGA) nanospheres are placed in rat lung, they rapidly enter the systemic circulation and are distributed to the liver, kidney, brain, spleen, and pancreas [13]. In addition, fluorescent magnetic nanoparticles are distributed to various organs including the liver, spleen, testis, and brain of rats after 4 weeks of inhalation [19]. Depending on the routes of exposure, the toxicity and kinetic properties of nanoparticles can be completely different. When intravenously injected, nanoparticles directly enter the systemic circulation while intraperitoneally injected nanoparticles enter the liver via the first-pass effect and then are then redistributed from the liver to other organs [19]. The kinetic study conduced in the present investigation indicated that intravenously injected Cy5.5-labeled TCL-SPION directly entered the systemic circulation and were eliminated. However, particle elimination was slower in the liver compared to other.
(6) 478 Jin Joo Hue et al.. organs. In another study, it was suggested that Kupffer cells in the liver can degrade iron oxide nanoparticles and convert most of the iron into ferritin [3]. The TCL-SPION could be stored in the form of ferritin after degradation of the nanoparticles. In addition, the size of iron oxide nanoparticles plays a major role in target cell uptake and elimination from the body. Spleen and liver capture nanoparticles of more than 150 nm in diameter whereas particles having sizes below 10 nm are selectively filtered by the renal system and eliminated from body [30]. In the current study, the relative fluorescence intensity of Cy5.5-labeled TCL-SPION in the liver and spleen 28-day post-injection may have been higher than that of the other organs. We conclude that Cy5.5-labeled TCL-SPION can be useful as a carrier of therapeutic reagents to treat diseases, thereby persisting for long periods of time and maintaining the fluorescence density in certain tissues after intravenous injection.. Acknowledgments This work was supported by the Priority Research Centers Program through the National Research Foundation of Korea (NRF) funded by the Ministry of Education, Science and Technology (2011-0031403) and by a grant (08162-nanotoxicity-554) from the Korea Food and Drug Administration.. References 1. Alexiou C, Arnold W, Klein RJ, Parak FG, Hulin P, Bergemann C, Erhardt W, Wagenpfeil S, Lübbe AS. Locoregional cancer treatment with magnetic drug targeting. Cancer Res 2000, 60, 6641-6648. 2. Alexiou C, Schmid RJ, Jurgons R, Kremer M, Wanner G, Bergemann C, Huenges E, Nawroth T, Arnold W, Parak FG. Targeting cancer cells: magnetic nanoparticles as drug carriers. Eur Biophys J 2006, 35, 446-450. 3. Briley-Saebo KC, Johansson LO, Hustvedt SO, Haldorsen AG, Bjørnerud A, Fayad ZA, Ahlstrom HK. Clearance of iron oxide particles in rat liver: effect of hydrated particle size and coating material on liver metabolism. Invest Radiol 2006, 41, 560-571. 4. Bulte JWM, Zhang SC, van Gelderen P, Herynek V, Jordan EK, Duncan ID, Frank JA. Neurotransplantation of magnetically labeled oligodendrocyte progenitors: magnetic resonance tracking of cell migration and myelination. Proc Natl Acad Sci U S A 1999, 96, 15256-15261. 5. Chapman G, Henary M, Patonay G. The effect of varying short-chain alkyl substitution on the molar absorptivity and quantum yield of cyanine dyes. Anal Chem Insights 2011, 6, 29-36. 6. Chastellain M, Petri A, Gupta A, Rao KV, Hofmann H. Super paramagnetic silica-iron oxide nanocomposites for application in hyperthermia. Adv Eng Mater 2004, 6,. 235-241. 7. Cho WS, Cho M, Jeong J, Choi M, Cho HY, Han BS, Kim SH, Kim HO, Lim YT, Chung BH, Jeong J. Acute toxicity and pharmacokinetics of 13 nm-sized PEG-coated gold nanoparticles. Toxicol Appl Pharmacol 2009, 236, 16-24. 8. Choi HS, Liu W, Misra P, Tanaka E, Zimmer JP, Ipe BI, Bawendi MG, Frangioni JV. Renal clearance of quantum dots. Nat Biotechnol 2007, 25, 1165-1170. 9. Cunningham BT. Photonic crystal surfaces as a general purpose platform for label-free and fluorescent assays. JALA Charlottesv Va 2010, 15, 120-135. 10. Ferrari M. Cancer nanotechnology: opportunities and challenges. Nat Rev Cancer 2005, 5, 161-171. 11. Gupta AK, Curtis ASG. Surface modified superparamagnetic nanoparticles for drug delivery: interaction studies with human fibroblasts in culture. J Mater Sci Mater Med 2004, 15, 493-496. 12. Gupta AK, Gupta M. Synthesis and surface engineering of iron oxide nanoparticles for biomedical applications. Biomaterials 2005, 26, 3995-4021. 13. Hara K, Tsujimoto H, Tsukada Y, Huang CC, Kawashima Y, Tsutsumi M. Histological examination of PLGA nanospheres for intratracheal drug administration. Int J Pharm 2008, 356, 267-273. 14. Horák D, Rittich B, Španová A, Beneš MJ. Magnetic microparticulate carriers with immobilized selective ligands in DNA diagnostics. Polymer 2005, 46, 1245-1255. 15. Jain KK. Role of nanobiotechnology in developing personalized medicine for cancer. Technol Cancer Res Treat 2005, 4, 645-650. 16. Jordan A, Scholz R, Maier-Hauff K, Johannsen M, Wust P, Nadobny J, Schirra H, Schmidt H, Deger S, Loening S, Lanksch W, Felix R. Presentation of a new magnetic field therapy system for the the treatment of human solid tumors with magnetic fluid hyperthermia. J Magn Magn Mater 2001, 225, 118-126. 17. Josephson L, Tung CH, Moore A, Weissleder R. High-efficiency intracellular magnetic labeling with novel superparamagnetic-tat peptide conjugates. Bioconjug Chem 1999, 10, 186-191. 18. Kohler N, Sun C, Fichtenholtz A, Gunn J, Fang C, Zhang M. Methotrexate-immobilized poly(ethylene glycol) magnetic nanoparticles for MR imaging and drug delivery. Small 2006, 2, 785-792. 19. Kwon JT, Hwang SK, Jin H, Kim DS, Minai-Tehrani A, Yoon HJ, Choi M, Yoon TJ, Han DY, Kang YW, Yoon BI, Lee JK, Cho MH. Body distribution of inhaled fluorescent magnetic nanoparticles in the mice. J Occup Health 2008, 50, 1-6. 20. Lee CM, Jeong HJ, Yun KN, Kim DW, Sohn MH, Lee JK, Jeong J, Lim ST. Optical imaging to trace near infrared fluorescent zinc oxide nanoparticles following oral exposure. Int J Nanomedicine 2012, 7, 3203-3209. 21. Lee H, Lee E, Kim DK, Jang NK, Jeong YY, Jon S. Antibiofouling polymer-coated superparamagnetic iron oxide nanoparticles as potential magnetic resonance contrast agents for in vivo cancer imaging. J Am Chem Soc 2006, 128, 7383-7389. 22. Lee H, Yu MK, Park S, Moon S, Min JJ, Jeong YY, Kang.
(7) Distribution and accumulation of Cy5.5-labeled TCL-SPION 479. 23.. 24.. 25.. 26.. 27.. 28.. HW, Jon S. Thermally cross-linked superparamagnetic iron oxide nanoparticles: synthesis and application as a dual imaging probe for cancer in vivo. J Am Chem Soc 2007, 129, 12739-12745. Lee JH, Huh YM, Jun Y, Seo J, Jang J, Song HT, Kim S, Cho EJ, Yoon HG, Suh JS, Cheon J. Artificially engineered magnetic nanoparticles for ultra-sensitive molecular imaging. Nat Med 2007, 13, 95-99. Lewin M, Carlesso N, Tung CH, Tang XW, Cory D, Scadden DT, Weissleder R. Tat peptide-derivatized magnetic nanoparticles allow in vivo tracking and recovery of progenitor cells. Nat Biotechnol 2000, 18, 410-414. Lübbe AS, Bergemann C, Riess H, Schriever F, Reichardt P, Possinger K, Matthias M, Dörken B, Herrmann F, Gürtler R, Hohenberger P, Haas N, Sohr R, Sander B, Lemke AJ, Ohlendorf D, Huhnt W, Huhn D. Clinical experiences with magnetic drug targeting: a phase I study with 4’-epidoxorubicin in 14 patients with advanced solid tumors. Cancer Res 1996, 56, 4686-4693. Neuberger T, Schöpf B, Hofmann H, Hofmann M, von Rechenberg B. Superparamagnetic nanoparticles for biomedical applications: possibilities and limitations of a new drug delivery system. J Magn Magn Mater 2005, 293, 483-496. Rosenholm JM, Mamaeva V, Sahlgren C, Lindén M. Nanoparticles in targeted cancer therapy: mesoporous silica nanoparticles entering preclinical development stage. Nanomedicine (Lond) 2012, 7, 111-120. Snoeks TJA, Löwik CWGM, Kaijzel EL. ‘In vivo’ optical approaches to angiogenesis imaging. Angiogenesis 2010, 13, 135-147.. 29. Tartaj P, Morales MP, Veintemillas-Verdaguer S, González-Carreño T, Serna CJ. The preparation of magnetic nanoparticles for applications in biomedicine. J Phys D appl Phys 2003, 36, R182-197. 30. Thomas R, Park IK, Jeong YY. Magnetic iron oxide nanoparticles for multimodal imaging and therapy of cancer. Int J Mol Sci 2013, 14, 15910-15930. 31. Thorek DLJ, Chen AK, Czupryna J, Tsourkas A. Superparamagnetic iron oxide nanoparticle probes for molecular imaging. Ann Biomed Eng 2006, 34, 23-38. 32. Wang F, Tan WB, Zhang Y, Fan X, Wang M. Luminescent nanomaterials for biological labeling. Nanotechnology 2006, 17, R1-13. 33. Wang X, Zhang R, Wu C, Dai Y, Song M, Gutmann S, Gao F, Lv G, Li J, Li X, Guan Z, Fu D, Chen B. The application of Fe3O4 nanoparticles in cancer research: a new strategy to inhibit drug resistance. J Biomed Mater Res 2007, 80, 852-860. 34. Willard MA, Kurihara LK, Carpenter EE, Calvin S, Harris VG. Chemically prepared magnetic nanoparticles. Int Mater Rev 2004, 49, 125-170. 35. Yang RSH, Chang LW, Wu JP, Tsai MH, Wang HJ, Kuo YC, Yeh TK, Yang CS, Lin P. Persistent tissue kinetics and redistribution of nanoparticles, quantum dot 705, in mice: ICP-MS quantitative assessment. Environ Health Perspect 2007, 115, 1339-1343. 36. Yu MK, Jeong YY, Park J, Park S, Kim JW, Min JJ, Kim K, Jon S. Drugloaded superparamagnetic iron oxide nanoparticles for combined cancer imaging and therapy in vivo. Angew Chem Int Ed Engl 2008, 47, 5362-5365..
(8)
수치
관련 문서
