http://dx.doi.org/10.14405/kjvr.2014.54.4.245
245
<Original Article>
Evaluation of thermally cross-linked superparamagnetic iron oxide nanoparticles for the changes of concentration and toxicity on tissues
of Sprague-Dawley rats
Jin Joo Hue
1,†, Hu-Jang Lee
2,†, Sangyong Jon
3, Sang Yoon Nam
1, Young Won Yun
1, Jong-Soo Kim
1, Beom Jun Lee
1,*
1
College of Veterinary Medicine and Research Institute of Veterinary Medicine, Chungbuk National University, Cheongju 361-763, Korea
2
College of Veterinary Medicine and Research Institute of Life Science, Gyeongsang National University, Jinju 600-701, Korea
3
School of Life Science, Gwangju Institute of Science and Technology, Gwangju 500-712, Korea (Received: November 10, 2014; Revised: December 11, 2014; Accepted: December 18, 2014)
Abstract : This study was investigated the change of concentration and toxicity of thermally cross-linked superparamagnetic iron oxide nanoparticles (TCL-SPION) on tissues of Sprague-Dawley rats. TCL-SPION at the dose of 15 mg/kg body weight was intravenously injected into the tail vein of the male Sprague-Dawley rats. The fate of TCL-SPION in serum, urine and tissues was observed during 28 days. Serum iron level was maximal at 0.25 h post- injection and gradually declined thereafter. In addition, the sinusoids of liver and the red pulp area of spleen were mainly accumulated iron from 0.5 h to 28-day post-injection. In kidney, iron deposition was detected in the tubular area until 0.5 h after injection. Malondialdehyde concentration in the liver slightly increased with time and was not different with that at zero time. In the liver and spleen, TNF-α and IL-6 levels of TS treated with TCL-SPION were not different with those of the control during the experimental period. From the results, TCL-SPION could stay fairly long-time in certain tissues after intravenous injection without toxicity. The results indicated that TCL-SPION might be useful and safe as a contrast for the diagnosis of cancer or a carrier of therapeutic reagents to treat diseases.
Keywords : accumulation, biodistribution, rats, thermally cross-linked superparamagnetic iron oxide nanoparticles, toxicity
Introduction
Iron oxide nanoparticles, such as superparamagnetic iron oxide nanoparticles (SPIO) and ultra SPIO have been exten- sively investigated for biomedical applications due to their excellent biocompatibility [24]. They have been produced by a variety of synthesis processes ranging from traditional wet chemistry solution based methods to more exotic techniques such as laser pyrolysis or chemical vapor deposition [10, 27, 32]. Particularly, the technology of magnetic nanoparticle probes has seen increased efforts devoted to maturing by its potential as a central tool for efficient, cross-application, molec- ular imaging [28]. Although particles of iron oxide have been used as magnetic contrast agents for over 45 years [31], refinement in the synthesis and coating of magnetic nanopar- ticles, especially in the last decade, has led to their employ- ment in an abundance of novel biological applications.
The need to improve magnetic properties for applications,
such as molecular imaging, has generated interest for the development of metal-doped iron oxides due to their enhanced magnetic properties [14]. Cobalt and nickel ferrites have been also investigated recently for in vivo biomedical applications despite known toxicities of these elements [24].
The synthesis and coating of magnetic nanoparticles (MNPs), especially CoFe
2O
4, were examined as magnetic nanocarri- ers [2]. Cobalt leakage was monitored through Inductively Coupled Plasma-Atomic Emission Spectrometry (ICP-AES) and found to correspond with quality of surface coverage by the attached ligand. Similarly, the use of nanocrystalline NiFe
2O
4, as a drug carrier was recently investigated [25]. These applications include blood pooling, tissue and cell specific contrast agents for magnetic resonance (MR) imaging, cell tracking, and biomolecular detection [28]. In order to evalu- ate the success of any targeting strategy quantitatively, bio- distribution studies are essential and the nanoparticle accumu- lation at the target site gives insight to efficacy [7]. More-
*Corresponding author
Tel: +82-43-261-3357, Fax: +82-43-267-2595 E-mail: [email protected]
†
The first two authors contributed equally to this work.
over, to minimization of toxicity is the main goal of target- ing. Although off-target MNP has been shown to exhibit a generally favorable biocompatibility profile, its accumula- tion still can have the intention of raising toxicity concerns [9, 26]. Local elevation of low molecular weight iron species due to MNP biodegradation may be implicated in tissue dam- age via oxidative stress and inflammation [8]. Therefore, when thermally cross-linked superparamagnetic iron oxide nanoparticles (TCL-SPION) was used as a drug-delivery vehicle, the exposure to the nanoparticles in certain tissues should be thoroughly assessed.
In this study, the iron contents in the tissues were deter- mined to identify distribution and accumulation of TCL- SPION, and the levels of malondialdehyde (MDA) and cytok- ines in liver and spleen of rats were determined to identify cell toxicological effect of TCL-SPION.
Materials and Methods
TCL-SPION
The TCL-SPION was obtained from the Gwangju Insti- tute of Science and Technology (Gwangju, Korea). The TCL- SPION was consisted of two components, an iron oxide core (magnetite, Fe
3O
4) and a hydrophilic coating [poly-(TMSMA- r-PEGMA-r-NAS)]. The size of hydrodynamic particles was about 32.2 nm and zeta potential intensity was −22.18 mV.
In vivo studies
Animal experiments were performed in accordance with standard operation procedures of laboratory animals that were approved by Institutional Animal Care and Use Com- mittee of Laboratory Animal Research Center in Chungbuk National University.
One hundred sixty 6-week-old male Sprague-Dawley rats (body weight, 261.4 ± 11.7 g) were purchased from Koatec (Seoul, Korea). Upon arrival, the mice were housed in a tem- perature- and humidity-controlled environment with a reversed 12/12 h light/dark cycle, and had free access to food and water. After 1 week of acclimation, the mice were randomly divided into a normal group (n = 80) and TCL-SPION-treated group (TS, n = 80) based on body weight. Fifty μL of saline with 5% dextrose and TCL-SPION suspension prepared in saline with 5% dextrose (15 mg/mL) were injected into the tail vein of the mice according to a modified method by Lee et al. [16].
At different time points, urine samples were collected by the metabolic cage, and animals were euthanized with an intraperitoneal injection of pentobarbital sodium (120 mg/
kg). After transmission electron microscopy (TEM) of liver was performed, about 4 mL of blood was immediately col- lected through a cardiac puncture from five rats for each group. Animals were then perfused transcardially with hep- arinized saline for 20 min, and various tissues (liver, spleen, kidney, lung, brain and testis) were collected, washed thor- oughly with saline, and stored at −80
oC until taken for anal-
ysis. These tissues were used for determination of iron content using ICP-AES (JY 38 Plus; HORIBA Jobin Yvon, France). MDA and cytokines in liver and spleen were mea- sured using commercial immunoassay kits. In addition, tis- sues were stained for visualization of iron accumulation using Perl’s Prussian blue staining.
Analysis of iron levels in serum, urine and tissues Blood samples were allowed to clot at room temperature and centrifuged at 1,500 × g for 10 min to separate the serum for collection. Serum samples were analyzed for iron level and total iron binding capacity (TIBC) were measured using a Guanidine/FerroZine method (Roche Diagnostics; The Netherlands). The method is based upon the release of Fe(III) from transferrin by guanidine hydrochloride. After reduction to Fe(II), the bivalent ions produce a red complex with Fer- roZine [15]. Since transferrin is produced by the liver, the TIBC can be used to monitor liver function and nutrition [33].
Urine samples were digested and ashed at 200
oC for 4 h using concentrated HNO
3and H
2O
2. For the analysis of iron by ICP-AES (JY 38 Plus; HORIBA Jobin Yvon), the digested sample was diluted with 20 fold of de-ionized water before analysis.
Samples of liver, spleen, kidney, lung, brain and testis were analyzed for total iron by ICP-AES (JY 38 Plus, HORIBA Jobin Yvon) according to the method of Meyrick et al. [18].
Tissues were digested and ashed at 200
oC for 4 h using con- centrated HNO
3and H
2O
2. For the ICP-AES analysis of iron, the digested sample was diluted with 20 fold of de-ionized water before analysis.
Light microscopy in tissue
Perl’s Prussian blue staining for specific ferric ion was per- formed on formalin-fix, paraffin-embedded portions of liver, spleen, kidney, lung, brain and testis section according to the method by Wagner et al. [29]. The tissues embedded with paraffin was deparaffinized, rehydrated, and incubated in a ferrocyanide solution (20% hydrochloric acid and 10% potas- sium ferrocyanide; Sigma, USA) at 60
oC for 20 min. A counter stain used 0.1% nuclear fast red (Sigma) in 5% aluminum sulfate solution. The relative amount of staining from each tissue was assessed by light microscopy under 100× magnifi- cation.
Transmission electron microscopy (TEM) of liver
TEM was performed on liver according to the modified
method of Sajiki et al. [20]. The tissues were fixed with
2.5% glutaraldehyde in 0.1 M phosphate buffer for 4 h. The
tissues were then post-fixed in 2% osmium tetroxide (OSO
4)
(Ted Pella, USA). Samples were dehydrated through a series
of alcohol concentrations (20, 30, 40, 50, 60, and 70%) fol-
lowed by further dehydration (90, 96, 100% and dry alco-
hol). The tissues were treated with propylene oxide and,
finally, transferred them to the mixture of propylene oxide
and epoxy resin (1 : 1, v/v). The tissues were subsequently
embedded in Epon resin, and ultra-thin sections (60 nm) cut with diamond knives were stained with uranyl acetate and lead citrate, and viewed under Libra-120 electron micro- scope (Carl Zeiss, Germany) at 120 kV.
Analysis of MDA in liver and spleen
The amounts of MDA contained in the tissue homogenate were measured using commercial ELISA kits (Cayman Chemical, USA) according to the modified method of Kim et al. [13]. Briefly, a mixture of 100 μL liver and spleen homo- genate, 500 μL of 30 mg/mL sodium dodecyl sulfate, 2 mL HCl, 300 μL of 10 mg/mL phosphotungstic acid, and 1 mL of 7 mg/mL 2-thiobarbituric acid was incubated in boiling water for 30 min with 95
oC. After cooling, 5 mL of butanol was added. The organic layer was collected after centrifug- ing at 1,000 × g for 10 min at 4
oC. The absorbance was mea- sured at 532 nm and compare with a standard curve constructed with known concentration of 1,1,3,3-tetramethoxypropane.
The data were represented as μM MDA/mg protein.
Analysis of cytokines in liver and spleen
The amounts of TNF- α and IL-6 in the tissue homogenate were measured using commercial immunoassay kits (R&D systems, USA) according to the manufacturer’s guidelines. In brief, 50 μL of assay diluent RD1W was add into each well containing 50 μL of standard or exudate sample per well, and mixed by gently tapping the plate frame for one min and incubated for 2 h at room temperature. Into each well with diluted sample, 100 μL of rat TNF-α or rat IL-6 conjugate was added, incubated for 2 h at room temperature, and aspi- ration washed with 400 μL of wash buffer. Substrate solu- tion (100 μL) was added to each well and incubated for 30 min at room temperature, and then added 100 μL of stop solution. The absorbance of the content of each well at 450 nm was read using the ELISA plate reader (BioTek Instru- ments, Korea).
Statistical analysis
All data were presented as mean ± standard deviation. Sta- tistical analyses were carried out using one-way analysis of variance (ANOVA) followed by the least significant differ- ence (LSD) test with the computer software SPSS 12.0 (SPSS, USA). For all tests, groups were considered statistically sig- nificant when p < 0.05.
Results
Changes of iron levels in serum and urine
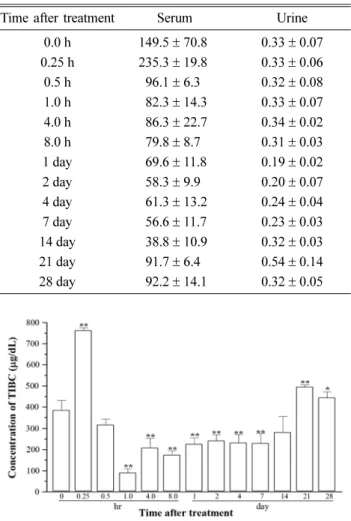
Iron levels of serum and urine were presented at Table 1.
After TCL-SPION injection, the serum iron level was the peak of 235.3 ± 19.8 μg/dL at 0.25 h post-injection, which was significantly increased compared to that of the zero-time control (p < 0.01). The serum iron level thereafter signifi- cantly decreased compared to that of the zero-time point (p <
0.01). At 14 day after administration of TCL-SPION, the
serum iron level was the lowest throughout the experimental periods. However, urine iron levels were maintained within the range of the normal value except for one day after treat- ment throughout the experimental period. The serum TIBC level was 379.7 ± 123.1 μg/dL at the zero-time point (Fig. 1).
After TCL-SPION injection, the serum TIBC at 0.5 h, 21 and 28 day significantly increased compared to that of the zero- time point (0.25 h and 21 day, p < 0.01; 28 day, p < 0.05). In addition, the serum TIBC level from at 1 h to 7 day signifi- cantly decreased compared to that of the zero-time control (p
< 0.01) (Fig. 1).
Changes of iron levels in tissues
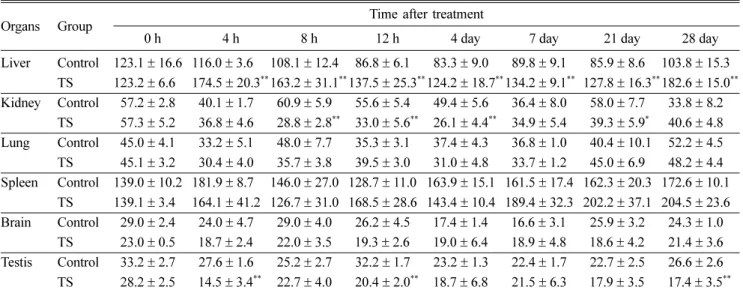
Iron levels of tissues were presented at Table 2. Changes in iron levels varied from tissue to tissue. Iron levels in the liver peaked at 4 h post-injection, and then gradually declined over
Table 1. Changes of iron levels in serum and urine of rats during 28 days post-injection of thermally cross-linked super- paramagnetic iron oxide nanoparticles (TCL-SPION) at the single dose of 15 mg/kgTime after treatment Serum Urine
0.0 h 149.5± 70.8 0.33± 0.07
0.25 h 235.3± 19.8 0.33± 0.06
0.5 h
296.1
± 6.3 0.32± 0.081.0 h
282.3
± 14.3 0.33± 0.074.0 h
286.3
± 22.7 0.34± 0.028.0 h
279.8
± 8.7 0.31± 0.031 day
269.6
± 11.8 0.19± 0.022 day
258.3
± 9.9 0.20± 0.074 day
261.3
± 13.2 0.24± 0.047 day
256.6
± 11.7 0.23± 0.0314 day
238.8
± 10.9 0.32± 0.0321 day
291.7
± 6.4 0.54± 0.1428 day
292.2
± 14.1 0.32± 0.05Fig. 1. Changes of total iron binding capacity levels in serum during 28 days post-injection of TCL-SPION at the single dose of 15 mg/kg. The serum iron was determined using Guanidine- ferrozine method. Data were expressed as means± standard deviation.
the next 4 days prior to a slow increase after 7 days. Liver iron levels in TS were significantly increased compared to those of control throughout the experimental period (p <
0.01). In the kidney, the iron levels in TS at 8, 12 h and 4 day post-injection were significantly decreased compared to those of control (p < 0.01), but the iron levels in TS were no signif- icant difference compared to those of control at the other time point. In addition, the iron levels of the testis in TS at 4 h, 12 h and 28 day were significantly decreased compared to those of control (p < 0.01). Furthermore, the iron levels of lung and brain in TS were maintained on the control level at
all experimental time points.
Perl’s Prussian blue staining in tissues
Histological findings of organs for iron accumulation were shown in Fig. 2. In liver and spleen, iron deposition was mainly observed in the hepatic sinusoids and the red pulp area, respectively, from at 0.5 h to 28-day post-injection of TCL-SPION (Fig. 2, A and B). In kidney, iron deposition was observed in the tubular area only at 0.5 h post-injection (Fig.
2, C). However, no iron depositions in lung, brain and testis were found throughout the experiment periods (Fig. 2, D-F).
Table 2. Changes of iron levels in tissues of Sprague-Dawley rat during 28 days after the injection of TCL-SPION at the single dose of 15 mg/kg
Organs Group Time after treatment
0 h 4 h 8 h 12 h 4 day 7 day 21 day 28 day
Liver Control 123.1± 16.6 116.0 ± 3.6 108.1 ± 12.4
186.8
± 6.1183.3
± 9.0189.8
± 9.1185.9
± 8.6 103.8 ± 15.3 TS 123.2± 6.6 174.5 ± 20.3**163.2± 31.1**137.5± 25.3**124.2± 18.7**134.2± 9.1** 127.8± 16.3**182.6± 15.0**Kidney Control
157.2
± 2.8140.1
± 1.7160.9
± 5.9155.6
± 5.4149.4
± 5.6136.4
± 8.0158.0
± 7.7133.8
± 8.2 TS157.3
± 5.2136.8
± 4.6128.8
± 2.8**133.0
± 5.6**126.1
± 4.4**134.9
± 5.4139.3
± 5.9*140.6
± 4.8 Lung Control145.0
± 4.1133.2
± 5.1148.0
± 7.7135.3
± 3.1137.4
± 4.3136.8
± 1.0140.4
± 10.1152.2
± 4.5 TS145.1
± 3.2130.4
± 4.0135.7
± 3.8139.5
± 3.0131.0
± 4.8133.7
± 1.2145.0
± 6.9148.2
± 4.4 Spleen Control 139.0± 10.2 181.9 ± 8.7 146.0 ± 27.0 128.7 ± 11.0 163.9 ± 15.1 161.5 ± 17.4 162.3 ± 20.3 172.6 ± 10.1TS 139.1± 3.4 164.1 ± 41.2 126.7 ± 31.0 168.5 ± 28.6 143.4 ± 10.4 189.4 ± 32.3 202.2 ± 37.1 204.5 ± 23.6 Brain Control
129.0
± 2.4124.0
± 4.7129.0
± 4.0126.2
± 4.5117.4
± 1.4116.6
± 3.1125.9
± 3.2124.3
± 1.0TS
123.0
± 0.5118.7
± 2.4122.0
± 3.5119.3
± 2.6119.0
± 6.4118.9
± 4.8118.6
± 4.2121.4
± 3.6 Testis Control133.2
± 2.7127.6
± 1.6125.2
± 2.7132.2
± 1.7123.2
± 1.3122.4
± 1.7122.7
± 2.5126.6
± 2.6 TS1128.2
± 2.5114.5
± 3.4**122.7
± 4.0120.4
± 2.0**118.7
± 6.8121.5
± 6.3117.9
± 3.5117.4
± 3.5**Values are presented as the mean± SE. TS: group treated with TCL-SPION. *p < 0.05 and **p < 0.01 vs. the control of each organ at the cor- responding time points.
Fig. 2. Histological findings of organs for iron accumulation at the various time points during 28 days post-injection of TCL-SPION at the single dose of 15 mg/kg. A, liver; B, spleen; C, kidney; D, lung; E, brain; F, testis. Tissue sections were stained with Perl’s Prus- sian blue. Ferric ion was stained with blue (100× magnification).
TEM in liver
Extracellular TCL-SPION was observed within perisinuso- idal spaces and cytoplasmic organelles in the liver at 0.5 and 8 h post-injection of TCL-SPION. In addition, the similar nanoparticles in the liver were still seen from at 7 to 28 day after post-injection (Fig. 3).
MDA and cytokines in liver and spleen
Changes of MDA levels within the liver and spleen were presented at Table 3. In the liver, the MDA concentrations at
2 h (p < 0.05), 7 (p < 0.05), 21 and 28 day (p < 0.05) post- injection were significantly increased compared to that of the zero-time point. However, the MDA levels of spleen were maintained to that of the zero-time control during 28 days post-injection.
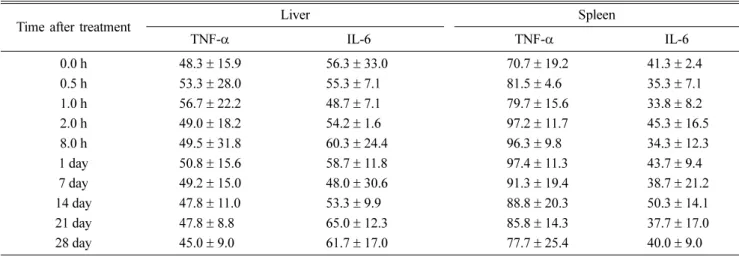
TNF- α and IL-6 levels in the liver and spleen were main- tained at the control value of zero-time point throughout the experimental period (Table 4). TNF- α and IL-6 in the liver peaked at 1 h and 21 day, respectively. In addition, TNF- α and IL-6 in the spleen peaked at 1 and 14 day, correspond- ingly. TNF- α and IL-6 in the liver and spleen repeatedly increased and decreased during the experimental period.
However, TNF- α in the spleen after TCL-SPION injection was higher than that in the zero-time control, but there was not significantly different.
Discussion
SPIO has been used as blood pooling and tissue- and cell- specific contrast agents in MR imaging and the other various biomedicinal parts [1]. In this study, the distribution and accumulation of TCL-SPION, a newly developed iron oxide nanoparticle, were determined by various methods. TCL- SPION stayed fairly long within the liver and spleen, but it did not cause any toxicity including oxidative stress and inflammation in the organs of rats.
The serum iron levels were maximal at 0.25 h post-injec- tion and slowly declined thereafter. However, it slightly increased after 21 days again. The change on the serum iron
Fig. 3. Transmission electron microscopy of the liver at 0.5 h, 8 h, 7 day, and 28 day post-injection of TCL-SPION (32.2 nm in diam- eter) at the single dose of 15 mg/kg. The nanoparticles (black arrow) were observed within sinusoides and kupffer cells of the liver.Ultra thin sections were stained with uranyl acetate and lead citrate and observed under a electron microscope at 1,600× and 2,000×
magnification. BV: blood vessel.
Table 3. Changes of MDA levels in the liver and spleen at various time points during 28 days post-injection of TCL-SPION at the single dose of 15 mg/kg
Time after treatment Liver Spleen
0.0 h 0.193± 0.022 0.177± 0.051 0.5 h 0.279± 0.026 0.189± 0.032 1.0 h 0.286± 0.026 0.180± 0.060 2.0 h 0.269± 0.030* 0.178± 0.019 8.0 h 0.287± 0.030 0.176± 0.029 1 day 0.267± 0.037 0.165± 0.054 7 day 0.337± 0.010** 0.172± 0.052 14 day 0.214± 0.033 0.168± 0.028 21 day 0.278± 0.046* 0.184± 0.040 28 day 0.277± 0.047* 0.164± 0.018
*p < 0.05 and **p < 0.01 vs. the zero-time value.
level would result from several simultaneously occurring processes, such as degradation of injected iron particles, the subsequent iron binding to different serum proteins, redistri- bution of the bound iron to cells and tissue, and its elimina- tion [12]. In addition, no significant change was found on the urine iron levels, which might be due to a lack of observa- tion time periods. Another study with ferumoxtran-10 (Advanced Magnetics, USA), which is an iron oxide core coated with low molecular weight dextran, reported a slow clearance of iron, extending beyond 7 weeks [5].
Ferromagnetic MNPs, composed of magnetite/magnemite, possess higher magnetic susceptibilities than antiferromag- netic (ferritin, hemosiderin) or paramagnetic (transferrin) endog- enous iron species [22]. The ICP-AES method has been known to be useful as a measure of total tissue iron [18]. In the present study, the iron contents within the tissues were determined with the ICP-AES method. Iron levels within the liver peaked at 4 h, the first data point after injection, and then gradually declined over the next 4 days prior to a slow increase after 7 days. In addition, the iron levels of spleen were increased at 7 days after the TCL-SPION injection. Many other studies reported that 75% of MNPs could be taken up by the reticuloendothelial system (RES), particularly in the liver [4, 12, 17]. The increase of iron levels in liver at later time points could be partly due to the intraportal transport of free iron released from biodegraded MNPs or smaller-sized particles formed as a result of degradation in the spleen [2, 3, 23]. In the present study, kidney, lung, brain and testis had no significant change of the iron levels. Similar to our results, the lack of any change in brain and testis iron levels during the 28 days after the nanparticle injection suggests that the intact magnetic nanoparticles don’t cross the blood-brain bar- rier [12]. Aging of the animals during the 3 weeks of the experimental period might partly explain the increase in iron levels in different tissues over time, but this increase is mar- ginal and ranges from 2 to 5% per month, depending on the tissues [30]. To obtain complete biodistribution data includ-
ing elimination through urine and stools, it may be possible to use
59Fe to synthesize iron oxide nanoparticles to achieve greater sensitivity of detection [11]. Perl’s Prussian blue stain- ing has also been used to observe iron deposition in the tis- sues. In this study, the iron deposition was observed in the hepatic sinusoids at 0.5 h after TCL-SPION injection and lasted until 28 days. In the spleen, it was observed mainly in the red pulp area throughout the whole period of 28-day post-injection. In the previous study, particles administered intravenously were cleared by macrophage cells and could be histologically identified in Kupffer cells of the liver or in macrophage cells of the splenic red pulp [21]. Intracellular particles were found routinely in the lysosome in which deg- radation in cells takes place via a wide variety of hydrolytic enzyme [6]. Compared with these results, much of the TCL- SPION seemed to be accumulated in the liver and spleen.
These results indicated that accumulation of nanoparticles may induce iron toxicity in target organs. The end products of lipid peroxidation, such as MDA assessment, have been very widely used indices of oxidative stress in clinical stud- ies [19]. In this study, the MDA levels in the liver at 2 h, 7, 21 and 28 day post-treatment were significant changes com- pared with those of the zero-time control. The previous study was suggested that Kupffer cells in liver can degrade iron oxide nanoparticles and can incorporate most of the iron into ferritin [6]. With the degradation of iron oxide nanoparticles in liver, the iron cannot participate in the iron-catalyzed lipid peroxidation. In addition, the cytokines such as TNF- α and IL-6 served as early mediators on inflammatory diagnosis were also determined in this study. The cytokine levels in the liver and spleen were maintained at a control level during experimental periods.
From these results, TCL-SPION could stay fairly long- time in certain tissues after intravenous injection, but it had no toxicity, indicating that it might be useful as a contrast for the diagnosis of cancer or a carrier of therapeutic reagents to treat diseases.
Table 4. Changes of TNF-α and IL-6 levels in the liver and spleen at various time points during 28 days post-injection of TCL-SPION at the single dose of 15 mg/kg
Time after treatment Liver Spleen
TNF-α IL-6 TNF-α IL-6
0.0 h 48.3± 15.9 56.3± 33.0 70.7± 19.2 41.3± 2.4
0.5 h 53.3± 28.0 55.3± 7.1 81.5± 4.6 35.3± 7.1
1.0 h 56.7± 22.2 48.7± 7.1 79.7± 15.6 33.8± 8.2
2.0 h 49.0± 18.2 54.2± 1.6 97.2± 11.7 45.3± 16.5
8.0 h 49.5± 31.8 60.3± 24.4 96.3± 9.8 34.3± 12.3
1 day 50.8± 15.6 58.7± 11.8 97.4± 11.3 43.7± 9.4
7 day 49.2± 15.0 48.0± 30.6 91.3± 19.4 38.7± 21.2
14 day 47.8± 11.0 53.3± 9.9 88.8± 20.3 50.3± 14.1
21 day 47.8± 8.8 65.0± 12.3 85.8± 14.3 37.7± 17.0
28 day 45.0± 9.0 61.7± 17.0 77.7± 25.4 40.0± 9.0
Acknowledgments
This work was supported by the Priority Research Centers Program through the National Research Foundation of Korea (NRF) funded by the Ministry of Education, Science and Technology (2011-0031403) and by a grant (08162-nanotox- icity-554) from the Korea Food and Drug Administration.
References
1. Arbab AS, Ichikawa T, Sou H, Araki T, Nakajima H, Ishigame K, Yoshikawa T, Kumagai H. Ferumoxides- enhanced double-echo T2-weighted MR imaging in differentiating metastases from nonsolid benign lesions of the liver. Radiology 2002, 225, 151-158.
2. Baldi G, Bonacchi D, Franchini MC, Gentili D, Lorenzi G, Ricci A, Ravagli C. Synthesis and coating of cobalt ferrite nanoparticles: a first step toward the obtainment of new magnetic nanocarriers. Langmuir 2007, 23, 4026-4028.
3. Ballou B, Lagerholm BC, Ernst LA, Bruchez MP, Waggoner AS. Noninvasive imaging of quantum dots in mice. Bioconjug Chem 2004, 15, 79-86.
4. Berry CC. Progress in functionalization of magnetic nanoparticles for applications in biomedicine. J Phys D Appl Phys 2009, 42, 224003.
5. Bourrinet P, Bengele HH, Bonnemain B, Dencausse A, Idee JM, Jacobs PM, Lewis JM. Preclinical safety and pharmacokinetic profile of ferumoxtran-10, an ultrasmall superparamagnetic iron oxide magnetic resonance contrast agent. Invest Radiol 2006, 41, 313-324.
6. Briley-Saebo KC, Johansson LO, Hustvedt SO, Haldorsen AG, Bjørnerud A, Fayad ZA, Ahlstrom HK. Clearance of iron oxide particles in rat liver effect of hydrated particle size and coating material on liver metabolism. Invest Radiol 2006, 41, 560-570.
7. Chertok B, Moffat BA, David AE, Yu F, Bergemann C, Ross BD, Yang VC. Iron oxide nanoparticles as a drug delivery vehicle for MRI monitored magnetic targeting of brain tumors. Biomaterials 2008, 29, 487-496.
8. Crichton RR, Wilmet S, Legssyer R, Ward RJ. Molecular and cellular mechanisms of iron homeostasis and toxicity in mammalian cells. J Inorg Biochem 2002, 91, 9-18.
9. Goya GF, Grazu V, Ibarra MR. Magnetic nanoparticles for cancer therapy. Curr Nanosci 2008, 4, 1-6.
10. Gupta AK, Curtis AS. Surface modified superparamagnetic nanoparticles for drug delivery: interaction studies with human fibroblasts in culture. J Mater Sci Mater Med 2004, 15, 493-496.
11. Harisinghani MG, Barentsz J, Hahn PF, Deserno WM, Tabatabaei S, van de Kaa CH, de la Rosette J, Weissleder R. Noninvasive detection of clinically occult lymph-node metastases in prostate cancer. N Engl J Med 2003, 348, 2491-2499.
12. Jain TK, Reddy MK, Morales MA, Leslie-Pelecky DL, Labhasetwar V. Biodistribution, clearance, and biocompatibility of iron oxide magnetic nanoparticles in rats. Mol Pharm 2008, 5, 316-327.
13. Kim JH, Hue JJ, Kang BS, Park H, Nam SY, Yun YW, Kim JS, Lee BJ. Effects of selenium on colon carcinogenesis
induced by azoxymethane and dextran sodium sulfate in mouse model with high-iron diet. Lab Anim Res 2011, 27, 9-18.
14. Kohler N, Sun C, Wang J, Zhang M. Methotrexate- modified superparamagnetic nanoparticles and their intracellular uptake into human cancer cells. Langmuir 2005, 21, 8858- 8864.
15. Kolb AM, Smit NPM, Lentz-Ljuboje R, Osanto S, van Pelt J. Non-transferrin bound iron measurement is influenced by chelator concentration. Anal Biochem 2009, 385, 13-19.
16. Lee H, Yu MK, Park S, Moon S, Min JJ, Jeong YY, Kang HW, Jon S. Thermally cross-linked superparamag- netic iron oxide nanoparticles: synthesis and application as a dual imaging probe for cancer in vivo. J Am Chem Soc 2007, 129, 12739-12745.
17. Lewin M, Carlesso N, Tung CH, Tang XW, Cory D, Scadden DT, Weissleder R. Tat peptide-derivatized magnetic nanoparticles allow in vivo tracking and recovery of progenitor cells. Nat Biotechnol 2000, 18, 410-414.
18. Meyrick D, Webb J, Cole C. Iron and iron proteins found in the genetic disease, hereditary spherocytosis. Inorganica Chim Acta 2002, 339, 481-487.
19. Padurariu M, Ciobica A, Hritcu L, Stoica B, Bild W, Stefanescu C. Changes of some oxidative stress markers in the serum of patients with mild cognitive impairment and Alzheimer’s disease. Neurosci Lett 2010, 469, 6-10.
20. Sajiki J, Iwata H, Paek HJ, Tosha T, Fujita S, Ueda Y, Park YG, Zhu B, Satoh S, Ikai I, Yamaoka Y, Ikada Y.
Transmission electron microscopic study of hepatocytes in bioartificial liver. Tissue Eng 2000, 6, 627-640.
21. Sarin H. Physiologic upper limits of pore size of different blood capillary types and another perspective on the dual pore theory of microvascular permeability. J Angiogenes Res 2010, 2, 14.
22. Shapiro EM, Skrtic S, Sharer K, Hill JM, Dunbar CE, Koretsky AP. MRI detection of single particles for cellular imaging. Proc Natl Acad Sci U S A 2004, 101, 10901- 10906.
23. Singh R, Pantarotto D, Lacerda L, Pastorin G, Klumpp C, Prato M, Bianco A, Kostarelos K. Tissue biodistribution and blood clearance rates of intravenously administered carbon nanotube radiotracers. Proc Natl Acad Sci U S A 2006, 103, 3357-3362.
24. Sun C, Lee JSH, Zhang M. Magnetic nanoparticles in MR imaging and drug delivery. Adv Drug Deliv Rev 2008, 60, 1252-1265.
25. Rana S, Gallo A, Srivastava RS, Misra RDK. On the suitability of nanocrystalline ferrites as a magnetic carrier for drug delivery: functionalization, conjugation and drug release kinetics. Acta Biomater 2007, 3, 233-242.
26. Riggio C, Calatayud MP, Hoskins C, Pinkernelle J, Sanz B, Torres TE, Ibarra MR, Wang L, Keilhoff G, Goya GF, Raffa V, Cuschieri A. Poly-l-lysine-coated magnetic nanoparticles as intracellular actuators for neural guidance.
Int J Nanomedicine 2012, 7, 3155-3166.
27. Tartaj P, Morales MDP, Veintemillas-Verdaguer S, González-Carreño T, Serna CJ. The preparation of magnetic nanoparticles for applications in biomedicine. J Phys D Appl Phys 2003, 36, R182-197.
28. Thorek DLJ, Chen AK, Czupryna J, Tsourkas A.
Superparamagnetic iron oxide nanoparticle probes for molecular imaging. Ann Biomed Eng 2006, 34, 23-38.
29. Wagner KR, Sharp FR, Ardizzone TD, Lu A, Clark JF.
Heme and iron metabolism: Role in cerebral hemorrhage. J Cereb Blood Flow Metab 2003, 23, 629-652.
30. Wang YX, Hussain SM, Krestin GP. Superparamagnetic iron oxide contrast agents: Physicochemical characteristics and applications in MR imaging. Eur Radiol 2001, 11, 2319-2331.
31. Weinstein JS, Varallyay CG, Dosa E, Gahramanov S, Hamilton B, Rooney WD, Muldoon LL, Neuwelt EA.
Superparamagnetic iron oxide nanoparticles: diagnostic magnetic
resonance imaging and potential therapeutic applications in neurooncology and central nervous system inflammatory pathologies, a review. J Cereb Blood Flow Metab 2010, 30, 15-35.
32. Willard MA, Kurihara LK, Carpenter EE, Calvin S, Harris VG. Chemically prepared magnetic nanoparticles.
Int Mater Rev 2004, 49, 125-170.
33. Zhang P, Sawicki V, Lewis A, Hanson L, Monks J, Neville MC. The effect of serum iron concentration on iron secretion into mouse milk. J Physiol 2000, 522, 479- 491.