https://doi.org/10.5468/ogs.2018.61.3.309 pISSN 2287-8572 · eISSN 2287-8580
Introduction
Gestational diabetes mellitus (GDM) is a common metabolic complication affecting 6–7% of pregnancies by western re- port [1]. Prevalence of GDM in Korea has increased from 1.7–
3.9% in 1995 [2] to 3–5% in 2012 [3]. Of note, according to a recent Korean study using data from the Health Insurance Review and Assessment database showed that the prevalence of GDM in Korean women recently reached up to 5.7–9.5%
between 2007 and 2011 [4].
It is well known that GDM patients are at higher maternal complications including gestational hypertension, preeclamp-
The trends and risk factors to predict adverse outcomes in gestational diabetes mellitus: a 10-year experience from 2006 to 2015 in a single tertiary center
Minji Kim, Juyoung Park, Soo Hyun Kim, Yoo Min Kim, Cheonga Yee, Suk-Joo Choi, Soo-young Oh, Cheong-Rae Roh
Department of Obstetrics and Gynecology, Samsung Medical Center, Sungkyunkwan University School of Medicine, Seoul, Korea
Objective
To investigate the change of maternal characteristics, delivery and neonatal outcomes in gestational diabetes mellitus (GDM) over recent 10 years and to identify the risk factors associated with adverse outcome.
Methods
Consecutive GDM patients (n=947) delivered in our institution were included. Research period was arbitrarily divided into 2 periods (period 1: from 2006 to 2010, period 2: from 2011 to 2015). Multiple pregnancies or preexisting diabetes were excluded. Maternal baseline characteristics, delivery and neonatal outcomes were reviewed. Fetal biometric findings by prenatal ultrasonography were collected. Adverse pregnancy outcome (APO) was defined by the presence of one of the followings; shoulder dystocia, neonatal macrosomia (>4 kg), neonatal hypoglycemia (<35 mg/dL), respiratory distress syndrome (RDS), and admission to the neonatal intensive care unit (NICU) in term pregnancy.
Results
Period 2 was associated with older maternal age (34 vs. 33, P<0.001) and higher proportion of GDM A2 compared to period 1 (30.9% vs. 23.0%, P=0.009). By univariate analysis, APO was associated with increased body mass index (BMI) at pre-pregnancy (23.4 kg/m
2vs. 21.8 kg/m
2, P=0.001) or delivery (27.9 kg/m
2vs. 25.8 kg/m
2, P<0.001), higher HbA1c at diagnosis (5.6% vs. 5.3%, P<0.001) or delivery (5.8% vs. 5.5%, P=0.044), and larger fetal biometric findings (abdominal circumference [AC] and estimated fetal weight, P=0.029 and P=0.007, respectively). Multivariate analysis showed pre- pregnancy BMI (odds ratio [OR], 1.101; 90% confidence interval [CI], 1.028–1.180) and fetal AC (OR, 1.218; 90% CI, 1.012–1.466) were independently associated with adverse outcomes.
Conclusion
Our study demonstrated the trends and relevant factors associated with the adverse outcomes.
Keywords: Diabetes, gestational; Pregnancy outcome; Dystocia; Fetal macrosomia; Respiratory distress syndrome, Newborn
Received: 2017.06.04. Revised: 2017.10.10. Accepted: 2017.10.13.
Corresponding author: Soo-young Oh
Department of Obstetrics and Gynecology, Samsung Medical Center, Sungkyunkwan University School of Medicine, 81 Irwon- ro, Gangnam-gu, Seoul 06351, Korea
E-mail: [email protected]
https://orcid.org/0000-0003-3002-0048
Articles published in Obstet Gynecol Sci are open-access, distributed under the terms of the Creative Commons Attribution Non-Commercial License (http://creativecommons.
org/licenses/by-nc/3.0/) which permits unrestricted non-commercial use, distribution, and reproduction in any medium, provided the original work is properly cited.
Copyright © 2018 Korean Society of Obstetrics and Gynecology
sia, and increased cesarean section rate. Importantly, GDM is associated with increased risk of diabetes later in life. A Kore- an multicenter study including 1,686 patients recently report- ed that up to 18.4% of GDM was subsequently diagnosed as overt diabetes mellitus (DM) in postpartum period [5]. Fetal and neonatal complications of GDM include macrosomia, shoulder dystocia, neonatal hypoglycemia, neonatal respira- tory distress syndrome (RDS) [1,6]. Although increased level of fasting blood glucose seems to be associated with higher risk of stillbirth during the last 4 to 8 weeks of gestation [6], the relationship between glycemic control and fetal death in the uterus is uncertain [7].
The recommended timing of delivery in GDM patients re- mains controversial. Whereas the American Diabetes Associa- tion recommends delivery during the 38th week of gestation [6], the American College of Obstetricians and Gynecologists guidelines suggest that well controlled patients without medi- cation do not require delivery before 39 weeks of gestation.
The timing of delivery in women with well controlled GDM by medical therapy is recommended from 39.0 weeks to 39.6 weeks of gestation [1]. In a randomized controlled trial on the induction versus expectant management of labor in GDM, the results showed no difference in pregnancy outcomes between the early induction group at 38 weeks of gestation and the expectant group up to 41 weeks of gestation [8]. However, for poorly controlled GDM patients, early delivery between 37.0 weeks and 38.6 weeks of gestation is supported [1,9].
Neonates of GDM patients have increased risks for RDS, low Apgar scores, admission to the neonatal intensive care unit (NICU) [10]. Delivery before 38 weeks of gestation can in- crease the risk of neonatal morbidity and mortality associated with prematurity. Delivery at later gestations poses neonatal risk of macrosomia, shoulder dystocia, and stillbirth, etc.
Therefore, risk-based patient counseling is necessary as peri- natal outcomes tend to differ according to the risk factors.
Several studies have been performed to find the associ- ated factors of adverse prenatal outcomes in GDM patients.
They included maternal obesity before conception, excessive weight gain, and HbA1c at diagnosis, etc. Since prenatal ultrasonography is frequently used to monitor fetal growth in GDM patients in obstetric practice, fetal biometric find- ings such as abdominal circumference (AC) could be readily utilized to assess the adverse outcome of neonates in GDM and are being incorporated in recent reports [11]. In fact, fetal ultrasound-guided therapy of GDM was already suggested to
be used to limit excess macrosomia and large for gestational age (LGA) neonates [12].
With this background, the goal of this study was to perform a retrospective study to find out the clinical trend of Korean GDM patients over a 10-year period who delivered in our in- stitution and to identify the risk factors of adverse outcomes among maternal baseline characteristics and fetal biometric parameters by prenatal ultrasonography.
Materials and methods
This is a retrospective cohort study by reviewing the electronic medical records of patients who delivered with the diagnosis of GDM between January 2006 and December 2015 at our institution, which is one of the tertiary hospitals located in Seoul, Korea. During the study period, 947 consecutive single- ton pregnancies with GDM were identified. Pre-existing dia- betes and multiple gestations were excluded in the research.
All patients were diagnosed of GDM by the 2-step approach during pregnancy. Abnormal value for the 50 g oral glucose tolerance test (OGTT) was blood glucose ≥140 mg/dL. GDM was defined when 2 or more of the venous plasma glucose concentration equaled or exceeded the criteria at fasting, 1 hour, 2 hours, and 3 hours after 100 g oral glucose load. Ab- normal values of the 100 g OGTT were defined as the fasting blood glucose ≥95 mg/dL, 1 hour blood glucose ≥180 mg/dL, 2 hours blood glucose ≥155 mg/dL, 3 hours blood glucose
≥140 mg/dL [6]. Women who were diagnosed of GDM un- derwent specialized GDM education program including diet and exercise details and were instructed about self-capillary glucose monitoring. After 1 or 2 weeks of glucose check, when the blood glucose did not meet the target level (fast- ing >95 mg/dL or 2 hours postprandial >140 mg/dL), insulin treatment was started with the supervision of physicians.
The composite adverse outcomes include macrosomia,
shoulder dystocia, neonatal hypoglycemia, RDS, and admis-
sion to the NICU which occurred in term gestation. Macro-
somia was defined as birthweight that equals or exceeds
4,000 g. Shoulder dystocia was defined as delivery requiring
additional manipulation such as McRoberts’ maneuver. Neo-
natal hypoglycemia was defined as the blood glucose <35
mg/dL at initial work up as previously used in other studies
[13]. RDS was defined as presence of respiratory grunting
and retraction of the chest, an increased oxygen requirement
(FiO
2>0.4) combined with ground-glass appearance and air bronchograms on chest radiographs requiring surfactant treatment. Patients with sonographic results that were ac- quired less than 1 week before term delivery were selected to evaluate the relationship between sonographic findings and adverse outcomes. For fetal biometric findings, biparietal di-
ameter (BPD), head circumference, AC, and femur length (FL) were collected.
At initial statistical analysis, we assessed whether the data followed a normal distribution. Most data showed non-para- metric pattern except for HbA1c at delivery, and thus were re- ported as the median for continuous variables. The t-test (para-
Table 1. Maternal baseline characteristics of gestational diabetes mellitus by time period
Characteristics Period 1 (2006–2010)
(n=374)
Period 2 (2011–2015)
(n=573) P-value
Age (yr) 33 (20–46) 34 (22–52) <0.001
Primiparity 167 (44.7) 294 (51.3) 0.046
History of preterm delivery 43 (11.5) 48 (8.4) 0.116
BMI at pre-pregnancya) (n=901) (kg/m2) 22.2 (14.5–41.0) 21.9 (14.8–44.6) 0.311
BMI category 0.684b)
<18.5 32 (8.6) 56 (10.6)
18.6–25.0 253 (67.8) 352 (66.7)
25.1–30.0 65 (17.4) 94 (17.8)
30.1–35.0 20 (5.4) 19 (3.6)
35.1–40.0 2 (0.5) 5 (0.9)
>40.0 1 (0.3) 2 (0.4)
BMI at deliverya) (n=939) (kg/m2) 26.6 (18.4–45.0) 25.7 (16.7–47.6) 0.010
BMI category 0.009b)
<18.5 1 (0.3) 2 (0.4)
18.6–25.0 120 (32.3) 250 (44.1)
25.1–30.0 171 (46.0) 219 (38.6)
30.1–35.0 67 (18.0) 73 (12.9)
35.1–40.0 11 (3.0) 18 (3.2)
>40.0 2 (0.5) 5 (0.9)
Glucose level after 50 g OGTT (mg/dL) 160 (91–303) 160 (92–293) 0.767
Glucose level in 100 g OGTT (mg/dL)
Fasting 85 (40–125) 87 (52–124) 0.776
1 hr 189 (95–274) 188 (108–275) 0.665
2 hr 175 (90–260) 172 (63–265) 0.210
3 hr 149 (58–228) 145 (42–230) 0.070
Type of GDM 0.009
GDM A1 288 (77.0) 396 (69.1)
GDM A2 86 (23.0) 177 (30.9)
HbA1c at diagnosis (%) 5.4 (4.2–6.4) 5.3 (3.2–6.5) 0.081
HbA1c at delivery (%) 5.5±0.5 5.5±0.4 0.717
Values are presented as number (%), median (range), or mean ± standard deviation.
GDM, gestational diabetes mellitus; BMI, body mass index; OGTT, oral glucose tolerance test.
a)Forty-six and eight patients were excluded from the analysis of BMI at pre-pregnancy and delivery respectively, due to unavailable information;
b)By linear by linear analysis.
metric variables) and the Mann-Whitney test (non-parametric) were used in the univariate analysis for continuous variables.
The χ
2test (parametric) and Fisher’s exact test (non-parametric) were performed for the categorical variables. First, charac- teristics according to 2 periods (between 2006 and 2010, 2011 and 2015) were compared. Second, variables which are related to adverse outcomes were evaluated in term deliver- ies by univariate analysis. Multivariate analysis was also used to identify factors that were associated most with adverse outcomes. Statistical analysis was conducted using SPSS (IBM, Chicago, IL, USA). A probability value of <0.05 was consid- ered of statistical significance. The study was approved by the Institutional Review Board in Samsung Medical Center (No.
2017-08-094).
Results
Between January 2006 and December 2015, we identified 947 consecutive women with GDM who delivered in our in- stitution. Since the total number of deliveries in our institution was 9,635 and 8,169 in period 1 and period 2, respectively, the incidence of GDM was calculated to be 3.9% in period 1 and 7.0% in period 2, showing an increasing trend. Maternal baseline characteristics of the study population according to 2 periods (period 1: 2006 and 2010, period 2: 2011 and 2015) are summarized in Table 1. Period 2 was associated with older maternal age (34 vs. 33, P<0.001) and higher proportion of primiparity (51.3% vs. 44.7%, P=0.046) compared to period 1. The proportion of GDM A2 was also higher (30.9% vs.
23.0%, P=0.009) in period 2 than in period 1. Although ma-
Table 2. Delivery and neonatal outcomes of gestational diabetes mellitus by time period
Characteristics Period 1 (2006–2010)
(n=374)
Period 2 (2011–2015)
(n=573) P-value
GA at delivery (day) 272 (178–292) 271 (163–294) 0.460
Preterm delivery 60 (16.0) 105 (18.3) 0.382
Labor type 0.117
Spontaneous 157 (42.0) 256 (44.7)
Induction 101 (27.0) 174 (30.4)
No labor (elective cesarean) 116 (31.0) 143 (25.0)
Delivery mode 0.231
Vaginal 191 (51.1) 316 (55.1)
Cesarean 183 (48.9) 257 (44.9)
Preeclampsia 31 (8.3) 45 (7.9) 0.808
FDIU 0 (0) 1 (0.2) 1.000
Male gender 192 (51.3) 318 (55.5) 0.230
Fetal anomaly 5 (1.3) 15 (2.6) 0.248
Neonatal weight (g) 3,220 (840–4,770) 3,110 (460–4,620) 0.002
Macrosomia (>4 kg) 17/374 (4.5) 16/573 (2.8) 0.204
1' Apgar score <4 6 (1.6) 8 (1.4) 0.790
5' Apgar score <7 4 (1.1) 9 (1.6) 0.582
Shoulder dystociaa) 1/191 (0.5) 2/316 (0.6) 1.000
Neonatal glucose level (mg/dL) 69 (19–151) 65 (26–190) 0.004
Hypoglycemia (<35 mg/dL) 11 (3.0) 14 (2.5) 0.680
Respiratory distress syndrome 13 (3.5) 39 (6.8) 0.029
NICU admission 37 (9.9) 73 (12.7) 0.213
Adverse outcome 72 (19.3) 116 (20.2) 0.739
Values are presented as number (%) and median (range).
GA, gestational age; FDIU, fetal death in utero; RDS, respiratory distress syndrome; NICU, neonatal intensive care unit.
a)Vaginal delivery was used as the denominator for shoulder dystocia.
ternal body mass index (BMI) at pre-pregnancy was not differ- ent between 2 periods, BMI at delivery was significantly lower (25.7 kg/m
2vs. 26.6 kg/m
2, P=0.010) in period 2, reflecting more strict maternal weight control. Comparison using BMI category showed similar results. The glucose levels from 50 g OGTT and 100 g OGTT were not different between 2 periods.
HbA1c at diagnosis also showed no difference.
Table 2 demonstrated the delivery and neonatal outcomes of GDM in 2 periods. Overall, gestational age at delivery and the rate of preterm delivery showed no difference between 2 groups. As shown in Table 2, cesarean section rate (48.9%
vs. 44.9%) and the rate of labor induction (27.0% vs. 30.4%) showed no difference in period 1 and period 2. Of note, the median neonatal weight at birth (3,110 g vs. 3,220 g,
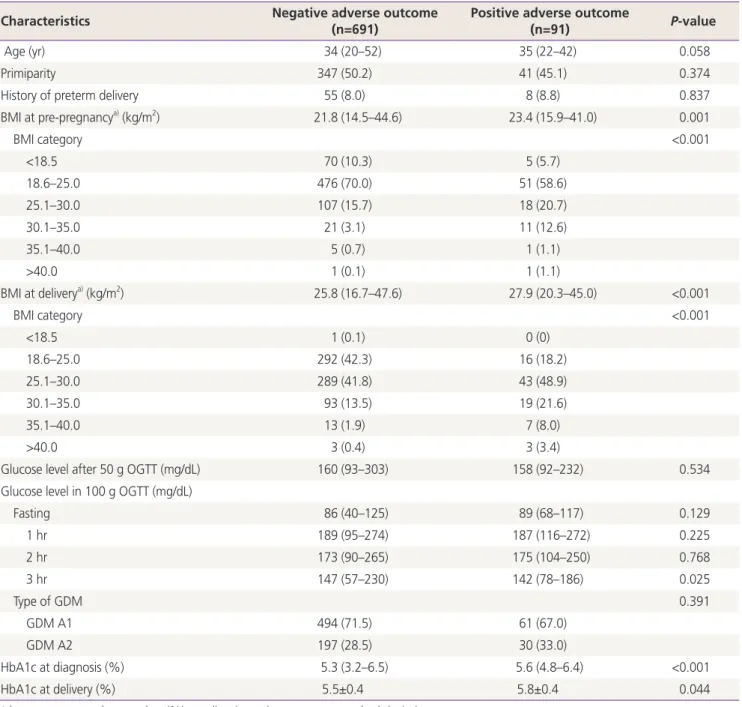
Table 3. Comparison of maternal characteristics according to adverse outcome in term pregnancy
Characteristics Negative adverse outcome
(n=691)
Positive adverse outcome
(n=91) P-value
Age (yr) 34 (20–52) 35 (22–42) 0.058
Primiparity 347 (50.2) 41 (45.1) 0.374
History of preterm delivery 55 (8.0) 8 (8.8) 0.837
BMI at pre-pregnancya) (kg/m2) 21.8 (14.5–44.6) 23.4 (15.9–41.0) 0.001
BMI category <0.001
<18.5 70 (10.3) 5 (5.7)
18.6–25.0 476 (70.0) 51 (58.6)
25.1–30.0 107 (15.7) 18 (20.7)
30.1–35.0 21 (3.1) 11 (12.6)
35.1–40.0 5 (0.7) 1 (1.1)
>40.0 1 (0.1) 1 (1.1)
BMI at deliverya) (kg/m2) 25.8 (16.7–47.6) 27.9 (20.3–45.0) <0.001
BMI category <0.001
<18.5 1 (0.1) 0 (0)
18.6–25.0 292 (42.3) 16 (18.2)
25.1–30.0 289 (41.8) 43 (48.9)
30.1–35.0 93 (13.5) 19 (21.6)
35.1–40.0 13 (1.9) 7 (8.0)
>40.0 3 (0.4) 3 (3.4)
Glucose level after 50 g OGTT (mg/dL) 160 (93–303) 158 (92–232) 0.534
Glucose level in 100 g OGTT (mg/dL)
Fasting 86 (40–125) 89 (68–117) 0.129
1 hr 189 (95–274) 187 (116–272) 0.225
2 hr 173 (90–265) 175 (104–250) 0.768
3 hr 147 (57–230) 142 (78–186) 0.025
Type of GDM 0.391
GDM A1 494 (71.5) 61 (67.0)
GDM A2 197 (28.5) 30 (33.0)
HbA1c at diagnosis (%) 5.3 (3.2–6.5) 5.6 (4.8–6.4) <0.001
HbA1c at delivery (%) 5.5±0.4 5.8±0.4 0.044
Values are presented as number (%), median (range), or mean ± standard deviation.
BMI, body mass index; OGTT, oral glucose tolerance test; GDM, gestational diabetes mellitus.
a)Fifteen and three patients were excluded from the analysis of BMI at pre-pregnancy and delivery, respectively, due to unavailable information.
P=0.002) were significantly lower in period 2 compared to
period 1. The composite adverse outcome, defined as any of macrosomia, shoulder dystocia, neonatal hypoglycemia,
RDS, or admission to the NICU was not different between period 1 and period 2 (19.3% vs. 20.2%). Among adverse outcomes, RDS was significantly higher in period 2 compared
Table 4. Comparison of ultrasound findings according to adverse outcome in term pregnancya) Characteristics Negative adverse outcome
(n=369)
Positive adverse outcome
(n=40) P-value
BPD (cm) 9.3 (7.9–10.4) 9.4 (8.3–9.9) 0.051
HC (cm) 32.9 (30.0–35.5) 33.1 (30.9–34.3) 0.895
HCb) (%) 0.824
<3 percentile 1/56 (1.8) 0/6 (0)
3–10 percentile 11/56 (19.6) 1/6 (16.7)
11–50 percentile 34/56 (60.7) 3/6 (50.0)
51–90 percentile 10/56 (17.9) 2/6 (33.3)
91–97 percentile 0/56 (0) 0/6 (0)
>97 percentile 0/56 (0) 0/6 (0)
AC (cm) 33.7 (27.5–38.3) 34.4 (26.8–38.5) 0.029
ACb) (%) 0.003
<3 percentile 7/332 (2.1) 1/35 (2.9)
3–10 percentile 30/332 (9.0) 1/35 (2.9)
11–50 percentile 185/332 (55.7) 13/35 (37.1)
51–90 percentile 104/332 (31.3) 16/35 (45.7)
91–97 percentile 6/332 (1.8) 4/35 (11.4)
>97 percentile 0/332 (0) 0/35 (0)
FL (cm) 7.0 (3.5–8.6) 7.1 (5.7–7.8) 0.161
FLb) (%) 0.649
<3 percentile 10/335 (3.0) 1/35 (2.9)
3–10 percentile 65/335 (19.4) 4/35 (11.4)
11–50 percentile 243/335 (72.5) 27/35 (77.1)
51–90 percentile 15/335 (4.5) 3/35 (8.6)
91–97 percentile 2/335 (0.6) 0/35 (0)
>97 percentile 0/335 (0) 0/35 (0)
EFW (g) 3,175 (1,995–4,565) 3,391 (1,684–4,353) 0.007
EFWc) (%) <0.001
<10 percentile 31/369 (8.4) 4/40 (10.0)
11–25 percentile 53/369 (14.4) 3/40 (7.5)
26–50 percentile 0/369 (0) 0/40 (0)
51–75 percentile 220/369 (59.6) 13/40 (32.5)
76–90 percentile 49/369 (13.3) 10/40 (25.0)
>90 percentile 16/369 (4.3) 10/40 (25.0)
BPD, biparietal diameter; HC, head circumference; AC, abdominal circumference; FL, femur length; EFW, estimated fetal weight.
a)Among term pregnancies, only patients whose ultrasonography results achieved in less than one week before delivery were selected for sta- tistical analysis; b)Based on the report from National Data from Korean Health Insurance Review and Assessment Service 2009; c)Based on the study by Hadlock FP, Deter RL, Harrist RB, Park SK. Estimating fetal age: computer-assisted analysis of multiple fetal growth parameters. Radiol- ogy 1984;152:497-501.
to period 1 (6.8% vs. 3.5%, P=0.029). However, when lim- ited in term birth, the incidence of RDS was similar in both periods (0.3% vs. 0.6%). The median neonatal glucose level was lower in period 2 compared to period 1 (65 mg/dL vs. 69 mg/dL, P=0.004). But the incidence of neonatal hypoglycemia showed no difference between 2 periods (3.0% vs. 2.5%).
Similar findings were observed when limited to term birth group. That is, the median neonatal glucose level in term birth was lower in period 2 compared to period 1 (68 mg/dL vs. 71 mg/dL, P=0.028) but the incidence of neonatal hypoglycemia was similar between 2 periods (2.1% vs. 2.4%).
Since neonatal hypoglycemia and RDS among adverse outcomes were closely related with prematurity itself as well as GDM, we limited cases with term birth to identify risk factors for the development of adverse outcome of GDM in our study population. Among term birth, the incidence of shoulder dystocia, macrosomia, neonatal hypoglycemia, RDS, and admission to the NICU was 0.3%, 4.2%, 1.9%, 0.5%, and 2.9% respectively. Maternal characteristics according to adverse outcomes among patients who delivered at term are summarized in Table 3. The median maternal pre-pregnancy BMI (23.4 kg/m
2vs. 21.8 kg/m
2, P=0.001), maternal BMI at delivery (27.9 kg/m
2vs. 25.8 kg/m
2, P<0.001), HbA1c at diagnosis (5.6% vs. 5.3%, P<0.001), and mean HbA1c at delivery (5.8% vs. 5.5%, P=0.044) were significantly higher in the group with adverse outcomes. Among patients who delivered at term, only patients with prenatal ultrasonogra- phy results achieved less than one week before delivery were selected to undergo analysis to find relationships between sonographic results and adverse outcomes. As shown in Table 4, the AC, the percentile of AC, estimated fetal weight (EFW), and the percentile of EFW manifested significantly larger in
the adverse outcome group.
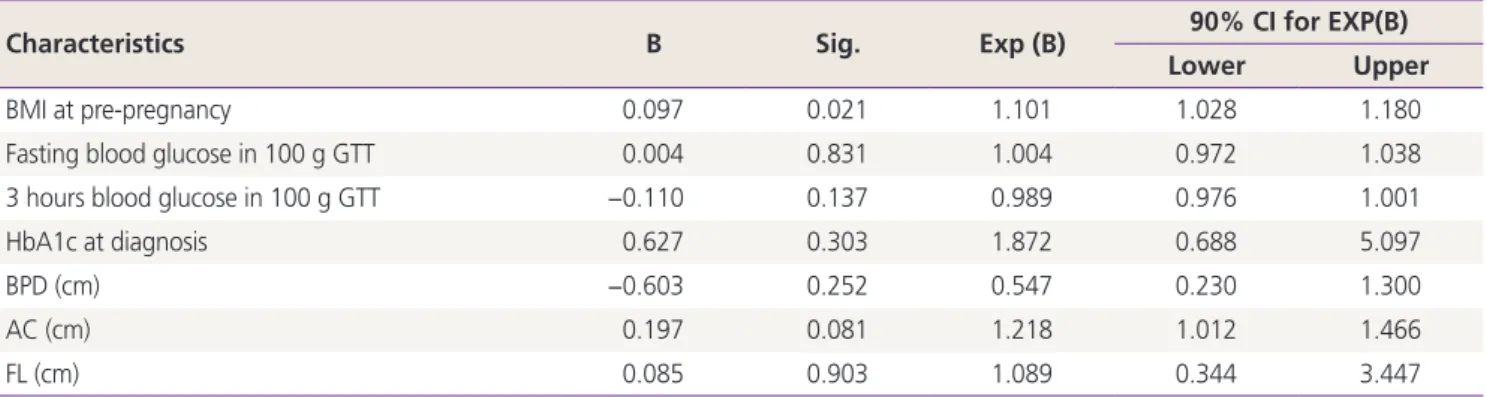
Lastly, since each parameter related to adverse outcome found by univariate analysis is closely interrelated, we per- formed a multivariate analysis to identify independent risk factors for the development of adverse outcome in term birth. Among the variables that were statistically significant in the univariate analysis, we went through linear regression to discard variables that showed multicollinearity. We selected 8 variables according to statistical or clinical significance. The variance inflation factor of each variable was low enough to move on to the multivariate analysis. Maternal pre-pregnancy BMI, fasting blood glucose at 100 g glucose tolerance test (GTT), 3 hours blood glucose at 100 g GTT, HbA1c at diagno- sis, fetal BPD, fetal AC, and the fetal FL were included in the multivariate analysis after considering multicollinearity of each parameter. As shown in Table 5, multivariate analysis showed that pre-pregnancy BMI (odds ratio [OR], 1.101; 90% confi- dence interval [CI], 1.028–1.180) and the fetal AC (OR, 1.218;
90% CI, 1.012–1.466) were the risk factors associated with the development of adverse outcome composed of shoulder dystocia, neonatal macrosomia, neonatal hypoglycemia, RDS, and admission to the NICU in term birth.
Discussion
Our study demonstrated that the median age of GDM pa- tients over recent 10 years has increased from 33 between 2006 and 2010 to 35 between 2011 and 2015. This trend obviously reflects our well-known national phenomenon of increased maternal age at childbearing in Korea. For example, mean maternal age was 30.4 years in 2006 and 32.2 years in
Table 5. Multivariate analysis of risk factors associated with adverse outcomes
Characteristics B Sig. Exp (B) 90% CI for EXP(B)
Lower Upper
BMI at pre-pregnancy 0.097 0.021 1.101 1.028 1.180
Fasting blood glucose in 100 g GTT 0.004 0.831 1.004 0.972 1.038
3 hours blood glucose in 100 g GTT −0.110 0.137 0.989 0.976 1.001
HbA1c at diagnosis 0.627 0.303 1.872 0.688 5.097
BPD (cm) −0.603 0.252 0.547 0.230 1.300
AC (cm) 0.197 0.081 1.218 1.012 1.466
FL (cm) 0.085 0.903 1.089 0.344 3.447
CI, confidence interval; BMI, body mass index; GTT, glucose tolerance test; BPD, biparietal diameter; AC, abdominal circumference; FL, femur length.