http://e-nrp.org
Analysis of consumption frequencies of vegetables and fruits in Korean adolescents based on Korea youth risk behavior web-based survey (2006, 2011)
Yangsuk Kim
*§, Yong-Suk Kwon
*, Young-Hee Park, Jeong-Sook Choe and Jin-Young Lee
National Academy of Agricultural Science, Rural Development Administration, 166 Nongsaengmyeong-ro, Iseomyeon, Wanju-gun, Jeonbuk 560-500, Korea
BACKGROUND/OBJECTIVES: This study analyzed factors affecting consumption frequencies of vegetables and fruits in Korean adolescents.
SUBJECTS/METHODS: Consumption frequencies of vegetables and fruits, general characteristics, meal, health, and other variables were analyzed for a total of 147,047 adolescents who participated in the KYRBWS (Korea Youth Risk Behavior Web-based Survey) conducted in 2006 and 2011 by the Korea Centers for Disease Control and Prevention.
RESULTS: Consumption frequencies of vegetables and fruits more than once a day significantly decreased in 2011 compared to 2006 based on Chi-square test conducted for every factor employed in the study. Analysis of factors showed that consumption frequencies of vegetables and fruits were reduced in both study years as subjective income decreased, whereas intake frequencies increased with mother’s education level and reduction of adolescent stress level.
CONCLUSIONS: In general, consumption frequencies of vegetables and fruits decreased in 2011 compared to those in 2006.
Thus, future research needs to improve dietary guidelines for nutrition education in order for students to recognize the importance of food consumption and necessity of increasing daily serving sizes of vegetables and fruits for their balanced consumption.
Nutrition Research and Practice 2015;9(4):411-419; doi:10.4162/nrp.2015.9.4.411; pISSN 1976-1457 eISSN 2005-6168
Keywords: Vegetable intake, fruit intake, KYRBWS, youth, adolescents
INTRODUCTION
*Adolescence is a transitional stage from childhood to adulthood characterized by dramatic physical, emotional, and intellectual developments as well as increased intake of various nutrients. As optimal development and growth have high nutritional requirements, a well-balanced and healthy diet is essential [1,2]. However, food consumption analyses have shown that intake of rice and fresh foods such as vegetables and fruits has dropped in Korean youths, whereas intake of processed and convenience foods as well as eating-out have increased [3]. A previous study showed that an irregular eating schedule combined with inappropriate food selection reduces intake of fiber and micronutrients such as iron, calcium, zinc, folic acid, and vitamins in youths [4-7]. In particular, the result of the 2007 (IV-1) KNHANES (Korea National Health and Nutrition Examination Survey) revealed that intake of vegetables comprised only 18% of the entire diet in young Koreans [5,8].
Vegetables and fruits contain micronutrients such as vitamins and minerals as well as phytochemicals, which help to relieve
stress and prevent cancer, obesity, and cardiovascular disease [1,5,9-12]. Moreover, the American Institute for Cancer Research endorses the '5 a Day for Better Health' program, which promotes eating five or more servings of vegetables and fruits daily (more than 80 g per serving for a total of 400 g) [13-15]. The nutritional section of the third national health promotion plan (2011-2020) administered by the Korean government proposes to increase the population that consumes more than 500 g of fruits and vegetables daily and emphasizes the importance of vegetable and fruit intake [16].
Studies have shown that consumption of vegetables and fruits is crucial in the growth of adolescents and can prevent stress related to the university entrance period or chronic diseases in adulthood [4,17,18]. Thus, this study examined intake of vegetables and fruits among Korean youths using data from the Korea Youth Risk Behavior Web-based Survey (2006, 2011), which represents the total youth population of Korea.
Socio-demographic factors affecting vegetable and fruit intake were identified in order to develop basic guidelines on dietary education.
This study was supported by the grant from the Cooperative Research Program for Agriculture Science & Technology Development (no. PJ01142701), Rural Development Administration, Republic of Korea.
§Corresponding Author: Yangsuk Kim, Tel. 82-63-238-3578, Fax. 82-63-238-3842, Email. [email protected] Received: April 1, 2014, Revised: February 14, 2015, Accepted: March 7, 2015
* These two authors contributed equally to this study.
This is an Open Access article distributed under the terms of the Creative Commons Attribution Non-Commercial License (http://creativecommons.org/licenses/by-nc/3.0/) which permits unrestricted non-commercial use, distribution, and reproduction in any medium, provided the original work is properly cited.
Variables n %1) n % n % n % n % n % n %
2006 (n = 71,404) 3/day 2/day 1/day 1 per 2-3 days 1 per 4-5 days 1 per 6-7 days seldom
Vegetables (excluding kimchi) 11,992 16.5 12,572 17.9 17,288 23.8 13,355 18.7 8,619 12.1 5,097 7.4 2,481 3.6 Fruits (excluding fruit juice) 2,150 3.2 5,920 9.1 13,433 19.9 22,115 30.8 12,385 16.7 9,307 12.2 6,094 8.0
2011 (n = 75,643) 3/day 2/day 1/day 5-6 per week 3-4 per week 1-2 per week seldom
Vegetables (excluding kimchi) 13,658 17.9 10,969 14.7 9,435 12.7 10,024 13.2 17,488 23.0 11,414 15.1 2,655 3.5 Fruits (excluding fruit juice) 2,323 3.2 4,218 5.9 8,121 11.2 7,875 10.7 22,203 29.2 24,028 30.8 6,875 9.0
1)Weighted percent
Table 1. Frequencies of vegetables and fruits consumption by survey year
SUBJECTS AND METHODS
This study analyzed raw data from the KYRBWS (Korea Youth Risk Behavior Web-based Survey) conducted by the Korea Centers for Disease Control and Prevention in 2006 and 2011.
The total number of subjects used in the study was 147,047 (2006: 71,404, 2011: 75,643).
Vegetable and fruit intake
This study used frequency of vegetable consumption (F_veg, excluding kimchi) and frequency of fruit consumption (F_fruit, excluding fruit juice) as variables for analyzing consumption of vegetables and fruits. As the items for surveying food consumption frequency were different between the surveys in 2006 and 2011, this study first examined the distribution chart (Table 1). The percentages of those who consumed vegetables three times a day were 16.5% in 2006 and 17.9% in 2011. The percentages of those who consumed fruits three times a day were also below 4% in both years. As this distribution was considered inadequate to analyze vegetable and fruit consumption based on three times a day, this study reclassified
‘1-3 times of food consumption per day’ into ‘Once or more a day (≥ 1/day)’ as in the study of Heo et al. [19]. From the 2006 survey, ‘Once in 6-7 days’, ‘Once in 4-5 days’, ‘Once in 2-3 days’, and ‘Not consumed at all in the past week’ were re-coded into ‘Less than once a day (< 1/day).’ From the 2011 survey, '1-2 times a week', '3-4 times a week', '5-6 times a week', and 'no intake in the past week' were all re-coded into ‘Less than once a day (< 1/day)’ variable [19].
General characteristics, meal, health, and other variables
Variables used as general characteristics of the subjects were gender, school level, residential area, subjective economic level/standard of living, and mother’s education level. The residential area was divided into ‘country (Gun area)’, ‘small and middle city’, and ‘large city’. The subjective economic level/standard of living was divided into ‘low income’, ‘middle income’, and ‘high income’ levels. Mother’s education level was re-coded into ‘middle school or lower’, ‘high school’, and
‘college or higher’. The meal variable used was frequency of breakfast (Variable name: F_BR). From the 2006 survey results, 'no breakfast in the past 7 days' was recoded into ‘less than once a week (< 1/week)’, and the remaining variables, i.e. ‘1-2 days a week’, ‘3-5 days a week’, and ‘6-7 days a week’, were used from the survey. From the 2011 survey results, ‘0 day’ was re-coded into ‘less than once a week (< 1/week)’; ‘1 day’ and
‘2 days’ into ‘1-2 days a week’; ‘3 days’, ‘4 days’, and ‘5 days’
into ‘3-5 days a week’; and ‘6 days’ and ‘7 days’ into ‘6-7 days a week’. Thus, recoding was performed the same as the categories used in the 2006 survey. Moreover, health-related and other variables included the presence or absence of nutrition education as well as subjective weight status. The presence or absence of nutrition education was divided into
‘yes’ for those who received education and ‘no’ for those who received no education. For measurement of stress level, questions used in preparing the raw data were used (Variable name: M_str, 1. feel it very much, 2. feel a lot, 3. feel a little, 4. do not feel much, 5. do not feel at all). Subjective weight status used for the analysis was divided into ‘underweight’,
‘average’, ‘overweight’, and ‘obesity’.
Data analysis
Multistage stratified cluster sampling method was used for the KYRBWS (Korea Youth Risk Behavior Web-based Survey) in which clustering, stratification, weight, and finite population correction (FPC) were taken into account for the collected data.
Thus, SUDAAN (Survey Data Analysis) Ver. 10.01 was used so that clustering, stratification, and weight were applicable for the total adolescent population of Korea using the obtained sample.
The general characteristics of the subjects as well as the frequencies of vegetable and fruit intake were examined using frequency analysis and expressed as frequency (n) and percentage (weighted %), after which chi-square (χ
2-test) was used to determine significance. The age was expressed as mean and standard error, after which t-test was used to determine significance. To identify factors affecting vegetable and fruit intake, logistic regression analysis was conducted separately on the data from 2006 and 2011 using the frequencies of vegetable and fruit intake as the dependent variables, which were recoded into ‘more than once a day intake’ as 1 point and ‘less than once a day intake’ as 0 points. The general characteristics of the subjects, their diet, and health-related factors were used as independent variables.
RESULTS
General characteristics of the subjects
The general characteristics of the subjects were gender,
school level, average age, residential area, subjective economic
level/standard of living, mother’s education level, nutrition
education, subjective weight status, and eating or not eating
breakfast (Table 2). Although there was no significant difference
in gender, there were slightly more boys (around 53%)
Variables 2006 (n = 71,404) 2011 (n = 75,643) P-value3)
n %1) n %
Gender
Boy 37,204 53.0 37,873 52.7 0.9996
Girl 34,200 47.0 37,770 47.3
Age 14.9 ± 0.12) 15.2 ± 0.1 0.04154)
School level
Middle school students 37,420 53.9 38,474 49.5 0.4939 High school students 33,984 46.1 37,169 50.5 Residential area
Country (gun area) 10,695 8.0 9,856 6.2 < 0.0001 Middle and small city 26,622 44.8 31,095 48.8
Large city 34,087 47.2 34,692 45.0
Subjective household income level
High 20,942 31.1 22,431 30.7 < 0.0001
Middle 33,870 47.0 35,762 46.8
Low 16,592 21.9 17,450 22.5
Mother's education level
Middle school or lower 7,949 10.8 3,790 5.3 < 0.0001
High school 36,973 59.1 34,594 53.4
College or higher 16,202 30.0 24,745 41.3 Nutrition education
Yes 38,838 54.4 47,761 63.5 < 0.0001
No 32,566 45.6 27,882 36.5
Subjective weight status
Underweight 20,945 29.7 21,382 29.0 < 0.0001
Normal 31,936 44.3 25,436 33.5
Overweight 14,193 20.1 24,642 32.3
Obesity 4,330 6.0 4,183 5.3
Stress level
Feel it very much 10,041 14.1 9,091 11.7 < 0.0001
Feel a lot 22,934 32.4 23,026 30.3
Feel a little 27,742 38.7 31,482 41.9
Do not feel much 9,107 12.6 10,436 14.0
Do not feel at all 1,579 2.3 1,608 2.2
Breakfast frequency
< 1/week 9,495 13.4 9,349 12.4 < 0.0001
1-2 per week 9,657 13.3 9,130 12.0
3-5 per week 13,873 19.4 17,082 22.4
6-7 per week 38,378 53.9 40,082 53.2
1)Weighted percent
2)Mean ± SE
3)P-value by chi-square test
4)P-value by t-test
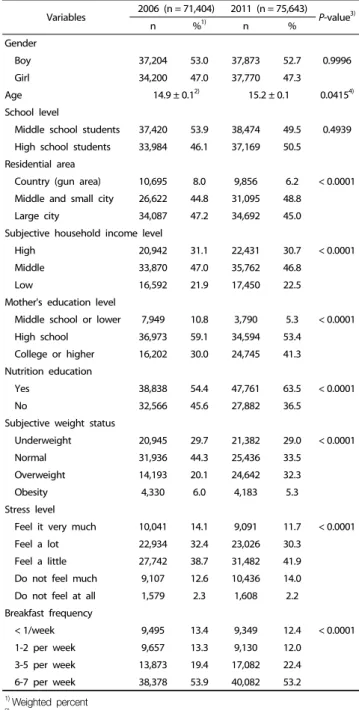
Table 2. General characteristics of study subjects (n = 147,047)
represented in the data from both 2006 and 2011. Regarding school level, the most numerous group was middle school students, which constituted greater than 50% of the 2006 data.
The average age in 2006 was 14.9, whereas that in 2011 was 15.2. On the other hand, more high school students (50.5%) than middle school students (49.5%) were observed in the 2011 data. Regarding residential area, the survey participants from the Gun (country) area constituted less than 10% in both survey years. The percentages of participants from small and middle cities were lower than that from large cities in 2006 but higher
in 2011 (P < 0.0001). Regarding subjective economic level/
standard of living, high income level was around 30% in both years, middle income level was around 47%, and low income level was between 20-25% (P < 0.0001). Regarding mother’s education level, high school was the most common (more than 50%) in both years (P < 0.0001). Regarding the presence or absence of nutrition education, the percentages of participants who received education were higher than 50% in both 2006 and 2011, and this percentage was approximately 10% higher in 2011 (63.5%) than in 2006 (54.4%). In terms of stress level, both in 2006 and 2011, groups that identified their stress levels as 'feel it a little, (38.7% in 2006 and 41.9% in 2011) and 'feel it a lot' (32.4% in 2006 and 30.3% in 2011) constituted the highest proportions at above 30%. Regarding subjective weight status, the percentage of the normal group was 44.3% in 2006 but dropped by about 11% to 33.5% in 2011, whereas that of the overweight group was 20.1% in 2006 and then increased by approximately 12% to 32.3% in 2011 (P < 0.0001). Regarding consumption frequency of breakfast, about 53% of respondents answered that they ate breakfast six to seven times a week in both study years while the rate of respondents that answered eating breakfast three to five times a week increased 3% from 19.4% in 2006 to 22.4% in 2011.
Frequencies of vegetable and fruit intake based on general characteristics, diet, and health-related factors
Vegetable intake frequency
The analysis of vegetable intake frequency based on general characteristics, diet, and health-related factors are shown in Table 3. Overall, the frequency of eating vegetable side dishes
‘more than once a day’ dropped significantly from 58.2% in 2006 to 45.2% in 2011 (P < 0.0001). Significance determined based on specific factors, including gender, school level, residential area, subjective economic level/standard of living, mother’s education level, presence or absence of nutrition education, stress level, subjective weight status, and frequency of breakfast intake, indicated that the frequency of vegetable intake ‘more than once a day’ was reduced significantly in 2011 compared to 2006 (P < 0.0001).
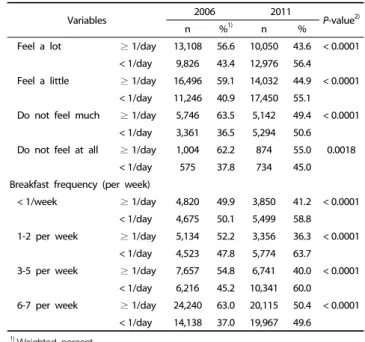
Fruit intake frequency
Table 4 shows the analysis of fruit intake frequency based on general characteristics, diet, and health-related factors.
Overall, intake of fruits ‘less than once a day’ was higher than 65% in both years, whereas ‘more than once a day’ intake was 32.3% in 2006 but dropped significantly to 20.3% in 2011 (P
< 0.0001). Regarding specific factors, including gender, school level, residential area, subjective economic level/standard of living, mother’s education level, presence or absence of nutrition education, stress level, subjective weight status, and frequency of breakfast intake, the frequency of fruit intake
‘more than once a day’ was significantly lower in 2011 compared to 2006 (P < 0.0001).
Vegetable and fruit intake-related factors in youths
To examine factors related to vegetable and fruit intake in
youths, logistic regression analysis was conducted on intake of
Variables 2006 2011
P-value2)
n %1) n %
Total
≥ 1/day3) 41,852 58.2 34,062 45.2 < 0.0001
< 1/day 29,552 41.8 41,581 54.8 Gender
Boy ≥ 1/day 22,564 60.3 17,110 45.5 < 0.0001
< 1/day 14,640 39.7 20,763 54.5 Girl ≥ 1/day 19,288 55.9 16,952 44.9 < 0.0001
< 1/day 14,912 44.1 20,818 55.1 School level
Middle school
students ≥ 1/day 22,104 58.6 17,170 44.8 < 0.0001
< 1/day 15,316 41.4 21,304 55.2 High school
students ≥ 1/day 19,748 57.7 16,892 45.6 < 0.0001
< 1/day 14,236 42.3 20,277 54.4 Residential area
Country (gun area) ≥ 1/day 6,432 60.4 4,408 44.6 < 0.0001
< 1/day 4,263 39.6 5,448 55.4 Middle and small city ≥ 1/day 15,762 58.8 13,915 45.0 < 0.0001
< 1/day 10,860 41.2 17,180 55.0 Large city ≥ 1/day 19,658 57.3 15,739 45.5 < 0.0001
< 1/day 14,429 42.7 18,953 54.5 Subjective household income level
High ≥ 1/day 12,954 61.6 11,054 49.4 < 0.0001
< 1/day 7,988 38.4 11,377 50.6 Middle ≥ 1/day 19,663 57.6 15,583 43.8 < 0.0001
< 1/day 14,207 42.4 20,179 56.2
Low ≥ 1/day 9,235 54.7 7,425 42.4 < 0.0001
< 1/day 7,357 45.3 10,025 57.6 Mother's education level
Middle shool or lower ≥ 1/day 4,601 56.8 1,652 42.6 < 0.0001
< 1/day 3,348 43.2 2,138 57.4 High school ≥ 1/day 21,669 58.3 15,426 44.6 < 0.0001
< 1/day 15,304 41.7 19,168 55.4 College or higher ≥ 1/day 9,924 60.9 12,134 49.2 < 0.0001
< 1/day 6,278 39.1 12,611 50.8 Nutrition education
Yes ≥ 1/day 21,934 56.0 20,879 43.9 < 0.0001
< 1/day 16,904 44.0 26,882 56.1
No ≥ 1/day 19,918 60.9 13,183 47.5 < 0.0001
< 1/day 12,648 39.1 14,699 52.5 Subjective weight status
Under weight ≥ 1/day 11,859 56.0 9,203 43.2 < 0.0001
< 1/day 9,086 44.0 12,179 56.8 Normal ≥ 1/day 18,812 58.7 11,587 45.8 < 0.0001
< 1/day 13,124 41.3 13,849 54.2 Over weight ≥ 1/day 8,532 59.6 11,330 46.3 < 0.0001
< 1/day 5,661 40.4 13,312 53.7 Obesity ≥ 1/day 2,649 61.2 1,942 45.8 < 0.0001
< 1/day 1,681 38.8 2,241 54.2 Stress level
Feel it very much ≥ 1/day 5,497 54.1 3,964 43.8 < 0.0001
< 1/day 4,544 45.9 5,127 56.2
Table 3. Consumption frequency of vegetables according to survey year by each variable
Variables 2006 2011
P-value2)
n %1) n %
Feel a lot ≥ 1/day 13,108 56.6 10,050 43.6 < 0.0001
< 1/day 9,826 43.4 12,976 56.4 Feel a little ≥ 1/day 16,496 59.1 14,032 44.9 < 0.0001
< 1/day 11,246 40.9 17,450 55.1 Do not feel much ≥ 1/day 5,746 63.5 5,142 49.4 < 0.0001
< 1/day 3,361 36.5 5,294 50.6 Do not feel at all ≥ 1/day 1,004 62.2 874 55.0 0.0018
< 1/day 575 37.8 734 45.0 Breakfast frequency (per week)
< 1/week ≥ 1/day 4,820 49.9 3,850 41.2 < 0.0001
< 1/day 4,675 50.1 5,499 58.8 1-2 per week ≥ 1/day 5,134 52.2 3,356 36.3 < 0.0001
< 1/day 4,523 47.8 5,774 63.7 3-5 per week ≥ 1/day 7,657 54.8 6,741 40.0 < 0.0001
< 1/day 6,216 45.2 10,341 60.0 6-7 per week ≥ 1/day 24,240 63.0 20,115 50.4 < 0.0001
< 1/day 14,138 37.0 19,967 49.6
1)Weighted percent
2)P-value by chi-square test
3)Consumption frequency of vegetables Table 3. continued
Variables 2006 2011
P-value2)
n %1) n %
Total
≥ 1/day3) 21,503 32.3 14,662 20.3 < 0.0001
< 1/day 49,901 67.7 60,981 79.7 Gender
Boy ≥ 1/day 10,813 31.0 7,014 19.2 < 0.0001
< 1/day 26,391 69.0 30,856 80.8 Girl ≥ 1/day 10,690 33.8 7,645 21.5 < 0.0001
< 1/day 23,510 66.2 30,125 78.5 School level
Middle school
students ≥ 1/day 13,298 37.4 8,713 23.7 < 0.0001
< 1/day 24,122 62.6 29,761 76.3 High school
students ≥ 1/day 8,205 26.3 5,949 17.0 < 0.0001
< 1/day 25,779 73.7 31,220 83.0 Residential area
Country (gun area) ≥ 1/day 2,580 25.4 1,405 14.2 < 0.0001
< 1/day 8,115 74.6 8,451 85.8 Middle and small city ≥ 1/day 8,084 32.7 5,975 20.3 < 0.0001
< 1/day 18,538 67.3 25,120 79.7 Large city ≥ 1/day 10,839 33.1 7,282 21.2 < 0.0001
< 1/day 23,248 66.9 27,410 78.8 Subjective household income level
High ≥ 1/day 8,581 43.2 6,189 28.6 < 0.0001
< 1/day 12,361 56.8 16,242 71.4 Middle ≥ 1/day 9,735 30.6 6,241 18.3 < 0.0001
< 1/day 24,135 69.4 29,521 81.7
Low ≥ 1/day 3,187 20.4 2,232 13.1 < 0.0001
< 1/day 13,405 79.6 15,218 86.9 Table 4. Consumption frequency of fruits according to survey year by each variable
Variables 2006 2011
P-value2)
n %1) n %
Mother's education level
Middle school or less ≥ 1/day 1,720 22.7 483 13.4 < 0.0001
< 1/day 6,229 77.3 3,307 86.6 High school ≥ 1/day 10,547 29.7 5,794 17.4 < 0.0001
< 1/day 26,426 70.3 28,800 82.6 College or higher ≥ 1/day 6,564 43.3 6,527 27.2 < 0.0001
< 1/day 9,638 56.7 18,218 72.8 Nutrition education
Yes ≥ 1/day 10,699 29.7 8,677 19.1 < 0.0001
< 1/day 28,139 70.3 39,084 80.9
No ≥ 1/day 10,804 35.4 5,985 22.4 < 0.0001
< 1/day 21,762 64.6 21,897 77.6 Subjective weight status
Under weight ≥ 1/day 6,486 32.5 4,498 22.1 < 0.0001
< 1/day 14,459 67.5 16,884 77.9 Normal ≥ 1/day 9,946 33.7 5,112 21.1 < 0.0001
< 1/day 21,990 66.3 20,324 78.9 Over weight ≥ 1/day 3,919 29.9 4,418 18.7 < 0.0001
< 1/day 10,274 70.1 20,224 81.3 Obesity ≥ 1/day 1,152 29.2 634 15.5 < 0.0001
< 1/day 3,178 70.8 3,549 84.5 Stress level
Feel it very much ≥ 1/day 2,732 28.5 1,685 19.4 < 0.0001
< 1/day 7,309 71.5 7,406 80.6
Feel a lot ≥ 1/day 6,403 30.5 4,083 18.8 < 0.0001
< 1/day 16,531 69.5 18,943 81.2
Feel a little ≥ 1/day 8,509 32.9 6,059 20.1 < 0.0001
< 1/day 19,233 67.1 25,423 79.9
Do not feel much ≥ 1/day 3,168 36.6 2,310 22.9 < 0.0001
< 1/day 5,939 63.4 8,126 77.1
Do not feel at all ≥ 1/day 690 47.0 525 33.6 < 0.0001
< 1/day 889 53.0 1,083 66.4 Breakfast (per week)
< 1/week ≥ 1/day 2,086 23.7 1,382 15.0 < 0.0001
< 1/day 7,409 76.3 7,967 85.0 1-2 per week ≥ 1/day 2,533 27.8 1,251 14.1 < 0.0001
< 1/day 7,124 72.2 7,879 85.9 3-5 per week ≥ 1/day 3,693 28.3 2,780 17.0 < 0.0001
< 1/day 10,180 71.7 14,302 83.0 6-7 per week ≥ 1/day 13,191 37.0 9,249 24.3 < 0.0001
< 1/day 25,187 63.0 30,833 75.7
1)Weighted percent
2)P-value by chi-square test
3)Consumption frequencies of fruits Table 4. continued
Variables 2006 2011
Gender (ref. = Boy)
Girl 0.823 (0.787-0.860)***1) 0.968 (0.932-1.005)
Age 1.013 (0.988-1.038) 1.026 (1.015-1.038)***
School level (ref. = Middle school students)
High school students 1.057 (1.006-1.112)* 1.078 (1.034-1.124)***
Residential area (ref. = Country (gun area))
Middle and small city 0.897 (0.833-0.967)** 0.958 (0.891-1.030) Large city 0.851 (0.792-0.914)*** 0.964 (0.898-1.035) Subjective household income (ref. = High)
Middle 0.882 (0.838-0.927)*** 0.851 (0.816-0.888)***
Low 0.819 (0.767-0.875)*** 0.835 (0.795-0.878)***
Mother's education level (ref. = Middle school or lower)
High School 1.021 (0.950-1.097) 1.065 (0.982-1.155) College or higher 1.067 (0.983-1.159) 1.191 (1.091-1.300)***
Nutrition education (ref. = Yes)
No 1.212 (1.160-1.267)*** 1.154 (1.107-1.203)***
Subjective weight status (ref. = Normal)
Underweight 0.894 (0.850-0.940)*** 0.899 (0.863-0.936)***
Over weight 1.037 (0.986-1.091) 1.018 (0.980-1.057) Obesity 1.109 (1.017-1.208)* 0.998 (0.930-1.071) Stress level (ref. = Feel it very much)
Feel a lot 1.098 (1.035-1.165)*** 0.998 (0.945-1.054) Feel a little 1.217 (1.146-1.293)*** 1.056 (1.002-1.114)***
Do not feel much 1.468 (1.361-1.584)*** 1.280 (1.203-1.363)***
Do not feel at all 1.400 (1.186-1.653)*** 1.599 (1.416-1.807)***
Breakfast frequency (per week) (ref. =< 1/week)
1-2 per week 1.039 (0.953-1.133) 0.823 (0.766-0.883)***
3-5 per week 1.194 (1.088-1.310)*** 0.931 (0.876-0.990)*
6-7 per week 1.617 (1.501-1.742)*** 1.401 (1.326-1.481)***
*P< 0.05, **P< 0.01, ***P< 0.001
1)Odds ratio (95% Confidence Interval)
Table 5. Factors related to vegetable consumption in adolescents
vegetables and fruits ‘more than once a day’ as dependent variables along with general characteristics, diet, and health- related factors as independent variables according to each year.
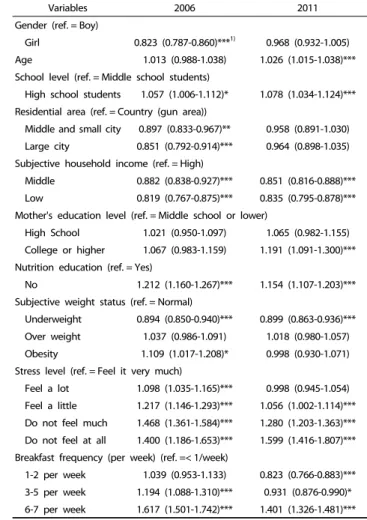
Vegetable intake-related factors
Table 5 shows the analysis of vegetable intake-related factors in youths. From the 2006 survey, all factors related to vegetable intake ‘more than once a day’, excluding mother’s education
level, showed significant effects. The frequency of vegetable intake ‘more than once a day’ was 17.7% (OR = 0.823) lower in female youths than male youths, whereas it was about 1.1 times (OR = 1.057) higher in high school students than middle school students. Regarding residential area, frequencies of vegetable intake ‘more than once a day’ were lower in students residing in small and middle city (10.3%, OR = 0.897) as well as large city (14.9%, OR = 0.851) compared to those living in
Gun (country) areas. Regarding subjective economic level/standard of living, frequencies of vegetable intake ‘more than once a day’ were 11.8% lower at the middle income level (OR
= 0.882) and 18.1% lower at the low income level (OR = 0.819)
compared to the high income level. Regarding vegetable intake
based on the presence or absence of nutrition education,
frequency of vegetable intake ‘more than once a day’ was 1.2
times (OR = 1.212) higher in participants who received no
education compared to those who received education. In terms
of stress level, the group receiving no stress showed a higher
frequency of vegetable intake ‘more than once a day’ compared
to the group under severe stress. Correlation between subjective
weight status and vegetable intake showed that the frequency
of vegetable intake ‘more than once a day’ was 10.6% (OR =
Variables 2006 2011 Gender (ref. = Boy)
Girl 1.197 (1.131-1.267)***1) 1.227 (1.167-1.291)***
Age 0.871 (0.854-0.889)*** 0.903 (0.886-0.920)***
School level (ref. = Middle school students)
High school students 0.705 (0.661-0.753)*** 0.742 (0.697-0.790)***
Residential area (ref. = Country (gun area))
Middle and small city 1.302 (1.190-1.423)*** 1.382 (1.249-1.529)***
Large city 1.342 (1.232-1.462)*** 1.402 (1.269-1.548)***
Subjective household income level (ref. = High)
Middle 0.651 (0.618-0.686)*** 0.639 (0.607-0.673)***
Low 0.424 (0.393-0.457)*** 0.492 (0.460-0.525)***
Mother's education level (ref. = Middle school or lower)
High School 1.168 (1.075-1.268)*** 1.168 (1.032-1.321)*
College or higher 1.740 (1.574-1.923)*** 1.691 (1.496-1.911)***
Nutrition education (ref. = Yes)
No 1.072 (1.024-1.124)** 1.073 (1.023-1.126)**
Subjective weight status (ref. = Normal)
Underweight 0.947 (0.901-0.995)* 1.061 (1.009-1.117)*
Over weight 0.840 (0.791-0.892)*** 0.865 (0.826-0.906)***
Obesity 0.811 (0.728-0.903)*** 0.688 (0.622-0.762)***
Stress level (ref. = Feel it very much)
Feel a lot 1.090 (1.011-1.175)* 0.945 (0.884-1.010) Feel a little 1.180 (1.101-1.265)*** 1.016 (0.948-1.089) Do not feel much 1.328 (1.229-1.436)*** 1.164 (1.077-1.258)***
Do not feel at all 2,031 (1.723-2.394)*** 1.939 (1.690-2.225)***
Breakfast frequency (per week) (ref. =< 1/week)
1-2 per week 1.149 (1.023-1.291)* 0.941 (0.852-1.039) 3-5 per week 1.150 (1.028-1.287)* 1.079 (0.992-1.174) 6-7 per week 1.620 (1.475-1.781)*** 1.565 (1.449-1.690)***
*P< 0.05, **P< 0.01, ***P< 0.001
1)Odds ratio (95% Confidence Interval)
Table 6. Factors related to frequency of fruit consumption in adolescents
0.894) lower in the underweight awareness group and 1.1 times (OR = 1.109) higher in the obese awareness group compared to the normal awareness group. Finally, as the frequency of eating breakfast increased, the frequency of vegetable intake
‘more than once a day’ also increased compared to eating breakfast ‘less than once a week’. The frequency of vegetable intake ‘more than once a day’ was 1.2 times (OR = 1.194) higher than those who ate breakfast ‘3-5 times a week’ and 1.6 times (OR = 1.617) higher than those who ate breakfast ‘6-7 times a week’.
Analysis of factors related to vegetable intake ‘more than once a day’ from the 2011 survey showed that all factors were significantly correlated, excluding gender and residential area. As age increased by 1 year, intake of vegetables ‘more than once a day’ also increased as much as 1.03 times (OR = 1.026). The frequency of vegetable intake ‘more than once a day’ was 1.1 times (OR = 1.078) higher in high school students compared to middle school students. Regarding subjective economic level/standard of living, frequency of vegetable intake ‘more than once a day’ was 14.9% (OR = 0.851) lower at the middle income level and 16.5% (OR = 0.835) lower at the low income level compared to the high income level. Based on mother’s education level, frequency of vegetable intake ‘more than once a day’ was 1.2 times (OR = 1.191) higher in the college group compared to the middle school or lower education group. The frequency of vegetable intake ‘more than once a day’ was 1.2 times (OR = 1.151) higher in the group that received no education compared to those who received education. In terms of stress level, as in 2006, the group receiving no stress showed a higher frequency of vegetable intake ‘more than once a day’
compared to the group under severe stress. Regarding subjective weight status, the frequency of vegetable intake
‘more than once a day’ was 10.1% (OR = 0.899) lower in the underweight awareness group compared to the normal aware- ness group. Regarding frequency of eating breakfast, unlike the results of the 2006 survey, the frequency of vegetable intake
‘more than once a day’ was 17.7% (OR = 0.823) lower in the
‘1-2 times a week’ group and 6.9% (OR = 0.931) lower in the
‘3-5 times a week’ group compared to the ‘less than once a week’ group. On the other hand, the frequency of vegetable intake ‘more than once a day’ was 1.4 times (OR = 1.401) higher in the ‘6-7 times a week’ group compared to the ‘less than one time’ group.
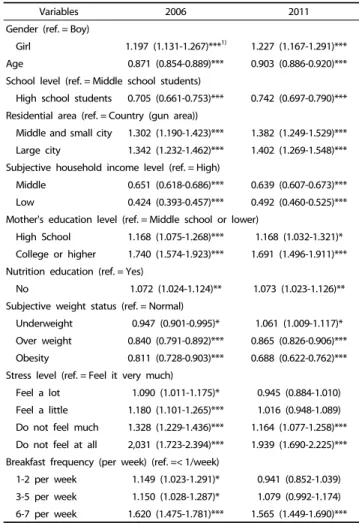
Fruit intake-related factors
Table 6 shows the analysis of fruit intake-related factors in youths. From the 2006 survey, the frequency of fruit intake
‘more than once a day’ showed a significant correlation with all factors. Unlike vegetable intake, the frequency of fruit intake
‘more than once a day’ was 1.2 times (OR = 1.197) higher in girls than in boys as well as 29.5% (OR = 0.705) lower in high school students than in middle school students. As age number increased by 1 year, fruit intake ‘more than once a day’
decreased by 12.9%. Frequencies of fruit intake ‘more than once a day’ were about 1.3 times higher in small and middle cities (OR = 1.302) as well as large cities (OR = 1.342) compared to those in the Gun (country) area. Regarding differences accor- ding to subjective economic level/standard of living, the
frequency of fruit intake ‘more than once a day’ was 34.9% (OR
= 0.651) lower in youths at the middle income level and 57.6%
(OR = 0.424) lower in those at the low income level compared to those at the high income level. Regarding the mother’s education level, the frequency of fruit intake ‘more than once a day’ was 1.2 times (OR = 1.168) higher in youths whose mothers had a high school education as well as 1.7 times (OR
= 1.740) higher in youths whose mothers had a college or higher compared to those whose mothers had a middle school or lower. The frequency of fruit intake ‘more than once a day’
in youths was 1.1 times (OR = 1.072) higher in those who received no education compared to those who received nutrition education. In terms of stress level, the group under severe stress showed a higher frequency of fruit intake ‘more than once a day’ compared to the group under no stress.
Regarding subjective weight status, the frequency of fruit intake
‘more than once a day’ was 5.3% (OR = 0.947) lower in the
underweight awareness group, 16% (OR = 0.840) lower in the
overweight awareness group, and 18.9% (OR = 0.811) lower in
the obese awareness group compared to youths in the normal
awareness group. Regarding frequency of eating breakfast, the
frequency of fruit intake ‘more than once a day’ was 1.1 times
(OR = 1.149) higher in the group who ate breakfast ‘1-2 times a week’, 1.2 times (OR = 1.150) higher in the group who ate breakfast ‘3-5 times a week’, and 1.6 times (OR = 1.620) higher in the group who ate breakfast ‘6-7 times a week’ compared to the group who ate breakfast ‘less than once a week’.
From the 2011 survey, analysis of factors related to fruit intake
‘more than once a day’ in youths showed similar results as the 2006 survey. All factors were significantly correlated. As age increased by 1 year, fruit intake ‘more than once a day’
decreased by 9.7%. The frequency of fruit intake ‘more than once a day’ was 1.2 times (OR = 1.227) higher in female students compared to male students as well as 25.8% (OR = 0.742) lower in high school students compared to middle school students.
According to subjective economic level/standard of living, the frequency of fruit intake ‘more than once a day’ in youths was 36.1% (OR = 0.639) lower in those at the middle income level and 51.8% (OR = 0.492) lower in those at the low income level compared to those at the high income level. According to mother’s education level, the frequency of fruit intake ‘more than once a day’ was 1.2 times (OR = 1.168) higher in those whose mothers had a high school education and 1.7 times (OR
= 1.691) higher in those whose mothers had a college education or higher compared to those whose mothers had a middle school education or lower. The frequency of fruit intake ‘more than once a day’ in youths was 1.1 times (OR =
1.073) higher in the group that did not receive nutrition education compared to the group that received nutrition education. In terms of stress level, as in 2006, the group under no stress showed a higher frequency of fruit intake ‘more than once a day’ compared to the group under severe stress. Accor- ding to subjective weight status, the frequency of fruit intake
‘more than once a day’ was 1.1 times (OR = 1.061) higher in the underweight awareness group, 13.5% (OR = 0.865) lower in the overweight awareness group, and 31.2% (OR = 0.688) lower in the obese awareness group compared to the normal awareness group. Finally, frequency of fruit intake ‘more than once a day’ according to frequency of eating breakfast was 1.6 times (OR = 1.565) higher in those who ate breakfast ‘6-7 times a week’ compared to those who ate breakfast ‘less than once a week’.
DISCUSSION
This study compared and analyzed consumption frequencies of vegetables and fruits, general characteristics, diet, and health-related factors in 147,047 youths who participated in the KYRBWS (Korea Youth Risk Behavior Web-based Survey) in 2006 and 2011. When frequencies of vegetable and fruit intake according to general characteristics, diet, and health-related factors were analyzed, all survey participants, gender, school level, residential area, subjective economic level/standard of living, mother’s education level, presence or absence of nutrition education, subjective weight status, and frequency of breakfast intake, the frequencies were significantly reduced in 2011 compared to 2006. Reductions in consumption frequencies of vegetables and fruits corroborate the results of a previous study by Lee et al. [3] on food consumption in Korean youths, which found that consumption of fresh foods, including
vegetables, fish and seafood, and fruits, decreased while consumption of processed and convenience foods as well as eating out increased in Korean youths. Furthermore, according to the 2007 KNHANES (Korea National Health and Nutrition Examination Survey), which was conducted within a similar time frame as the above study, the average daily vegetable intake of the 12-18 year age group was 222.7 g but decreased by 14.7 g over the past 4 years [20]. According to the 2011 KNHANES, the average daily vegetable intake was 207.4 g in the 10-18 year age group [21]. Regarding fruit intake, the 2007 KNHANES data showed that the average fruit daily intake was 138.4 g but decreased by approximately 4 g to 135.5 g in 2011 [8,20,21]. Based on results of previous studies, the reduced intake of vegetables and fruits did not directly affect reduction of intake frequency, whereas reduction of intake amount was somewhat correlated with reduction of intake frequency.
Among previous studies that have examined the importance of adequate intake of vegetables and fruits, a report from Europe demonstrated a close correlation between cancer prevention and vegetable or fruit intake as well as a negative correlation between sufficient vegetable and fruit intake, inflammatory index, and oxidative stress in youths between 13-17 years of age [22,23]. In another study, sufficient vegetable and fruit intake was shown to boost resistance against diseases and prevent obesity. Furthermore, it was reported that adequate vegetable and fruit intake plays a vital role in boosting perseverance and emotional stability as well as relieving various forms of stress [1,9,12]. Particularly in Korean youths, increased intake of high-fat and high-sugar snacks resulting from emo- tional instability due to stress from the university entrance period, lack of sleep, an unbalanced diet, and irregular eating was shown to increase health problems, including increased incidence of obesity and various diseases [4,17,24]. Increased vegetable and fruit intake in youths will resolve not only health problems caused by a bad diet but also problems caused by stress. Moreover, more than 500 g of daily intake of vegetables and fruits is recommended for nutrition management, preven- tion of chronic diseases, and promotion of a balanced diet in Koreans [16]. However, as mentioned earlier, in the 2011 KNHANES, average daily vegetable and fruit intake was 342.9 g (vegetables: 207.4 g, fruits: 135.5 g) in youths between 10-18 years of age, which lags behind the recommended amount of 500 g likely due to snack intake as explained in a previous study [21]. Based on the above results, menus favorable to adole- scents containing vegetables and fruits need to be developed to increase intake of vegetables and fruits.
To identify factors affecting vegetable and fruit intake, logistic
regression analysis was conducted separately on the data from
2006 and 2011 based on consumption frequencies of vegetables
and fruits as the dependent variables. The general chara-
cteristics, diets, and health-related factors of the subjects were
used as the independent variables. For vegetable and fruit
intake-related factors from the 2006 and 2011 survey data, as
the subjective economic level/standard of living decreased,
intakes were reduced in the group that received nutrition
education compared to the group that did not. On the other
hand, vegetable and fruit intake increased with higher
frequency of eating breakfast as well as mother’s education
level. Environmental factors, including household socioe- conomic level, education level of subject’s parents, and family structure, along with individual factors such as gender and age are known to affect diet in youths [25-29]. Furthermore, as income and education levels increase in adult women, consu- mption frequencies of vegetables and fruits increase [30-33].
Another study on vegetable and fruit intake in adults over 30 years of age showed that the ratio of subjects meeting daily intake volumes (more than 400 g) recommended by the World Cancer Research Fund (WCRF) increases as education and household income levels increase [14]. Thus, mother’s educa- tion level and household income level both affect vegetable and fruit intake in Korean youths. Accordingly, national policies need to be developed to improve nutrition in low-income youths through school foodservice.
Regarding the presence or absence of nutrition education, a study by Lee & Kim [34] found that nutrition education has a positive effect on vegetable intake when offered to elemen- tary school students; however, the results of this study showed a decrease in vegetable intake. This discrepancy is due to the fact that the study by Lee & Kim evaluated changes in vegetable intake after offering education in a selected some group of subjects, whereas the data in this study were from the KYRBWS, which simply surveyed subjects on nutrition education items.
Overall, the frequency of vegetable and fruit intake in subjects was lower in 2011 compared to 2006. Therefore, policies to increase intake of vegetables and fruits should be developed.
Particularly, sufficient vegetable and fruit intake would help relieve various forms of stress in youths, and anti-oxidative nutrients from various vitamins and minerals would protect cells from oxidative damage [1,4,9,17,18,24]. Furthermore, a previous study showed that as vegetable and fruit intake increases, risk of cardiovascular disease decreases [12]. Another study by the European Prospective Investigation into Cancer and Nutrition (EPIC) reported that diabetics with high intake of vegetables and fruits show lower mortality caused by cardiovascular disease [14,35]. Thus, we believe that vegetable and fruit intake needs to be increased.
As this study is a survey using items surveying the frequency of vegetable and fruit consumption in the KYRBWS, it could not estimate the actual amount of vegetable and fruit consumption. However, intake frequencies were reduced in 2011 compared to those in 2006. Thus, future research needs to improve dietary guidelines for nutrition education that may lead students to recognize the importance of food consumption and the necessity of increasing daily serving size of vegetables and fruits.
REFERENCES
1. Kim SH, Cho SW, Hwang SS, Ahn M, Lee D, Kang SW, Park YK.
Increased whole grain, fruits and vegetable intake reduced oxidative stress in high school students. Korean J Nutr 2012;45:452-61.
2. Kim GR, Kim MJ. A survey on the dietary behavior of high school students: about regularity of meal and number of meal per day.
J Korean Soc Food Sci Nutr 2011;40:183-95.
3. Lee KY, Joo HJ, Ishikawa K, Lee YS, Cheon HJ. Comparison of food consumption trends of juveniles in Korea, China, and Japan. Rural
Econ Rev 2009;32:1-19.
4. Kim KW, Shin EM. A study on nutrition knowledge, nutritional attitudes, dietary behavior and dietary intake by weight control attempt among middle school female students. Korean J Comm- unity Nutr 2002;7:23-31.
5. Hong JH, Cho MS. Acceptance of vegetable menus of a school lunch program by high school students in Seoul and its association with health and dietary behavioral factors. Korean J Food Sci Technol 2012;44:121-34.
6. Son Y, Kim HJ. A study on the eating habits, nutrition and dietary fiber intakes of teenagers in Gyeong-Nam areas. J Korean Home Econ Educ Assoc 2005;17:1-26.
7. Cho HS, Kim MH, Choi MK. A study on vegetable intakes and dietary habits of middle school students in Chungnam. Korean J Comm- unity Nutr 2010;15:525-35.
8. Ministry of Health and Welfare (KR). Dietary guideline for Korean [Internet]. Seoul: Ministry of Health and Welfare; 2013 [cited 2013 September 16]. Available from: http://www.mohw.go.kr.
9. Johnson F, Wardle J, Griffith J. The adolescent food habits checklist:
reliability and validity of a measure of healthy eating behaviour in adolescents. Eur J Clin Nutr 2002;56:644-9.
10. American Dietetic Association; Dietitians of Canada. Position of the American Dietetic Association and Dietitians of Canada: vegetarian diets. J Am Diet Assoc 2003;103:748-65.
11. Ibiebele TI, van der Pols JC, Hughes MC, Marks GC, Williams GM, Green AC. Dietary pattern in association with squamous cell carcinoma of the skin: a prospective study. Am J Clin Nutr 2007;85:1401-8.
12. Hung HC, Joshipura KJ, Jiang R, Hu FB, Hunter D, Smith-Warner SA, Colditz GA, Rosner B, Spiegelman D, Willett WC. Fruit and vegetable intake and risk of major chronic disease. J Natl Cancer Inst 2004;96:1577-84.
13. Melnik TA, Rhoades SJ, Wales KR, Cowell C, Wolfe WS. Food consumption patterns of elementary schoolchildren in New York City. J Am Diet Assoc 1998;98:159-64.
14. Kwon JH, Shim JE, Park MK, Paik HY. Evaluation of fruits and vegetables intake for prevention of chronic disease in Korean adults aged 30 years and over: using the Third Korea National Health and Nutrition Examination Survey (KNHANES III), 2005. Korean J Nutr 2009;42:146-57.
15. World Cancer Research Fund; American Institute for Cancer Research.
Summary: Food, Nutrition, Physical Activity, and the Prevention of Cancer. A Global Perspective. Washington, D.C.: American Institute for Cancer Research; 2007. p.9.
16. Ministry of Health and Welfare (KR). The Third National Health Promotion Plan (2011-2020) in Korea. Seoul: Korea Institute for Health and Social Affairs; 2011.
17. Kwon WJ, Chang KJ, Kim SK. Comparison of nutrient intake, dietary behavior, perception of body image and iron nutritional status among female high school students of urban and rural areas in Kyunggi-do. Korean J Nutr 2002;35:90-101.
18. Lee KE, Hong WS, Kim MH. Students' food preferences on vegetarian menus served at middle and high schools. J Korean Diet Assoc 2005;11:320-30.
19. Heo GJ, Nam SY, Lee SK, Chung SJ, Yoon JH. The relationship between high energy/low nutrient food consumption and obesity among Korean children and adolescents. Korean J Community Nutr 2012;17:226-42.
20. Ministry of Health and Welfare, Korea Centers for Disease Control
and Prevention. Korea Health Statistics 2007: Korea National Health and Nutrition Examination Survey (KNHANES IV-1) [Internet].
Cheongwon; Korea Centers for Disease Control and Prevention;
2008 [cited 2013 October 31]. Available from: http://knhanes.cdc.
go.kr.
21. Ministry of Health and Welfare, Korea Centers for Disease Control and Prevention. Korea Health Statistics 2011: Korea National Health and Nutrition Examination Survey (KNHANES V-2) [Internet]. Cheong- won; Korea Centers for Disease Control and Prevention; 2012 [cited 2013 October 31]. Available from: http://knhanes.cdc.go.kr.
22. Büchner FL, Bueno-de-Mesquita HB, Ros MM, Overvad K, Dahm CC, Hansen L, Tjønneland A, Clavel-Chapelon F, Boutron-Ruault MC, Touillaud M, Kaaks R, Rohrmann S, Boeing H, Nöthlings U, Trichopoulou A, Zylis D, Dilis V, Palli D, Sieri S, Vineis P, Tumino R, Panico S, Peeters PH, van Gils CH, Lund E, Gram IT, Braaten T, Sánchez MJ, Agudo A, Larrañaga N, Ardanaz E, Navarro C, Argüelles MV, Manjer J, Wirfält E, Hallmans G, Rasmuson T, Key TJ, Khaw KT, Wareham N, Slimani N, Vergnaud AC, Xun WW, Kiemeney LA, Riboli E. Variety in fruit and vegetable consumption and the risk of lung cancer in the European prospective investigation into cancer and nutrition. Cancer Epidemiol Biomarkers Prev 2010;19:2278-86.
23. Holt EM, Steffen LM, Moran A, Basu S, Steinberger J, Ross JA, Hong CP, Sinaiko AR. Fruit and vegetable consumption and its relation to markers of inflammation and oxidative stress in adolescents. J Am Diet Assoc 2009;109:414-21.
24. Park SH, Kim MJ. Acceptance and preference of vegetables in menus for middle school students. J Korean Soc Food Sci Nutr 2008;37:
1660-6.
25. Cribb VL, Jones LR, Rogers IS, Ness AR, Emmett PM. Is maternal education level associated with diet in 10-year-old children? Public Health Nutr 2011;14:2037-48.
26. James WP, Nelson M, Ralph A, Leather S. Socioeconomic deter- minants of health. The contribution of nutrition to inequalities in health. BMJ 1997;314:1545-9.
27. Jo JE, Park HR, Jeon SB, Kim JS, Park GE, Li Y, Lim YS, Hwang J.
A study on relationship between socio-demographic factors and
food consumption frequencies among adolescents in South Korea:
using the Korea Youth Risk Behavior Web-based Survey from 2011.
Korean J Community Nutr 2013;18:165-76.
28. Wright HS, Guthrie HA, Wang MQ, Bernardo V. The 1987-88 nationwide food consumption survey: an update on the nutrient intake of respondents. Nutr Today 1991;26:21-7.
29. Yoo JE, Park GS. A study of the dietary behavior and food preference of adolescents. J East Asian Soc Diet Life 2003;13:19-24.
30. Serdula MK, Gillespie C, Kettel-Khan L, Farris R, Seymour J, Denny C. Trends in fruit and vegetable consumption among adults in the United States: behavioral risk factor surveillance system, 1994-2000.
Am J Public Health 2004;94:1014-8.
31. Riediger ND, Shooshtari S, Moghadasian MH. The influence of sociodemographic factors on patterns of fruit and vegetable consu- mption in Canadian adolescents. J Am Diet Assoc 2007;107:1511-8.
32. Taylor JP, Evers S, McKenna M. Determinants of healthy eating in children and youth. Can J Public Health 2005;96 Suppl 3:S20-6, S22-9.
33. Oliver LN, Hayes MV. Neighbourhood socio-economic status and the prevalence of overweight Canadian children and youth. Can J Public Health 2005;96:415-20.
34. Lee SO, Kim HA. Evaluation of effectiveness of vegetable-related nutrition education for elementary school students. J Korean Soc Food Sci Nutr 2013;42:713-20.
35. Nöthlings U, Schulze MB, Weikert C, Boeing H, van der Schouw YT, Bamia C, Benetou V, Lagiou P, Krogh V, Beulens JW, Peeters PH, Halkjaer J, Tjønneland A, Tumino R, Panico S, Masala G, Clavel-Chapelon F, de Lauzon B, Boutron-Ruault MC, Vercambre MN, Kaaks R, Linseisen J, Overvad K, Arriola L, Ardanaz E, Gonzalez CA, Tormo MJ, Bingham S, Khaw KT, Key TJ, Vineis P, Riboli E, Ferrari P, Boffetta P, Bueno-de-Mesquita HB, van der AD, Berglund G, Wirfält E, Hallmans G, Johansson I, Lund E, Trichopoulo A. Intake of vegetables, legumes, and fruit, and risk for all-cause, cardiova- scular, and cancer mortality in a European diabetic population. J Nutr 2008;138:775-81.