141
http://dx.doi.org/10.4196/kjpp.2015.19.2.141 eISSN 2093-3827
ABBREVIATIONS: GPR40, G protein-coupled receptor 40; KEGG, Kyoto Encyclopedia of Genes and Genomes Pathway; MAP, mitogen- activated protein; PLC, phospholipase C; ERK1/2, extracellular signal-regulated kinase 1/2; SEA, singular enrichment analysis;
Arrdc3, arrestin domain containing 3; Egr1, early growth response 1; PKC, protein kinase C.
Received November 22, 2014, Revised January 5, 2015, Accepted January 7, 2015
Corresponding to: Chang-Seon Myung, Department of Pharmacology, Chungnam National University College of Pharmacy, 99 Daehak-ro, Yuseong-gu, Daejeon 305-764, Korea. (Tel) 82-42-821-5923, (Fax) 82-42-821-8925, (E-mail) [email protected]
*These authors contributed equally to this work.
This is an Open Access article distributed under the terms of the Creative Commons Attribution Non-Commercial License (http://
creativecommons.org/licenses/by-nc/3.0) which permits unrestricted non-commercial use, distribution, and reproduction in any medium, provided the original work is properly cited.
Differential Gene Expression in GPR40-Overexpressing Pancreatic β-cells Treated with Linoleic Acid
In-Su Kim
1,*, So-Young Yang
1,2,*, Joo-Hui Han
1, Sang-Hyuk Jung
1, Hyun-Soo Park
1, and Chang-Seon Myung
1,21
Department of Pharmacology, Chungnam National University College of Pharmacy, Daejeon 305-764,
2Institute of Drug Research &
Development, Chungnam National University, Daejeon 305-764, Korea
“G protein-coupled receptor 40” (GPR40), a receptor for long-chain fatty acids, mediates the stimulation of glucose-induced insulin secretion. W e examined the profiles of differential gene expression in GPR40-activated cells treated with linoleic acid, and finally predicted the integral pathways of the cellular mechanism of GPR40-mediated insulinotropic effects. After constructing a GPR40-overexpressing stable cell line (RIN-40) from the rat pancreatic β -cell line RIN-5f, we determined the gene expression profiles of RIN-5f and RIN-40. In total, 1004 genes, the expression of which was altered at least twofold, were selected in RIN-5f versus RIN-40. Moreover, the differential genetic profiles were investigated in RIN-40 cells treated with 30 μ M linoleic acid, which resulted in selection of 93 genes in RIN-40 versus RIN-40 treated with linoleic acid. Based on the Kyoto Encyclopedia of Genes and Genomes Pathway (KEGG, http://www.genome.jp/kegg/), sets of genes induced differentially by treatment with linoleic acid in RIN-40 cells were found to be related to mitogen-activated protein (MAP) kinase- and neuroactive ligand-receptor interaction pathways. A gene ontology (GO) study revealed that more than 30% of the genes were associated with signal transduction and cell proliferation. Thus, this study elucidated a gene expression pattern relevant to the signal pathways that are regulated by GPR40 activation during the acute period. Together, these findings increase our mechanistic understanding of endogenous molecules associated with GPR40 function, and provide information useful for identification of a target for the management of type 2 diabetes mellitus.
Key Words: G protein-coupled receptor 40, Linoleic acid, Insulin secretion, Pancreatic β-cell, Type 2 diabetes mellitus
INTRODUCTION
Type 2 diabetes mellitus (T2DM, OMIM 125853) is a com- plex disease of various etiologies. A major characteristic of the pathological condition in T2DM is impairment of in- sulin secretion [1]. This deficit in insulin secretion involves the function of pancreatic β-cells and is aggravated by loss of β-cells and inappropriate signaling pathway activity [2].
Impaired insulin secretion leads to elevated blood glucose levels and multiple complications, including cardiovascular disease, nephropathy, retinopathy, lipid disorders, neuro- pathy, and ketoacidosis. Thus, regulation of insulin release
is considered a target for intervention in T2DM [3,4].
“G protein-coupled receptor 40” (GPR40) is a potential therapeutic target in T2DM and has been suggested to play an important role in regulating glucose-stimulated insulin secretion by pancreatic β-cells [5,6]. GPR40 is activated by free fatty acids (FFAs), such as linoleic acid, and medi- ates the majority of the effects of FFAs on β-cells [7].
Experiments using GPR40 KO mice (GPR40 -/-) showed that loss of GPR40 resulted in impaired insulin secretory responses to fatty acids, suggesting a possible role for the receptor in insulin secretion [8]. In another study, human GPR40 transgenic mice under the control of an insulin pro- moter were developed and displayed improved oral glucose tolerance, as well as enhanced glucose- and fatty acid-stimu- lated insulin secretion, compared with wild-type mice [9].
Thus, these observations suggest that GPR40 is linked to glucose-stimulated insulin secretion in pancreatic β-cells.
Whether a GPR40 agonist or antagonist would be better
for alleviating T2DM remains controversial. Whereas acute stimulation of GPR40 by FFAs has beneficial effects of in- creasing insulin secretion, chronic exposure to FFAs might cause lipotoxicity, such as β-cell dysfunction and death [10].
The efforts to discover non-fatty-acid agonists for GPR40 began only recently [8,11-14]; however, an orally bio- available GPR40 agonist, TAK-875, has been discovered and entered phase II clinical testing for T2DM in Japan [15]. Thus, the activation of GPR40 might increase glu- cose-stimulated insulin secretion in the management of T2DM.
GPR40 can be coupled to Gαq with a subsequent in- crease in cytosolic Ca
2+concentrations [6,16] by activating phospholipase C (PLC) or the Ltype Ca
2+channel [17-19].
Since the involvement of extracellular signal-regulated kin- ase 1/2 (ERK1/2) in the GPR40-mediated signaling pathway was suggested [6,20], a recent report demonstrated that FFA-mediated ERK1/2 activation was through c-RAF (RAF, a proto-oncogene serine/threonine-protein kinase) and MEK1/2 (ERK kinase) via Rac1 [21]. Although attention was focused on changes in intracellular Ca
2+, the possible involvement of ERK1/2 in GPR40-mediated insulin secretion remains unclear.
In this regard, to better understand the molecular mecha- nisms in the intracellular response following stimulation of GPR40, a stably GPR40-overexpressing pancreatic β-cell line (“RIN-40”) was established from a rat immortalized pancreatic β-cell line (“RIN-5f”), and the differential ex- pression of genetic profiles was examined in RIN-5f versus RIN-40 cells, and in RIN-40 versus linoleic-acid-treated, ac- tive RIN-40 cells. Based on microarray data, the involve- ment of ERK1/2 in GPR40-mediated insulin secretion was confirmed.
METHODS Reagents
Linoleic acid as a GPR40 agonist (C
18H
32O
2; mol. wt.
280.45; purity 99%) and G418 (an aminoglycoside anti- biotic, similar in structure to gentamicin B1) were pur- chased from Sigma-Aldrich Inc. (St. Louis, MO, USA).
Reagents were dissolved in dimethyl sulfoxide (DMSO;
Duchefa-Farma, Haarlem, Netherlands) and diluted in DMSO to the indicated final concentrations. RPMI 1640, fetal bovine serum (FBS), trypsin-EDTA, and penicillin/
streptomycin were purchased from Gibco BRL (Grand Island, NY, USA). All other reagents were of analytical grade or complied with the standards for cell culture.
Cell culture
The rat immortalized pancreatic β-cell line RIN-5f (CRL-2058) was purchased from ATCC and maintained in RPMI 1640 medium containing 2.05 mM L-glutamine, 17.86 mM sodium bicarbonate, 25 mM glucose, 10 mM HEPES, 1 mM sodium pyruvate, and 10% heat-inactivated FBS. Cells were incubated in a humidified atmosphere at 37
oC with 5% CO
2.
Vector constructs
For construction of the pCMV6-Neo-GPR40 expression plasmid, the vector pEZ-M02-GPR40 was purchased from
GeneCopoeia (MD, USA) and inserted into the pCMV6-Neo vector (ORIGENE, MD, USA). E. coli DH-5α cells harbor- ing the selected plasmid DNA were cultured in LB broth media. Plasmid DNA was extracted using a plasmid mini kit (Qiagen, Hilden, Germany). The extracted plasmid DNA was treated with the XmnI and XhoI restriction enzymes.
The digested GPR40 gene was separated in a 1.0% agarose gel, eluted using a MEGA-spin Agarose Gel Extraction Kit (Intron, Seongnam, Korea), and ligated into the pCMV6-Neo vector plasmid. The pCMV6-Neo-GPR40 was verified by XmnI/XhoI double digestion and sequencing (Bioneer, Daejeon, Korea). The confirmed vector was prepared using a QIAFilter Plasmid Midi Kit (Hilden, Germany) and used to transfect the cells.
Establishment of a stably GPR40-overexpressing pan- creatic β-cell line
To construct a stable cell line for human GPR40 (NM_
005303), RIN-5F cells were transfected with pCMV6- Neo-GPR40 in the transfection reagent Nucleofector Solution V using an Amaxa Nucleofector II device (Amaxa Biosystems, Cologne, Germany). The transfected cells were then se- lected and maintained in culture medium containing 300 μg/ml G418; this stably GPR40-overexpressing cell line was designated “RIN-40.” RIN-40 cells were maintained in G418 selective medium and confirmed by assaying GPR40 mRNA and protein levels.
Measurement of intracellular Ca
2+The cells were plated in 96-well plates (2×10
5per well) for 2 days (to 70∼80% confluence). On the day of the ex- periment, the cell culture medium was aspirated and the plate was washed twice with Krebs-Ringer bicarbonate HEPES (KRBH) buffer. Cells were rested at 37
oC for 30 min in KRBH containing 25 mM glucose. Compounds were dissolved in DMSO and added to cells for 2 min. After the reaction, cells were fixed with 10% formalin for 1 h. The fixed cells were treated with 2 μM Fura-2AM in 1 mM EGTA buffer for 30 min. Intracellular Ca
2+was meas- ured using a total internal reflection fluorescence (TIRF) microscope.
Measurement of insulin secretion
RIN-5F and RIN-40 cells were seeded in 24-well plates
at a density of 2×10
5/well and cultured for 2 days. The cells
were washed twice with glucose-free KRBH buffer contain-
ing 103.45 mM NaCl, 5.33 mM KCl, 5.63 mM Na
2HPO
4,
0.407 mM MgSO
4, 1.28 mM CaCl
2, 10 mM HEPES and
17.86 mM NaHCO
3and then incubated in KRBH buffer
with 0.05% bovine serum albumin (BSA) and 2.5 mM glu-
cose for 30 min at 37
oC. Then, cells were washed once more
with glucose-free KRBH buffer and treated with 500-μL
KRBH buffer containing 25 mM glucose and with or with-
out the indicated concentrations of reagents in DMSO (final
DMSO concentration of 0.1%). After 2 h, supernatant from
each plate was collected and the insulin level determined
using an Insulin (Rat) High-range ELISA (ALPCO,
Windham, NH). The data were expressed as fold changes
compared to the amount of insulin secreted (ng/ml insulin
vs. mg/ml total protein).
Western blot analysis
Whole cells were lysed in Pro-prep protein extraction sol- ution (Intron Biotechnology, Seoul, Korea), and the protein concentration in the lysates was measured using a Bio-Rad protein assay kit (Bio-Rad, Hercules, CA, USA). Equal amounts of proteins (10 μg) were run on a 10% SDS-PAGE gel and transferred onto a PVDF membrane by electroblotting.
The membranes were then washed with TBST containing 5% BSA at room temperature and incubated for 2 h with the following antibodies: 1:1000 anti-ERK1/2 and an- ti-phospho-ERK1/2 (Cell Signaling, Beverly, MA, USA), 1:500 anti-GPR40 (Santa Cruz Biotechnology, Santa Cruz, CA, USA), and 1:5000 anti-β-actin (AbFrontier, Seoul, Korea), which was used as an internal control. The mem- branes were washed in TBST and incubated for 1 h with horseradish peroxidase-conjugated anti-mouse and an- ti-rabbit immunoglobulin antibodies (1:1000) under the same conditions. After washing with TBST, signals were detected using an enhanced chemiluminescence detection reagent (AbFrontier, Seoul, Korea), visualized, and meas- ured by densitometry using a ChemiDoc XRS digital imag- ing system and the Quantity One software (ver. 4.4.1;
Bio-Rad Laboratories, Hercules, CA, USA).
Treatment of drug and RNA extraction for microarray The RIN-5f and RIN-40 cells were seeded (10
6/well) in six-well plates for 48 h and were made quiescent in se- rum-free medium for 24 h, followed by treating with 30 μM linoleic acid to RIN-40 for an additional 2 h. Total RNA was isolated using a HiYield Total RNA Mini Kit according to the manufacturer’s protocol (RBCBioscience, New Taipei, Taiwan). The quality of total RNA was confirmed by run- ning samples on an Agilent 2100 Bioanalyzer (Agilent Technology, CA, USA). RIN (RNA Integrity Number, cut-off threshold: 7.0) values were 9.6 for RIN-5f and RIN-40, and 9.7 for RIN-40 treated linoleic acid. Agilent’s Rat Oligo Microarray (44K) analysis was carried out at eBiogen Inc.
(Seoul, Korea).
Microarray data analysis and bioinformatics analysis The sample quality control was based on the Pearson cor- relation of a sample with other samples in the whole experiment. Hybridized images were scanned using an Agilent DNA microarray scanner and quantified with Feature Extraction Software (Agilent Technology, Palo Alto, CA, USA). Probe features were divided with ‘present,’
‘marginal,’ and ‘absent’ flags, and the present and marginal flags were retained for further analyses. The genes flagged as ‘present’ and ‘marginal’ were selected as reliable for fur- ther analysis. All data normalization and selection of fold-changed genes were performed using GeneSpringGX 7.3 (Agilent Technology, USA). To assess functional rela- tionships between genes, DAVID (http://david.abcc.ncifcrf.gov/) as a web-based singular enrichment analysis (SEA), was used, providing mainly annotation and gene ontology (GO) term enrichment analysis to highlight the most relevant GO terms associated with a given gene list. The enrichment p value was calculated for each term from the list of genes of interest with a single-linkage method. Then, enriched terms were listed in a simple linear text format. In the DAVID annotation system, the EASE score and a modified
Fisher’s exact test between ‘in pathway’ and ‘not in path- way’ were used to measure gene enrichment in terms of annotation. Due to the redundant nature of annotations, a Functional Annotation Chart was used to present sim- ilar/relevant annotations repeatedly. The grouping algo- rithm is based on the hypothesis that similar annotations should have similar gene members. Functional Annotation Clustering integrates the same techniques as kappa sta- tistics to measure the degree of common genes between two annotations, and fuzzy heuristic clustering (as used in the Gene Functional Classification Tool) to classify the groups of similar annotations according to kappa values. In this sense, the greater the number of common genes shared by annotations, the greater the likelihood they will be grouped together. The Group Enrichment Score, the geometric mean of members’ p-values in a corresponding annotation cluster, is used to rank their biological significance. Thus, the mem- bers of the top-ranked annotation groups most likely have consistently lower p-values. To determine whether certain functional categories were over-represented in the gene lists determined in the microarray experiments, reliable genes were first filtered using the ‘present’ and ‘marginal’
flags and re-filtered according to being 1.5-, 2-, and 3-fold up- and downregulated. The filtered gene lists were applied to DAVID and annotated functional pathways in GO and KEGG, which can identify the locations of genes in related pathways. Annotated pathways were displayed with stat- istical significance values in terms of enrichment scores, nominal p value, and FDR (p<0.05). For discrete genes in certain pathway we identified biological functions in the KEGG pathways and verified their functions using GenBank and literature searches using PubMed (http://www.
ncbi.nlm.nih.gov/).
Quantitative RT-PCR
RIN-5f and RIN-40 cells were seeded (10
6/well) in six-well
plates for 48 h, and exposed to various reagents. Total RNA
was isolated using a HiYield Total RNA Mini Kit according
to the manufacturer’s protocol (RBCBioscience, New Taipei,
Taiwan). First-strand complementary DNA (cDNA) was
synthesized from 1 μg of total RNA in a 20-μL reaction
volume using the AccuPower CycleScript RT PreMix, as
recommended by the manufacturer (Bioneer, Daejeon,
Korea). The cDNA synthesis thermal cycling program in-
cluded the following three steps: 37
oC for 1 min, 47
oC for
3 min, 55
oC for 1 min, then 95
oC for 5 min. Using the PCR
mixture, initial DNA polymerase activation was carried out
at 95
oC for 5 min, followed by 35 cycles of 95
oC for 10 s,
60
oC for 10 s, and 72
oC for 10 min. A final extension was
carried out at 72
oC for 5 min. The PCR products were vi-
sualized by ethidium bromide staining after separation by
electrophoresis in a 2% agarose gel in Tris borate ethyl-
enediamine tetra-acetic acid (TBE) buffer (pH 8.3). Images
were captured using a Fluor-S Max MultiImaging system
and band densities were assessed with the Quantity One
1-D software (ver. 4.6.0). The reaction mixture for real-time
quantitative reverse transcription PCR (qRT-PCR) con-
tained cDNA, 1× SYBR green Taq polymerase mixture
(Toyobo, Osaka, Japan), and primers, and was performed
using an Exicylcler 96 instrument (Bioneer, Daejeon,
Korea). Relative gene expression levels were compared us-
ing an invariant endogenous control (β-actin). The ΔΔCT
method was used for relative quantification according to the
manufacturer’s guidelines. The sequences of the primers
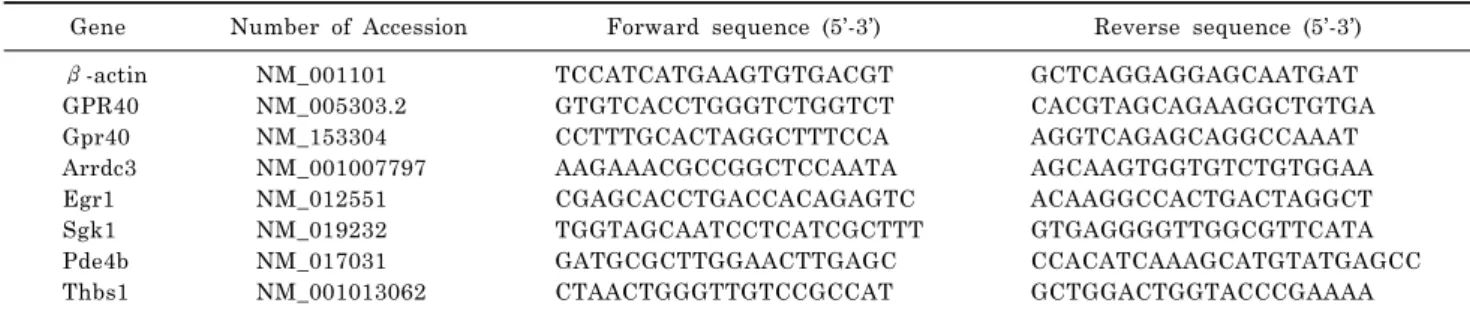
Table 1. Primers used for qRT-PCR and PCR
Gene Number of Accession Forward sequence (5’-3’) Reverse sequence (5’-3’)
β -actin NM_001101 TCCATCATGAAGTGTGACGT GCTCAGGAGGAGCAATGAT
GPR40 NM_005303.2 GTGTCACCTGGGTCTGGTCT CACGTAGCAGAAGGCTGTGA
Gpr40 NM_153304 CCTTTGCACTAGGCTTTCCA AGGTCAGAGCAGGCCAAAT
Arrdc3 NM_001007797 AAGAAACGCCGGCTCCAATA AGCAAGTGGTGTCTGTGGAA
Egr1 NM_012551 CGAGCACCTGACCACAGAGTC ACAAGGCCACTGACTAGGCT
Sgk1 NM_019232 TGGTAGCAATCCTCATCGCTTT GTGAGGGGTTGGCGTTCATA
Pde4b NM_017031 GATGCGCTTGGAACTTGAGC CCACATCAAAGCATGTATGAGCC
Thbs1 NM_001013062 CTAACTGGGTTGTCCGCCAT GCTGGACTGGTACCCGAAAA
GPR40, human G protein coupled receptor 40; Gpr40, rat G protein coupled receptor 40; Arrdc3, arrestin domain containing 3;
Egr1, early growth response 1; Sgk1, serum/glucocorticoid regulated kinase 1; Pde4b, phosphodiesterase 4B, cAMP specific; Thbs1, thrombospondin 1.
used for PCR amplification are shown in Table 1.
Statistical analysis
The DAVID web-based tool was used to extract the major biological features in the large gene lists. Statistical sig- nificance was expressed as nominal p values and the cor- rected p value though FDR. For the insulin secretion test, statistical analyses were conducted using a Kruskal-Wallis test, followed by Dunn’s post hoc test or Mann-Whitney U-test using the Prism software (GraphPad Software, San Diego, CA, USA). p values<0.05 were considered to in- dicate statistical significance.
RESULTS
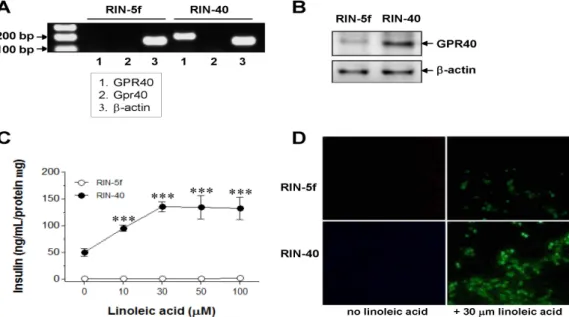
Identification of a GPR40-overexpressing stable cell line To evaluate the effects of overexpressing GPR40, we es- tablished RIN-40 from the original rat pancreatic β-cell line RIN-5f. Microscopic observation of RIN-40 cells re- vealed that they were morphologically similar in overall ap- pearance to RIN-5f (data not shown). By RT-PCR, the RIN-40 cell line showed abundant expression of GPR40 mRNA (human GPR40), but little endogenous Gpr40 mRNA (rat GPR40; Fig. 1A). Neither GPR40 nor Gpr40 mRNA was detected in the RIN-5f cell line. As expected, the GPR40 protein level in RIN-40 was considerably great- er than that in RIN-5f (Fig. 1B). To determine whether in- sulin secretion was mediated by RIN-40 activation, the dose-response relationship between linoleic acid as a GPR40 agonist and insulin secretion was measured. The basal level of glucose-stimulated insulin secretion in RIN-40 was about 50-fold greater than that in RIN-5f (Fig.
1C). As the concentration of linoleic acid increased, glu- cose-stimulated insulin secretion increased significantly, in a dose-dependent manner. The maximal efficacy was at 30 μM linoleic acid with a ca. threefold increase (from 50.00±7.46 to 135.10±9.20 ng/ml/protein mg), compared with the basal level in RIN-40 (p<0.001). To confirm that the linoleic acid-induced action was mediated through Gα q-coupled GPR40 signaling, intracellular Ca
2+mobilization was measured in linoleic-acid-treated RIN-5f and RIN-40 cells. GPR40 activation induced by 30 μM linoleic acid caused an increase in intracellular Ca
2+mobilization in RIN-40 cells, to a level ca. fivefold greater than that in
RIN-5f cells (Fig. 1D). On the basis of these observations, RIN-40, a stable GPR40-overexpressing cell line, was estab- lished to be suitable for investigation of the function of GPR40, with the exception of the effects of endogenous Gpr40, and was used for further experiments.
Global gene expression profile in the presence of GPR40 overexpression
Of the 30,367 probe sets on the Agilent Rat Oligo Microa- rray (44K), the ‘reliable’ signals were selected to character- ize the gene expression profiles of RIN-5f and RIN-40 cells.
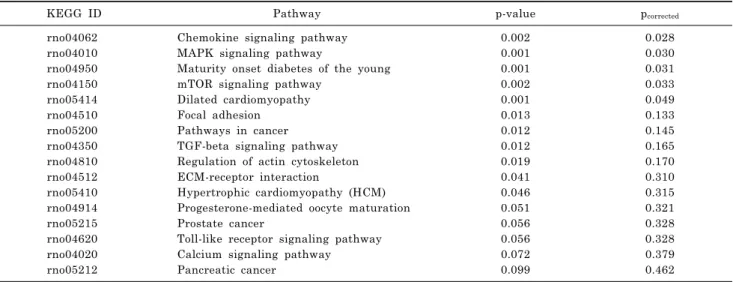
A microarray analysis of the RIN-40 cell line using GeneSpringGX 7.3, showed that 1004 genes in GO bio- logical pathways were expressed differentially by at least twofold compared with in RIN-5f cells (Table 2). Of the dif- ferentially expressed genes identified, 475 were upregu- lated, and 529 were downregulated. Genes related to signal transduction and cell differentiation represented >30% of the total. Upregulated and downregulated genes showed similar distributions in each biological pathway. Genes as- sociated with signal transduction pathways whose ex- pression changed by at least threefold are presented in Table 2. To identify the signaling pathways in which genes were involved, the genes applied on DAVID with at least a 1.5fold change were matched to specific KEGG pathways and classified by cellular function with statistical values, based on frequencies of genes in each pathway (Table 3).
In the various biological pathways affected by over- expression of GPR40, many genes were related to chemo- kines (p
corrected=0.028), mitogen-activated protein (MAP) kinase (p
corrected=0.030), maturity onset diabetes of the young (p
corrected=0.031), mTOR (p
corrected=0.033), and the di- lated cardiomyopathy signaling pathway (p
corrected= 0.049).
Global gene expression profile of RIN-40 cells in response to linoleic acid
After checking signal intensity quality with the micro- array using the RIN-40 response to 30 μM linoleic acid, 93 genes were found to be differentially expressed by more than twofold. Of these, 15 (22.7%) upregulated and 7 (25.9%) downregulated genes were involved in signal trans- duction (Table 2). The total number of genes whose ex- pression was altered by linoleic acid (93) was fewer than that in the comparison between RIN-5f and RIN-40 cells.
Whereas ~59% of genes related to cell differentiation, cell
Table 2. Frequencies of differentially expressed genes in RIN-5f vs. RIN-40 and RIN-40 vs. RIN-40 treated with linoleic acid
Biological pathway RIN-5f vs. RIN-40 RIN-40 vs/ RIN-40 LA*
Up% (genes) Down% (genes) Up% (genes) Down% (genes)
Aging 1.5 (7) 3.4 (18) 0 (0) 0 (0)
Angiogenesis 1.7 (8) 0.4 (2) 6.1 (4) 3.7 (1)
Apoptosis 5.9 (28) 10.4 (55) 9.1 (6) 7.4 (2)
Cell cycle 6.5 (31) 2.3 (12) 3 (2) 14.8 (4)
Cell differentiation 15.8 (75) 14.7 (78) 12.1 (8) 11.1 (3)
Cell proliferation 8.6 (41) 6.6 (35) 12.1 (8) 11.1 (3)
DNA repair 1.1 (5) 0 (0) 3 (2) 0 (0)
Extracellular matrix 2.7 (13) 3.4 (18) 1.5 (1) 3.7 (1)
Immune response 2.9 (14) 7 (37) 3 (2) 3.7 (1)
Inflammatory response 1.5 (7) 5.9 (31) 3 (2) 3.7 (1)
Neurogenesis 10.1 (48) 5.7 (30) 4.5 (3) 3.7 (1)
Response to oxidative stress 4 (19) 6.2 (33) 3 (2) 0 (0)
Regulation of cellular protein metabolic process 6.9 (33) 5.7 (30) 4.5 (3) 7.4 (2)
RNA splicing 0.8 (4) 0.4 (2) 0 (0) 0 (0)
Signal transduction 18.3 (87) 19.1 (101) 22.7 (15) 25.9 (7)
Transcription 11.6 (55) 8.9 (47) 12.1 (8) 3.7 (1)
Total 100 (475) 100 (529) 100 (66) 100 (27)
*RIN-40 LA, RIN-40 cells treated with 30 μM Linoleic acid.
Fig. 1. RIN-40, a stable cell line highly and constitutively expressing GPR40. RIN-40 was constructed from rat insulinoma cell line, RIN-5f by transfection with pCMV6-Neo-GPR40, as described in the Materials and Methods. (A) Comparison of human GPR40 (1, GPR40) and rat GPR40 (2, Gpr40) mRNA expression in RIN-40 with RIN-5f. GPR40 and Gpr40 mRNA expression was measured using quantitative real-time RT-PCR. (B) Comparison of human GPR40 protein expression in RIN-40 with RIN-5f by immunoblotting. (C) Concentration-response relationship of linoleic acid on glucose-stimulated insulin secretion in RIN-5f and RIN-40. Results are the means±SEM of four similar independent experiments, each performed in triplicate. ***p<0.001, vs. basal glucose-stimulated insulin secretion in RIN-40 (no linoleic acid). (D) Fluorescence detection of intracellular Ca
2+in both RIN-5f and RIN-40.
proliferation, signal transduction, and transcription were upregulated, ~63% of those related to the cell cycle, cell differentiation, cell proliferation, and signal transduction
were downregulated by linoleic acid treatment. Table 4
shows representative genes related to signal transduction
whose expression changed by at least twofold. In an analy-
Table 4. Pathway and genes represented in RIN-40 cell treated with linoleic acid
KEGG ID Pathway p-value p
correctedrno04740 Olfactory transduction <0.001 <0.001
rno04080 Neuroactive ligand-receptor interaction 0.002 0.103
rno04010 MAPK signaling pathway 0.014 0.340
rno04060 Cytokine-cytokine receptor interaction 0.024 0.415
rno04810 Regulation of actin cytoskeleton 0.036 0.479
rno05218 Melanoma 0.036 0.420
rno04662 B cell receptor signaling pathway 0.051 0.485
rno05200 Pathways in cancer 0.060 0.499
rno04020 Calcium signaling pathway 0.061 0.462
Table 5. Confirmation of microarray by qRT-PCR representative genes related to signal transduction
Name of genes Entrez gene ID Fold change
Microarray qRT-PCR
Arrestin domain containing 3 NM_001007797 3.12 3.59
Early growth response 1 NM_012551 2.64 4.36
Serum/glucocorticoid regulated kinase 1 NM_019232 2.12 2.69
Phosphodiesterase 4B, cAMP specific NM_017031 0.38 0.83
Thrombospondin 1 NM_001013062 0.24 0.6
Table 3. Pathway and genes represented in GPR40 overexpressing RIN-40 cell compare with RIN-5f cell
KEGG ID Pathway p-value p
correctedrno04062 Chemokine signaling pathway 0.002 0.028
rno04010 MAPK signaling pathway 0.001 0.030
rno04950 Maturity onset diabetes of the young 0.001 0.031
rno04150 mTOR signaling pathway 0.002 0.033
rno05414 Dilated cardiomyopathy 0.001 0.049
rno04510 Focal adhesion 0.013 0.133
rno05200 Pathways in cancer 0.012 0.145
rno04350 TGF-beta signaling pathway 0.012 0.165
rno04810 Regulation of actin cytoskeleton 0.019 0.170
rno04512 ECM-receptor interaction 0.041 0.310
rno05410 Hypertrophic cardiomyopathy (HCM) 0.046 0.315
rno04914 Progesterone-mediated oocyte maturation 0.051 0.321
rno05215 Prostate cancer 0.056 0.328
rno04620 Toll-like receptor signaling pathway 0.056 0.328
rno04020 Calcium signaling pathway 0.072 0.379
rno05212 Pancreatic cancer 0.099 0.462
p-value, nominal p value; p
correctedvalue, corrected by Benjamini-Hochberg.
sis of involvement by pathway, the gene sets annotated in- cluded olfactory transduction (p=8.9×10
-23), neuroactive li- gand-receptor interaction (p=0.002), MAP kinase signaling pathway (p=0.014), cytokine-cytokine receptor interactions (p=0.024), and regulation of the actin cytoskeleton (p=0.036).
To confirm the microarray data, three upregulated genes [arrestin domain containing 3 (Arrdc3), early growth re- sponse 1 (Egr1), and serum/glucocorticoid-regulated kinase 1 (Sgk1)], and two downregulated genes [cAMP-specific phosphodiesterase 4B (Pde4b) and thrombospondin 1 (Thbs1)]
were selected and qRT-PCR was performed using RNA ob- tained independently of that used in the microarray. The mRNA levels of all selected genes in the qRT-PCR experi- ment showed patterns similar to those obtained by micro-
array analysis (Table 5).
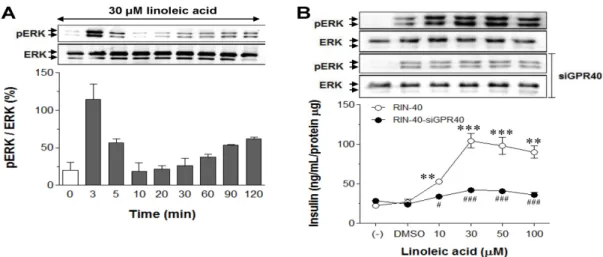
Involvement of ERK activation in linoleic-acid-induced insulin secretion
To assess the involvement of ERK signaling in lino-
leic-acid-induced insulin secretion, the phosphorylation of
ERK according to duration of incubation in the presence
of linoleic acid and insulin secretion under GPR40 activa-
tion induced by linoleic acid treatment were measured. The
data in Fig. 2A show that ERK phosphorylation was in-
creased rapidly by treatment with 30 μM linoleic acid for
3 min, followed by a decrease, in RIN-40 cells. ERK activa-
tion coincided with the increase in insulin secretion in
Fig. 2. Effect of linoleic acid on ERK activation and glucose-stimulated insulin secretion in RIN-40 cell line. (A) Incubation time course of linoleic acid treatment with ERK phosphorylation. RIN-40 cells were treated with 30 μM linoleic acid for 0, 3, 5, 10, 20, 30, 60, 90, and 120 min and an immunoblot was performed using total and phospho-ERK antibodies. (B) Correlation of insulin secretion via GPR40 activation induced by linoleic acid treatment with ERK activation. RIN-40 and RIN-40 cells transfected with siRNA for GPR40 (RIN-40-siGPR40) were treated with 0, 10, 30, 50, and 100 μM linoleic acid, and ERK phosphorylation and insulin secretion were measured.
All values in the bar and line graphs are means±SEM of three similar, independent experiments and gel images are representative of three independent experiments. **p<0.01 and ***p<0.001, vs. vehicle (DMSO)-treated glucose-stimulated insulin secretion in RIN-40 and
#