Original Article
Variation of Hydro-Meteorological Variables in Korea
Temba Nkomozepi, Sang-Ok Chung*, and Hyun-Ki Kim
Department of Agricultural Civil Engineering, Kyungpook National University, Daegu 702-701, Korea
Received: July 11 2014 / Revised: August 11 2014, August 20 2014 / Accepted: August 29 2014
Abstract The variability and temporal trends of the annual and seasonal minimum and maximum temperature, rainfall, relative humidity, wind speed, sunshine hours, and runoff were analyzed for 5 major rivers in Korea from 1960 to 2010. A simple regression and non-parametric methods (Mann-Kendall test and Sen's estimator) were used in this study. The analysis results show that the minimum temperature (T
min) had a higher increasing trend than the maximum temperature (T
max), and the average temperature increased by about 0.03
oC yr.
−1. The relative humidity and wind speed decreased by 0.02% yr
−1and 0.01 m s
−1yr
−1, respectively. With the exception of the Han River basin, the regression analysis and Mann-Kendall and Sen results failed to detect trends for the runoff and rainfall over the study period.
Rapid land use changes were linked to the increase in the runoff in the Han River basin. The sensitivity of the evapotranspiration and ultimately the runoff to the meteorological variables was in the order of relative humidity > sunshine duration > wind speed >
T
max> T
min. Future studies should investigate the interaction of the variables analyzed herein, and their relative contributions to the runoff trends.
Keywords:
Climate change, Korea, Mann-Kendall test, Runoff, Trends
Introduction
The consensus in the scientific community is that climate change is unequivocal, as evidenced by global warming. In addition to temperature, the evaluation of other observable climate variables is also essential in climate change modeling for the preparation of mitigation and adaptation policies (Kim et al., 2010). The response of hydro-meteorological variables to climate change is uncertain, largely due to feedback processes (Ingram, 2013).
Statistical tests have already been used on observed time series of hydro-meteorological variables to detect their temporal trends (Önöz and Bayazit, 2012). The hydro-meteorological variables commonly studied are temperature, rainfall, wind speed, relative humidity, sunshine duration, and runoff.
Energy from the sun is a source of energy for climate change, governs transpiration, and is a direct factor in photosynthesis. Yet, since direct measurement of the photosynthetically active radiation is costly, for agricultural purposes this is usually measured based on the photoperiod (duration of bright sunshine) (Viswanadham and Ramanadham, 1969). In India, decreasing sunshine duration trends were observed mainly from 1976 to 2000 (Jhajharia and Singh, 2011). However, in Iran, seasonal and annual trends of sunshine duration increased between 1981 and 2007 (Rahimzadeh et al., 2014). A longer sunshine duration during the growing season is desirable for the growth and development processes that determine the yield.
Still, under the conditions of strong solar radiation, plants can suffer as the higher evapotranspiration (ET) demand, low humidity, and moisture uptake by the roots cannot be replenished (Kuwagata et al., 2012). Studies have confirmed that the spikelet sterility induced by increasing temperatures in rice production can be reduced by reducing the relative humidity (Yan et al., 2010). In Serbia, increasing trends were detected for temperatures and vapor pressure, while the relative humidity decreased. In the same study, there were no significant trends for rainfall (Gocic and Trajkovic, 2013). Another study reported that the changes in rainfall over time were complex and opposite changes were seen in different parts of the United Kingdom over the period from 1961 to 1995
*Corresponding author: Sang-Ok Chung Tel: 82-53-950-5734 ; Fax: 82-53-950-6752 E-mail: [email protected]
This is an Open Access article distributed under the terms of the Creative Commons Attribution Non-Commercial License (http://creativecommons.
org/licenses/by-nc/3.0/) which permits unrestricted non-commercial use, distribution, and reproduction in any medium, provided the original work is properly cited.
© 2014 Institute of Agricultural Science and Technology, Kyungpook National University
(Osborn et al., 2000). In Korea, the trends in the seasonal and monthly runoff showed patterns similar to the trends in rainfall, and decreases in the spring runoff were associated with decreases in the spring rainfall (Bae et al., 2008). Several studies have also reported decreasing wind speeds and reduced wind storms contributing to a decreased frequency and magnitude of dust storms in China (Guo et al., 2011; Jiang et al., 2010). Yet, another study that used observed data from 1985 to 2008 to investigate wind speed found a consistent trend of increasing global wind speeds (Young et al., 2011).
The hydro-meteorological variables are linked and interact with the water balance. The water balance consists of the incoming rainfall and outgoing ET, with the difference being the terrestrial water for runoff and soil moisture storage (Shaw and Riha, 2011).
Generally, ET is estimated as the reference evapotranspiration (ET
o) adjusted for moisture availability based on the vegetation type and development and various antecedent conditions. ET
orefers to the ET rate from a hypothetical grass reference crop with specific characteristics, and since is only affected by meteorological factors, it can be computed with a level of high confidence (Allen et al., 1998). The variation of meteorological trends over time are indicators of climate change. Subsequently, the variation of key hydrological cycle components, such as the ET and runoff, indicate the response of water resources and the eco-environment to climate change (Li et al., 2012). However, despite extensive research, the direct comparison of assessment findings across studies is not possible because different aspects of these variables are analyzed using different time periods and methods (Intergovernmental Panel on Climate Change, 2013). Therefore, the objective of this study is to summarize the historical variation and trends of hydro-meteorological variables in Korea.
Materials and Methods
Study area
Korea lies in the Far East (33
o-45
oN Latitude; 124
o-131
oE Longitude). The climate of Korea is the Asian monsoon, which has distinct monsoon winds and complex climate characteristics that reveal continental and oceanic features. The average annual rainfall in Korea is 1,245 mm (ca. 1.4 times the global average).
However, due to the large population, the average rainfall per capita is only 2,591 m
3(ca. 0.13 times the global average). There are five major river systems in Korea that play an important role as a water resource for agriculture, industry, and municipalities (Figure 1). 65% of the land is mountainous and the channel slopes of the rivers are steep. As a result, Korea suffers from significant seasonal, annual, and regional variations of rainfall and runoff. Only ca. 58% of the total volume of water resources of 1,240 million m
3per annum is runoff in streams, which is then managed for stream water, dam, and groundwater usage. A large portion of the runoff
(ca. 31%) flows to the West, South, and East Seas (Ministry of
Environment,http://eng.me.go.kr/). Overall, about 99% of the inflow into the multi-purpose dams was discharged downstream within the same year over the period from 1999 to 2009 (Water Management Information System, http://wamis.go.kr).
Data
The data used in this study were extracted from the Korea Meteorological Administration (KMA) (Korea Meteorological Administration, http://kma.go.kr) and water information system (Water Management Information System, http://wamis.go.kr). The data extracted from the KMA were the minimum temperature (T
min), maximum temperature (T
max), wind speed (WS), relative humidity (RH), sunshine duration (SH), and rainfall. The processed and gap-filled monthly data for runoff were courtesy of the Korea Water Resources Corporation (K-Water) and Korea Hydro & Nuclear Power (KHNP). The Korea Meteorological Organization (KMA) has 94 weather stations, 464 Automatic Weather Stations (AWS), 20 Asian dust observation stations, five moored buoys, and one observation ship that observe many hydro-meteorological variables.
Variation of hydro-meteorological variables
The mean (μ) and standard deviation (δ) of the hydro-
meteorological variables over the study period from 1960 to 2010
were computed to present their respective variations. In addition,
the inter-annual and seasonal inter-annual variabilities derived
from Kim et al. (2013) were also computed. The inter-annual
variability (IAV) and seasonal inter-annual variability (sIAV) refer
Figure 1. Map of Korea.to the year-to-year variation and season of the previous year to season of the next year variation of a hydro-meteorological variable, respectively. The calculations of IAV and sIAV are shown in Eqs. (1) and (2), respectively. Additional measures of variability are also used herein because the absolute value of IAV and sIAV capture the temporal sequence of the hydro-meteorological variable change, which is not captured by the use of the standard deviation (Kim et al. 2013).
(1)
where x is the annual hydro-meteorological variable, IAV is the inter-annual variability, x
iand x
i+1are the sequential variable data values of the time series in the years i and i+1, respectively, and n is the number of years.
(2)
where x is the seasonal annual hydro-meteorological variable, sIAV is the seasonal inter-annual variability, and s is the season.
Trend analysis
Linear regression (LR) was also used to investigate the general linear trend in the hydro-meteorological data with time. The slope (m) of the linear regression line with the correlation coefficient (r) is shown in the equations below:
y = mx + c (3)
(4)
(5)
where x represents the year, y the tested parameter, m is the slope, c is the y-axis intercept, and n represents the number of years over which the trend is tested.
In general, the correlation coefficient measures the dependence of the variables with time (−1 ≤ r ≤ 1). The strength of the correlation is termed weak, moderate, or strong if is 0-0.3, 0.3-0.7, or 0.7-1, respectively. A stronger correlation gives a more reliable slope. m and r are both used to determine the direction of the trend, while the magnitude of m determines the magnitude of the trend. Regression was used to assess the annual and seasonal data. The months were grouped into the following seasons:
December, January, and February (DJF); March, April, and May (MAM); June, July, and August (JJA); and September, October, and November (SON). In addition, the Mann-Kendall (MK) test and
Sen’s slope estimator were used to detect trends that could not be detected by the regression analysis due to the high variability of climate variables and relatively short period of the analysis.
The MK test is one of the most popularly applied tests to detect trends in hydro-meteorological time series (Yue and Wang, 2004), and in this study it was used to detect the trends of the hydro- meteorological variables over the study area. The following equations illustrate the MK test statistic S, and standardized test statistic Z (Gocic and Trajkovic, 2013):
(6)
(7)
(8)
(9)
where x
iand x
jare the sequential data values of the time series in the years i and j, respectively, n is the length of the time series, t
pis the number of ties for the pth value, and q is the number of tied values.
Positive values of S and Z are an indicator of an increasing trend, while negative values indicate a decreasing trend. The magnitude of the test statistic Z determines the statistical significance of a trend. If the calculated Z is less than Z
p/2, where p represents the p-value (Z
0.025=1.96, Z
0.005=2.58, Z
0.0005=3.29), then the null hypothesis can be rejected, implying that the trend is not statistically significant for the p-value level (Önöz and Bayazit, 2012). Meanwhile, Sen’s slope estimator is a non- parametric procedure for estimating the slope (a) of the trend in a sample of n pairs of data. If the n values of a
iin Eq. (10) are ranked by magnitude, Sen’s slope estimator is the median slope (a
med) computed using the following equations (Gocic and Trajkovic, 2013):
(10)
(11)
where y
jand y
kare the data values at successive times j and k (j>k), respectively (Gocic and Trajkovic, 2013). A negative or positive a
medindicates a downward or upward trend, respectively,
IAVx 1
n–1
--- xi–xi 1+
i 1= n 1–
∑
=
sIAVx 1
n–1
--- xis–xsi 1+ i 1= n 1–
∑
=
m n
i=1(xi–x) y( i–y)
∑
n i=1
∑
(xi–x)2---
=
r
n
i=1(xi–x) y( i–y)
∑
n i=1
∑
(xi–x)2⎝ ⎠
⎛ ⎞ n
i=1
∑
(yi–y)2⎝ ⎠
⎛ ⎞
---
=
r
S sgn(xj–xi)
j i 1=+ n
∑
i 1= n 1–
∑
=
xj–xi
( )
sgn
+1 if x( j–xi) 0>
0 if x( j–xi) 0= 1 if
– (xj–xi) 0<
⎩ ⎭
⎪ ⎪
⎨ ⎬
⎪ ⎪
⎧ ⎫
=
Var S( ) 118--- n n 1( – ) 2n 5( + ) tp(tp–1) 2t( p+5)
p 1= q
∑
–
=
Z
S–1 Var S( ) --- if S 0>
0 if S=0 S+1 Var S( ) --- if S 0<
=
a yj–yk j k–
--- for i=1,...,n
=
amed
a[(n 1 2+ ⁄)], if n is odd a[n 2⁄]+a[(n 2) 2+ ⁄)],
---2 if n is even
⎩ ⎭
⎪ ⎪
⎨ ⎬
⎪ ⎪
⎧ ⎫
=
while the magnitude of a
medgives the steepness.
Attribution analysis
The goal of a factor or attribution analysis is to identify the most important factors in the estimation of runoff and to reduce the redundancy among the variables by using a smaller number of factors (Scott et al., 2010). The general water balance that forms the basis of this attribution analysis is shown in Eq. (12):
(12)
where R is the rainfall, RO is the runoff, S is the storage change, and ET is the evapotranspiration
Further, it was assumed that the relationships can be determined using univariate linear regression, no additional terms are needed to predict the RO, and the remaining variation in the RO is purely random and unpredictable (Scott et al., 2010). The combined Penman-Monteith equation was used to estimate ET
oin this study, as it is considered to be physically correct given that it has a solid theoretical basis and a dependency on all relevant meteorological factors (Allen et al., 1998; Shaw and Rida, 2011). Over a period of longer than 10 years it is reasonable to neglect the storage change ( S) (Chen et al., 2013). The reference evapotranspiration is a function of the hydro-meteorological variables, as shown in Eq.
(13) (Allen et al., 1998):
(13)
where ET
ois the reference evapotranspiration, T
minis the minimum temperature, T
maxis the maximum temperature, SH is the sunshine duration, WS is the wind speed, and RH is the relative humidity.
The sensitivity of ET
oto the hydro-meteorological variables can be estimated using Eq. (14):
(14)
where x represents the hydro-meteorological variables in Eq. (13) and S
xis the sensitivity of ET to the respective hydro-meteorological variables.
Results and Discussion
Variation
Table 1 shows the mean and variation (standard deviation) of the hydro-meteorological variables from 1960 to 2010. The Han River basin had the lowest T
min, while Nakdong had the highest T
max. The variation of T
minws highest in the Nakdong river basin,
R ET RO= + +ΔSΔ
Δ
ETo=f T( min, Tmax, SH WS RH, , )
Sx ∂ETo
---∂x
=
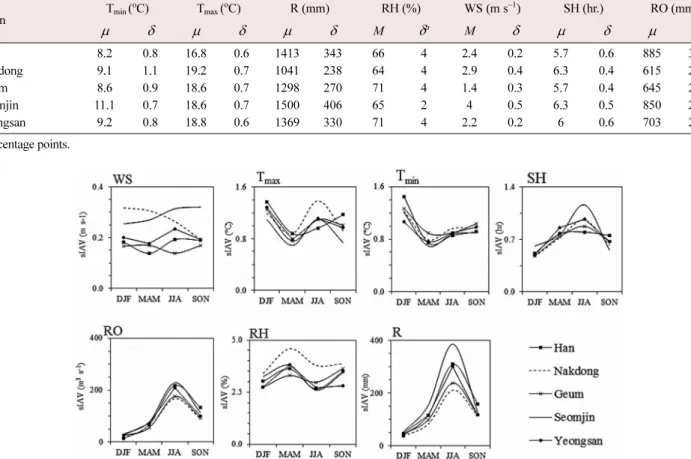
Table 1. Mean ( μ) and standard deviation (δ) of hydro-meteorological variables
BasinTmin (oC) Tmax (oC) R (mm) RH (%) WS (m s−1) SH (hr.) RO (mm)
μ δ μ δ μ δ
Mδ
a Mδ μ δ μ δ
Han 8.2 0.8 16.8 0.6 1413 343 66 4 2.4 0.2 5.7 0.6 885 317
Nakdong 9.1 1.1 19.2 0.7 1041 238 64 4 2.9 0.4 6.3 0.4 615 236
Geum 8.6 0.9 18.6 0.7 1298 270 71 4 1.4 0.3 5.7 0.4 645 224
Seomjin 11.1 0.7 18.6 0.7 1500 406 65 2 4 0.5 6.3 0.5 850 292
Yeongsan 9.2 0.8 18.8 0.6 1369 330 71 4 2.2 0.2 6 0.6 703 267
aPercentage points.
Figure 2. Seasonal inter-annual variability (sIAV) of hydro-meteorological variables.
yet the variation of T
maxwas more or less the same in all the river basins. The rainfall and runoff had the largest relative variation. In general, for R and RO, the magnitude of the standard deviation increased with the magnitude of the variable. While the runoff values for the Nakdong and Geum were larger than the runoff for the Seomjin and Yeongsan in units of depth, the reverse was true when m
3and s
−1were used.
In Figure 2, sIAV for the sunshine duration, rainfall, and runoff peaked for the JJA season and was lowest for the DJF season.
However, for T
minand T
max, sIAV peaked in DJF and was lowest in MAM. In contrast, sIAV for the relative humidity peaked in MAM and was lowest in DJF. The patterns of sIAV for the wind speed were idiosyncratic to each river basin, yet generally peaked in JJA and were lowest in MAM. It is of interest that the sIAV patterns for rainfall and runoff were quite similar. The variation herein is similar to previously reported studies where the variation was generally highest in seasons where the parameter was highest.
IAV is shown in Table 2.
Trend analysis
Regression analysis
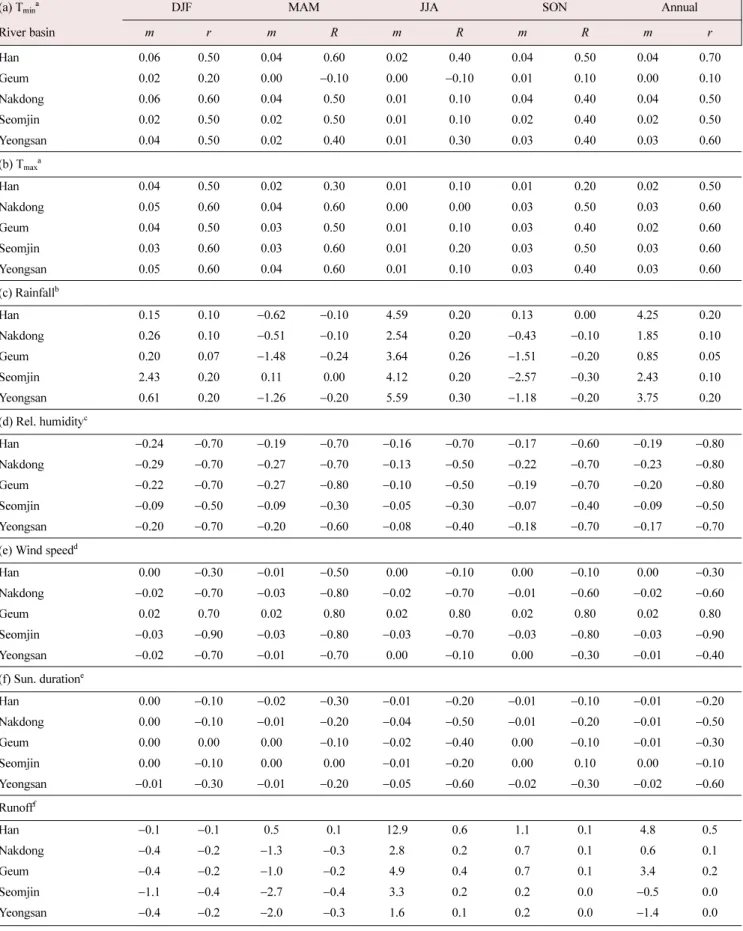
Table 3 shows the seasonal and annual trends and rates of change in the meteorological variables and runoff detected by linear regression. With the exception of the Geum river basin, T
minfrom the other River basins showed a positive moderate correlation with time. Plus, T
minroughly increased by between 0.02 and 0.04
oC per year. In general, no trends were detected for the JJA season. The highest positive trend was shown for the Han and Nakdong river basins.
For T
max, all the river basins showed a moderate correlation. No trends were determined for the JJA season. The upward trends were 0.02-0.03
oC per year. Similar to Kim et al. (2013), a stronger decrease in T
minthan in T
maxwas observed. The seasonal and annual rainfall showed a very weak correlation in all the river basins. The JJA rainy season showed a better correlation with positive trends between 2.5 and 4.6 mm yr.
−1. Overall, unreliable positive trends of between 1.9 to 4.6 mm yr.
−1were shown. The seasonal and annual relative humidity showed a moderate to strong correlation with time and a decreasing trend (−0.3 to 0.1% yr.
−1).
The regression analysis showed that the correlation of the wind speed (WS) to time was negative (decreasing trend) and ranged
from moderate to very strong. The rate of change in WS ranged from 0.00 to 0.03 m s
−1yr.
−1. The regression test did not detect a reliable trend for the JJA and SON seasons for the Han and Yeongsan river basins. The correlation of the seasonal and annual sunshine duration (SH) was weak to moderate and mostly negative. The trend of SH was most reliable for the JJA season.
The annual trend ranged from 0.01 to −0.02 hr. yr
−1. A similar pattern where SH decreased more in the JJA season was also previously shown (Zongxing et al., 2012), where the decreases were attributed to changes in the water vapor and cloud cover.
Meanwhile, a moderate correlation was shown for the runoff for the Seomjin and Han river basins. For the Seomjin river basin, a moderately reliable trend was observed in DJF and MAM, while for the Han river basin it was observed in JJA. The trends in JJA were more likely to have a larger effect on the trends of the mean annual runoff than the other seasons, as over 60% of the runoff flowed in JJA. Overall, the runoff increased by a depth (flow/area) of about 5 mm yr
−1or discharge of 11 m
3s
−1yr
−1.
Mann-Kendall test and Sen’s estimator
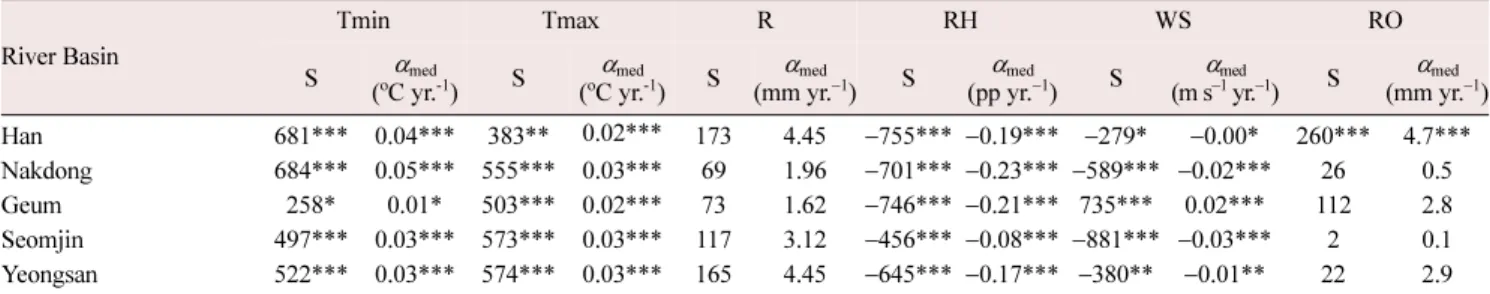
Table 4 shows the results of the Mann-Kendall test and Sen’s slope estimator for the meteorological variables and runoff.
Generally, the results were similar to those of the regression analysis above. However, in the MK test, the trends for T
minwere slightly higher (0.03-0.04
oC yr
−1). Both the regression and the MK tests showed that the increase in T
minwas higher than the increase in T
max. This point was also corroborated by the historical trends observed by Lobell et al. (2007), where there was a reduction in the diurnal temperature range. The failure to detect a statistically significant trend for the rainfall can be explained by the high variability in the rainfall over the study period. The standard deviation ranged from 20 to 30% of the mean rainfall. For the relative humidity, since the dispersion or variability (δ) was low and the data were highly correlated, the trend was statistically significant and reliable. On average, WS decreased by about 0.01 m s
−1yr.
−1. The trends detected for WS herein are in line with previous studies, where the decreasing trend in WS was attributed to a change in the atmospheric circulation due to a weakening of the lower-tropospheric pressure-gradient force (Guo et al., 2011).
The Mann-Kendall test and Sen’s estimator also detected statistically significant trends in RO, yet only for the Han River basin. It is unclear why the trends in the runoff for the Han River basin were statistically significant, as the rainfall in the basin did
Table 2. Inter-annual variability (IAV) of hydro-meteorological variablesBasin Tmin (oC) Tmax (oC) R (mm) RH (ppc) WS (m s−1) SH (hr.) RO (mm)
Han 0.58 0.58 381 1.9 0.11 0.44 289
Nakdong 0.68 0.62 266 2.5 0.21 0.38 268
Geum 0.67 0.58 322 2.3 0.12 0.39 93
Seomjin 0.61 0.53 495 1.8 0.18 0.44 112
Yeongsan 0.56 0.62 368 2.1 0.15 0.46 101
c Percentage points
Table 3. Slope (m) and correlation coefficient (r) for hydro-meteorological parameters
(a) Tmina DJF MAM JJA SON Annual
River basin m r m R m R m R m r
Han 0.06 0.50 0.04 0.60 0.02 0.40 0.04 0.50 0.04 0.70
Geum 0.02 0.20 0.00 −0.10 0.00 −0.10 0.01 0.10 0.00 0.10
Nakdong 0.06 0.60 0.04 0.50 0.01 0.10 0.04 0.40 0.04 0.50
Seomjin 0.02 0.50 0.02 0.50 0.01 0.10 0.02 0.40 0.02 0.50
Yeongsan 0.04 0.50 0.02 0.40 0.01 0.30 0.03 0.40 0.03 0.60
(b) Tmaxa
Han 0.04 0.50 0.02 0.30 0.01 0.10 0.01 0.20 0.02 0.50
Nakdong 0.05 0.60 0.04 0.60 0.00 0.00 0.03 0.50 0.03 0.60
Geum 0.04 0.50 0.03 0.50 0.01 0.10 0.03 0.40 0.02 0.60
Seomjin 0.03 0.60 0.03 0.60 0.01 0.20 0.03 0.50 0.03 0.60
Yeongsan 0.05 0.60 0.04 0.60 0.01 0.10 0.03 0.40 0.03 0.60
(c) Rainfallb
Han 0.15 0.10 −0.62 −0.10 4.59 0.20 0.13 0.00 4.25 0.20
Nakdong 0.26 0.10 −0.51 −0.10 2.54 0.20 −0.43 −0.10 1.85 0.10
Geum 0.20 0.07 −1.48 −0.24 3.64 0.26 −1.51 −0.20 0.85 0.05
Seomjin 2.43 0.20 0.11 0.00 4.12 0.20 −2.57 −0.30 2.43 0.10
Yeongsan 0.61 0.20 −1.26 −0.20 5.59 0.30 −1.18 −0.20 3.75 0.20
(d) Rel. humidityc
Han −0.24 −0.70 −0.19 −0.70 −0.16 −0.70 −0.17 −0.60 −0.19 −0.80
Nakdong −0.29 −0.70 −0.27 −0.70 −0.13 −0.50 −0.22 −0.70 −0.23 −0.80
Geum −0.22 −0.70 −0.27 −0.80 −0.10 −0.50 −0.19 −0.70 −0.20 −0.80
Seomjin −0.09 −0.50 −0.09 −0.30 −0.05 −0.30 −0.07 −0.40 −0.09 −0.50
Yeongsan −0.20 −0.70 −0.20 −0.60 −0.08 −0.40 −0.18 −0.70 −0.17 −0.70
(e) Wind speedd
Han 0.00 −0.30 −0.01 −0.50 0.00 −0.10 0.00 −0.10 0.00 −0.30
Nakdong −0.02 −0.70 −0.03 −0.80 −0.02 −0.70 −0.01 −0.60 −0.02 −0.60
Geum 0.02 0.70 0.02 0.80 0.02 0.80 0.02 0.80 0.02 0.80
Seomjin −0.03 −0.90 −0.03 −0.80 −0.03 −0.70 −0.03 −0.80 −0.03 −0.90
Yeongsan −0.02 −0.70 −0.01 −0.70 0.00 −0.10 0.00 −0.30 −0.01 −0.40
(f) Sun. duratione
Han 0.00 −0.10 −0.02 −0.30 −0.01 −0.20 −0.01 −0.10 −0.01 −0.20
Nakdong 0.00 −0.10 −0.01 −0.20 −0.04 −0.50 −0.01 −0.20 −0.01 −0.50
Geum 0.00 0.00 0.00 −0.10 −0.02 −0.40 0.00 −0.10 −0.01 −0.30
Seomjin 0.00 −0.10 0.00 0.00 −0.01 −0.20 0.00 0.10 0.00 −0.10
Yeongsan −0.01 −0.30 −0.01 −0.20 −0.05 −0.60 −0.02 −0.30 −0.02 −0.60
Runofff
Han −0.1 −0.1 0.5 0.1 12.9 0.6 1.1 0.1 4.8 0.5
Nakdong −0.4 −0.2 −1.3 −0.3 2.8 0.2 0.7 0.1 0.6 0.1
Geum −0.4 −0.2 −1.0 −0.2 4.9 0.4 0.7 0.1 3.4 0.2
Seomjin −1.1 −0.4 −2.7 −0.4 3.3 0.2 0.2 0.0 −0.5 0.0
Yeongsan −0.4 −0.2 −2.0 −0.3 1.6 0.1 0.2 0.0 −1.4 0.0
Note:m in: aoC yr−1 , b mm yr−1, cpercentage points yr−1 , dm s−1 yr−1, ehr. yr−1, fm3 s−1 yr−1.
not show any trends. A possible reason could be the land use changes (urbanization) that have occurred as a result in a rapid increase in the population of about 12,000,000 people since 1970 (Water Management Information System, http://wamis.go.kr), which were not seen in the other river basins. Overall, the Mann- Kendall and Sen’s non-parametric tests did not show any large disparities with the simple linear regression analysis in detecting the direction and magnitude of the trends over time.
Attribution
Correlation
The univariate regressions of the meteorological variables to RO are shown in Table 5. When only considering r, the sunshine duration was generally best correlated to the runoff, followed by the rainfall rather than T
max. However, when also considering m, it was clear that none of the variables could be used alone to predict RO. Yet, despite the poor direct correlation of the meteorological variables to RO, the indirect contribution of each meteorological variable to ET substantially altered RO.
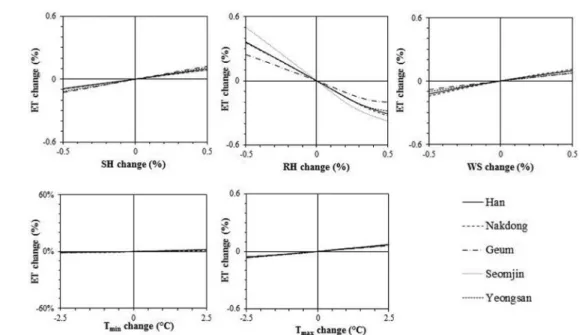
Sensitivity of ET to hydro-meteorological variables
Figure 3 shows the sensitivity analysis of the meteorological variables to ET
o. Note that the y-axis is the relative change in ET
orather than S
xitself in Eq. 14. The sensitivity of ET
owas in the order RH>SH>WS>T
max>T
min, which is similar to previous studies in other regions. The sensitivity of ET
oto RH, SH, WS, T
max, and T
minwas −0.9 to −0.5, 0.23, 0.18, 0.13%
oC
−1, and 0.02%
oC
−1, respectively. As is custom in climate change studies,
the relative changes were used for RH, SH, and WS and the absolute changes used for T
minand T
max.
The large differences in the sensitivity of ET
oto RH were caused by the differences in the initial conditions of ET and RH.
The baseline ET
ofor the Han, Nakdong, Geum, Seomjin, and Yeongsan river basins was 2.69, 3.18, 2.52, 3.26, and 2.77 mm day
−1, respectively.
Water balance
Table 6 shows the annual water balance closure for the river basins. The offset (R-ET (y-axis) intercept) was not assessed, as the focus of this study was on the relative relationships.
Notwithstanding, since the actual ET is an undetermined proportion of ET
o, the difference between the rainfall and ET
ois generally a better predictant of runoff than any single variable in terms of m and r
2.
Overall, in the 5 Korean major river basins from 1970 to 2010, an increase of 1% in RH, SH, WS and 1
oC in T
maxand T
mininduced a change of −1 to −0.5%, 0.23%, 0.18%, 0.13%, and 0.02% in ET
o, respectively. The changes in annual ET
obetween 1% and 0.02% corresponded to only 12 mm and 0.2 mm, respectively. In this study, the changes in T
min, T
max, RH, and WS ranged from 0.5 to 2.5, 1 to 1.5, −11.5 to −4, and −1.5 to 1, respectively. These changes then translated into changes in ET
oof between −15% and 10%, corresponding to changes in RO of between +178 mm and −116 mm, respectively. Using the assumption that sensitivity still applies when more than one variable changes, the expected increase in ET
ofor the Han river basin was 13%, corresponding to a decrease in RO of 126 mm. However, the RO increased by ca. 235 mm over the same period (4.7 mm yr
−1).
Table 4. MK statisic (S) and Sen’s slope (amed) for hydro-meteorological variables
River Basin
Tmin Tmax R RH WS RO
S αmed
(oC yr.-1) S αmed
(oC yr.-1) S αmed
(mm yr.−1) S αmed
(pp yr.−1) S αmed
(m s−1 yr.−1) S αmed (mm yr.−1)
Han 681*** 0.04*** 383** 0.02*** 173 4.45 −755*** −0.19*** −279* −0.00* 260*** 4.7***
Nakdong 684*** 0.05*** 555*** 0.03*** 69 1.96 −701*** −0.23*** −589*** −0.02*** 26 0.5
Geum 258* 0.01* 503*** 0.02*** 73 1.62 −746*** −0.21*** 735*** 0.02*** 112 2.8
Seomjin 497*** 0.03*** 573*** 0.03*** 117 3.12 −456*** −0.08*** −881*** −0.03*** 2 0.1
Yeongsan 522*** 0.03*** 574*** 0.03*** 165 4.45 −645*** −0.17*** −380** −0.01** 22 2.9
***p<0.001, **p<0.01, *p<0.05.
Table 5. Slope (m) and correlation coefficient (r) for plots of meteorological variables versus RO
River basin Tmin Tmax R RH WS SH
m a r m a r mb r m c r m d r me r
Han −4 −0.1 18 0.3 0 −0.3 3 0.3 6 0.0 27 0.5
Nakdong −10 −0.2 29 0.5 0 −0.6 1 0.1 37 0.3 57 0.5
Geum −5 −0.1 16 0.3 0 −0.3 1 0.1 −44 −0.4 43 0.5
Seomjin −7 −0.1 21 0.3 0 −0.4 4 0.2 30 0.3 48 0.6
Yeongsan −7 −0.1 20 0.3 0 −0.4 3 0.2 4 0.0 58 0.7
aoC mm−1, bmm mm−1, cpercentage points mm−1, dm s-1 mm−1, ehr. mm−1.
With minimal confidence, it can be claimed that the variation in RO was largely due to the variation of the rainfall rather than ET
o. The limitation is that the rainfall and runoff trends were not statistically significant enough to allow more concrete attribution.
Using longer periods, Chung et al. (2004) observed a significant increase in precipitation of 259 mm over 97 years.
The results of this study are particularly important for agriculture, which is very sensitive to the ambient environment and water availability. The potential and attainable crop growth and yields are affected by the changes in climate studied herein and management practices. The integrated responses to the changes in the climate variables are based on transduction pathways and are complex. Combinations of changes, such as an increase in temperature and decrease of rainfall, can exacerbate the environment for crops, while a slight increase in temperature and decrease in relative humidity could ameliorate the environment for crops. Thus, future studies should investigate the interaction of the variables analyzed herein, with more data points and longer time periods.
Conclusions
The historical trends (1960-2010) in the seasonal and annual temperature, relative humidity, wind speed, sunshine duration, and runoff for 5 major river basins were assessed. The following inferences can be drawn from this study:
●
The minimum temperature had a higher increasing trend than the maximum temperature, and the average temperature increased by about 0.03
oC yr.
−1.
●
The relative humidity and wind speed decreased by 0.02% yr
−1and 0.01 m s
−1yr
−1, respectively.
●
There were no significant trends detected for rainfall, largely due to the high year to year rainfall variability.
●
With the exception of the Han River basin, the regression analysis, Mann-Kendall test, and Sen’s estimator failed to detect any trends in the runoff over the study period.
Future studies should investigate the interaction of the variables analyzed herein using more data points and longer time periods
Acknowledgments
This research was supported by Basic Science Research Program through the National Research Foundation of Korea (NRF) funded by the Ministry of Education, Science and Technology (NO. 2010-0007884).
References
Allen RG, Pereira LS, Raes D, Smith M (1998) Crop evapotranspiration:
guidelines for computing crop water requirements. Food and Figure 3. Sensitivity of ET to hydro-meteorological variables.
Table 6. Slope (m), coefficient of determination (r2) and offset for plot of R-ETo versus observed RO
River basin R-ETo (mm) versus observed RO (mm)
m r2 Offset
Han 0.88 0.63 −354.83
Nakdong 1.15 0.91 −750.14
Geum 1.12 0.78 0500.37
Seomjin 1.09 0.54 −322.15
Yeongsan 1.26 0.89 −541.87
All 1.17 0.69 −551.75
Agriculture Organization of the United Nations, Rome.
Bae DH, Jung IW, Chang HJ (2008) Long-term trend of precipitation and runoff in Korean river basins. Hydrological Process 22: 2644-2656.
Chen Z, Chen Y, Li B (2013) Quantifying the effects of climate variability and human activities on runoff for Kaidu River Basin in arid region of northwest China. Theor Appl Climatol 111: 537-545.
Chung YS, Yoon MB, Kim HS (2004) On climate variations and changes observed in South Korea. Climatic change 66: 151-161.
Gocic M, Trajkovic S (2013) Analysis of changes in meteorological variables using Mann-Kendall and Sen's slope estimator statistical tests in Serbia. Glob Planet Change 100: 172-182.
Guo H, Xu M, Hu Q (2011) Changes in near-surface wind speed in China:
1969-2005. Int J Climatol 31: 349-358.
Ingram W (2013) A new way of quantifying GCM water vapour feedback.
Clim Dyn 40: 913-924.
IPCC (2013) IPCC WGI Fifth Assessment Report, study 2-observations:
atmosphere and surface. IPCC Secretariat, Switzerland.
Jhajharia D, Singh VP (2011) Trends in temperature, diurnal temperature range and sunshine duration in Northeast India. Int J Climatol 31:
1353-1367.
Jiang Y, Luo Y, Zhao Z, Tao S (2010) Changes in wind speed over China during 1956–2004. Theor Appl Climatol 99: 421-430.
Kim CG, Lee SM, Jeong HK, Jang JK, Kim YH, Lee CK (2010) Impacts of climate change on Korean agriculture and Its counterstrategies.
Korea Rural Economic Institute, The Republic of Korea.
Kim OY, Wang B, Shin SH (2013) How do weather characteristics change in a warming climate? Clim Dyn 41: 3261-3281.
Kuwagata T, Ishikawa-Sakurai J, Hayashi H, Nagasuga K, Fukushi K, Ahamed A, Takasugi K, Katsuhara M, Murai-Hatano M (2012) Influence of low air humidity and low root temperature on water uptake, growth and aquaporin expression in rice plants. Plant Cell
Physiol 53: 1418-1431.
Lobell DB, Bonfils C, Duffy PB (2007) Climate change uncertainty for daily minimum and maximum temperatures: A model inter- comparison. Geophys Res Lett 34: L05715.
Önöz B, Bayazit M (2012) Block bootstrap for Mann–Kendall trend test of serially dependent data. Hydrol Process 26: 3552-3560.
Osborn TJ, Hulme M, Jones PD, Basnett TA (2000) Observed trends in the daily intensity of United Kingdom precipitation. Int J Climatol 20:
347-364.
Rahimzadeh F, Pedram M, Kruk MC (2014) An examination of the trends in sunshine hours over Iran. Meteorol Appl 21: 309-315
Shaw SB, Riha SJ (2011) Assessing temperature-based PET equations under a changing climate in temperate, deciduous forests. Hydrol Process 25: 1466-1478.
Stott PA, Gillett NP, Hegerl GC, Karoly DJ, Stone DA, Zhang X, Zwiers F (2010) Detection and attribution of climate change: a regional perspective. Wiley Interdiscip Rev Clim Change 1: 192-211.
Viswanadham Y, Ramanadham R (1969) The relation between solar radiation and hours of bright sunshine at some tropical stations. Pure Appl Geophys 74: 186-194
Yan C, Ding Y, Wang Q, Liu Z, Li G, Muhammad I, Wang S (2010) The impact of relative humidity, genotypes and fertilizer application rates on panicle, leaf temperature, fertility and seed setting of rice. J Agric Sci 148: 329-339
Young IR, Zieger S, Babanin AV (2011) Global trends in wind speed and wave height. Science 332: 451-455.
Zongxing L, Qi F, Wei Z, Yuanqing H, Xufeng W, Catto N, Wenlin A, Jiankuo D, Aifang C, Li L, Meng H (2012) Decreasing trend of sunshine hours and related driving forces in Southwestern China.
Theor Appl Climatol 109: 305-321.